-, AND R. H. PETERS. 1994. Patterns in planktonic P:R ratios: Influence of lake trophy and dissolved organic car- bon. Limnol. Oceanogr. 39: 772-787.
DENIRO, M. J., AND S. EPSTEIN. 1978. Influence of diet on the distribution of carbon isotopes in animals. Geochim. Cos- mochim. Acta 42: 495-506.
ELSER, J. J., AND R. P. HASSETT. 1994. A stoichiometric anal- ysis of the zooplankton-phytoplankton interaction in ma- rine and freshwater ecosystems. Nature 370: 2 1 l-2 13. FRANCE, R. L. 1995. Differentiation between littoral and pe-
lagic food webs in lakes using stable carbon isotopes. Lim- nol. Oceanogr. 40: 13 1 O-l 3 13.
FRY, B., R. K. ANDERSON, L. ENTZEROTH, J. L. BIRD, AND P. L. PARKER. 1984. 13C enrichment and oceanic food web structure in the northwestern Gulf of Mexico. Contrib. Mar. Sci. 27: 49-63.
-, AND E. SHERR. 1984. 613C measurements as indicators of carbon flow in marine and freshwater ecosystems. Con- trib. Mar. Sci. 27: 15-47.
GOERING, J., V. ALEXANDER, AND N. HAUBENSTOCK. 1990. Seasonal variability of stable carbon and nitrogen isotope ratios of organisms in a North Pacific bay. Estuarine Coastal Shelf Sci. 30: 239-260.
GRIESBACH, S. J., AND R. H. PETERS. 1991. The effects of analytical variations on estimates of phosphorus concen- tration in surface waters. Lake Reservoir Manage. 7: 97-
106.
Gu, B., D. M. SCHELL, AND V. ALEXANDER. 1994. Stable car- bon and nitrogen isotopic analysis of the plankton food web in a subarctic lake. Can. J. Fish. Aquat. Sci. 51: 1338-l 344. HAMILTON, S. IS., AND W. M. LEWIS, JR. 1992. Stable carbon
and nitrogen isotopes in algae and detritus from the Orinoco River floodplain, Venezuela. Geochim. Cosmochim. Acta 56: 4237-4246.
JEFFREY, A. W. A., R. C. PFLAUM, J. M. BROOKS, AND W. M. SACKETT. 1983. Vertical trends in particulate carbon 13C: l*C ratios in the upper water column. Deep-Sea Res. 30: 97 l-983.
KLING, G. W., B. FRY, AND W. J. O'BRIEN. 1992. Stable iso-
topes and planktonic trophic structure in arctic lakes. Ecol- ogy 73: 56 l-566.
MC~ONNAUGHEY, T., AND C. P. MCROY. 1979. Food-web structure and the fractionation of carbon isotopes in the Bering Sea. Mar. Biol. 53: 257-262.
MEILI, M. 1992. Sources, concentrations and characteristics of organic matter in softwater lakes and streams of the Swedish forest region. Hydrobiologia 229: 23-4 1. -, B. FRY, AND G. W. KLING. 1993. Fractionation of
stable isotopes ( 13C, 15N) in the food web of a humic lake. Int. Ver. Theor. Angew. Limnol. Verh. 25: 501-505. PETERSON, B. J., AND B. FRY. 1987. Stable isotopes in eco-
system studies. Annu. Rev. Ecol. Syst. 18: 293-320. -, B. FRY,M. HULLAR,S.SAUPE,AND R. WRIGHT. 1994.
The distribution and stable carbon isotopic composition of dissolved organic carbon in estuaries. Estuaries 17: 11 l-
121.
QUAY, P. D., S. R. EMERSON, B. M. QUAY, AND A. H. DEVOL. 1986. The carbon cycle for Lake Washington-A stable isotope study. Limnol. Oceanogr. 31: 596-611.
RAU, G. H. 1978. Carbon-l 3 depletion in a subalpine lake: Carbon flow implications. Science 201: 901-902.
-, M. HEYRAND, AND T.R. D. CHERRY. 1989. 15N/14N and 13C/12C in mesopelagic shrimp from the northeast At- lantic Ocean: Evidence for differences in diet. Deep-Sea Res. 36: 1103-l 110.
TAKAHASHI,K., E. WADA,AND M. SAKAMOTO. 1990. Carbon isotope discrimination by phytoplankton and photosyn- thetic bacteria in monomictic Lake Fukami-ike. Arch. Hy- drobiol. 120: 197-2 10.
ZOHARY, T.,J. EREZ, M. GOPHEN, I. BERMAN-FRANK, AND M. STILLER. 1994. Seasonality of stable carbon isotopes with- in the pelagic food web of Lake Kinneret. Limnol. Ocean- ogr. 39: 1030-1043.
Submitted: 26 March 1995 Accepted: 1 August 1995 Amended: 1.5 November 1995
Limnol. Oceanogr., 4 l(2), 1996, 365-369
0 1996, by the American Society of Limnology and Oceanography, Inc.
Atmospheric CO, fluxes in a highly polluted estuary (the Scheldt)
Abstract-Dissolved CO, concentration and exchange with the atmosphere were investigated simultaneously in the Scheldt estuary. CO, partial pressures as high as 5,700 patm, corresponding to oversaturation with respect to the atmosphere of 1,600%, were observed in the upper estuary. The corresponding atmospheric CO, fluxes reached values of up to 1.2 mol m-* d-l. The estimated flux for the entire estuary amounts to 600 t of C d-l for a river discharge of < 1 x lo6 m3 d-l.
Estuaries under strong tidal influence are characterized by long residence times of freshwater masses, and this favors chemical and biological transformations of the components carried by rivers. These transformations
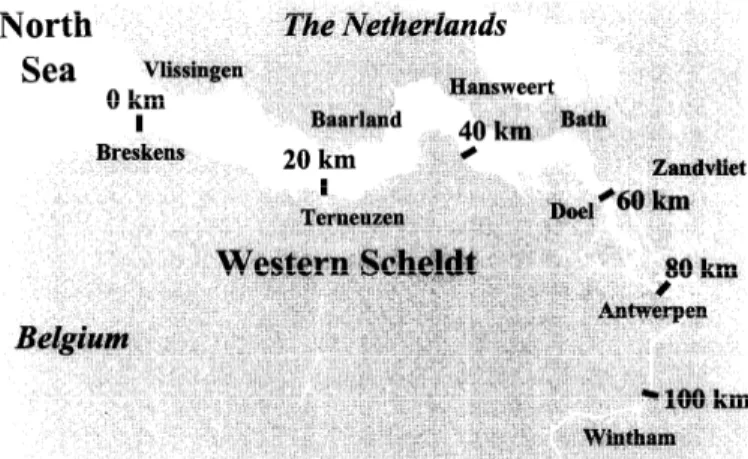
deeply modify the fluxes and transport of these compo- nents to the sea. Furthermore, estuaries are often centers of intense anthropogenic activities and thereby constitute highly disturbed ecosystems; this is the case for the river Scheldt, which traverses one of the most populated and industrialized areas of Europe (the north of France and Belgium and the south of the Netherlands, Fig. 1). The estuary receives - 100 X lo3 t of organic C per year, main- ly of anthropogenic origin, of which a large fraction is respired in the estuarine zone (Wollast 1988). Due to the hydrodynamic conditions imposed by the high tidal re- gime (mean tidal amplitude at the mouth, 4.5 m) and the relatively low water discharge (3 km3 yr-‘), this organic matter accumulates preferentially in the upper estuary, between salinities of 2 and 10 (Wollast 1983). In this area,
Fig. 1. Map of the Scheldt estuary.
intense bacterial degradation induces permanent anaer- obic conditions (Fig. 2).
The tidal prism, which represents the volume of sea- water entering the estuary during one tide divided by the volume of freshwater discharged during the same period, amounts to 260 (Wollast and Peters unpubl.). The mixing zone between freshwater and seawater extends, therefore, over 100 km (Fig. 2), and 2 months are required for Scheldt water to reach the sea.
Because of intense bacterial respiration, the long resi- dence time of freshwater in the estuarine region favors buildup of high partial pressure of CO2 @CO,) in the water column. As shown in Fig. 3, pC0, reaches 5,700 patm at a salinity of - 5, which also corresponds to the turbidity maximum and where the highest bacterial deg- radation activity can be expected. The oversaturation of pC0, with respect to atmospheric equilibrium (presently - 355 patm) is close to 1,600%. According to Kempe (1982), marked oversaturation of CO, occurs in many estuaries, but pC0, rarely exceeds 2,500 patm in his ob- servations.
In our work, pC0, is calculated from pH and total alkalinity (TAlk) measurements. The latter is determined by electrotitration (Gran plots) on loo-ml GF/C-filtered samples. pH is measured with a Ross (Orion) combina- tion electrode calibrated against phosphate and phthalate NBS buffers (Bates 1973). The partial pressure of CO2 is calculated with the constants from Mehrbach et al. (1973) and Lyman ( 197 5) and the CO2 solubility coefficient from Weiss (1974). Reproducibilities of pH and TAlk mea- sured aboard ship are 0.005 pH unit and 4 peq kg-l. The resulting error on pC0, depends also on the water buf- fering capacity and thus on pH, alkalinity, and salinity. In our experimental conditions, this error ranges from 6 patm in seawater to 65 in freshwater.
Salinity and temperature are measured with a SBE 19 probe, and dissolved oxygen is determined by the Winkler method. The oxygen saturation level is computed with the algorithm of Benson and Krause (1984).
The flux of CO2 to the atmosphere induced by this strong oversaturation has been estimated with the bell
Salinity Oxygen 30’- : . 8 . - 300 0 IL 0 . n 0 20 - a 0 - 200 : . n 0 10 - n n 100 l = n . n 0 0 0 0 20 40 60 80 100 Distance (km)
Fig. 2. Distribution of salinity \ and oxygen (0, in pmol kg-l) in the Scheldt estuary, March 1993.
method, which consists of continuously recording the change of pC0, (infrared analyzer LiCor 625 2) in the volume of air entrapped in a floating bell resting at the surface of the water (Frankignoulle 1988). To study the same water mass and to avoid turbulence generated by an anchored bell in a strong current, we adopted a La- grangien floating system. The surface for exchange in the bell is 0.212 m2, and the total entrapped air volume is 0.05 1 m3. The error on flux measurements is estimated to be -25%. The results of these measurements are given in Fig. 3.
In the area of the pCOz maximum, we observed fluxes as high as 1.2 mol m-2 d-l. Integration of our observa- tions over the entire surface of the estuary yields a flux of 600 t of C d-l to the atmosphere. This huge flux is due partly to the very high pC0, values observed in the upper estuary and also to exchange across the large surface of the lower estuary, where the fluxes remain close to 50 mmol m-2 d-l.
The gas flux at the air-water interface can be expressed as the product of a piston velocity and the difference in CO2 concentration between the two phases. The calcu- lated piston velocity remains rather constant over the entire estuary, with a mean value and standard deviation of 13.5 + 4.9 cm h-l. This value is of the same order of magnitude as the range reported for marine systems (Liss and Merlivat 1986; Wanninkhof 1992) and is typical for moderately turbulent rivers (Bennet and Rathbun 1972; Wilcock 1984) at low wind speeds (~3.6 m s-l). Clark et al. (1994) determined the gas exchange rate in the Hud- son River with a dual tracer technique and proposed val- ues of K ranging from 1 to 9 cm h-l for a Schmidt number (SC) normalized to 600. In our experimental conditions
(t- 9°C) the CO, Schmidt number is - 12 10 (Wannink-
hof 1992) and our calculated value of IS, corrected to SC = 600 (K 0~ SC-~/~), is 8.4L3.1 cm h-l, which is in good agreement with the results of Clark et al. (1994).
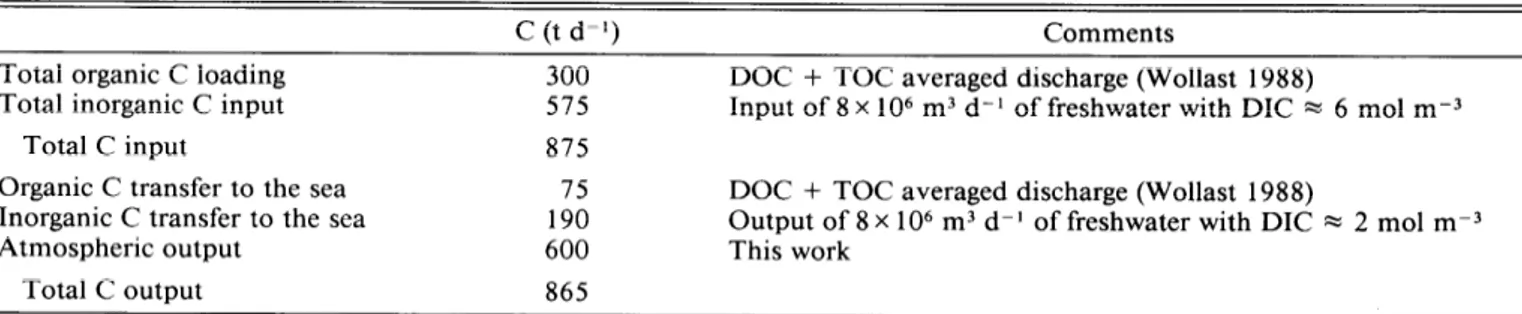
We attempted to evaluate the daily fluxes of organic and inorganic C in the estuary (Table 1) from our data and from the annual averaged fluxes of organic C at the boundaries of the estuary taken from Wollast (1988). This
Flux
1.4 1.2 1.0 0.8 0.6 0.4 0.2 0.0 1 ---- 1.8 3.5 6 80 I I _- ~~- 7 11 14 16 19.5 25 31 Salinity 6000Fig. 3. Distribution of the partial pressure (+, in Fatm) and atmospheric fluxes of CO, (bars, in mol m-2 d-l) vs. salinity in the Scheldt estuary, March 1993. The error on pC02, computed from pH and TAlk precision, is given vs. salinity.
Table 1. Estimation of daily carbon fluxes in the Scheldt estuary.
C (t d-l) Comments
Total organic C loading 300
Total inorganic C input 57.5
Total C input 875
Organic C transfer to the sea 75 Inorganic C transfer to the sea 190
Atmospheric output 600
Total C output 865
DOC + TOC averaged discharge (Wollast 1988)
Input of 8 x lo6 m3 d-l of freshwater with DIC x 6 mol m-3
DOC + TOC averaged discharge (Wollast 1988)
Output of 8 x lo6 m3 d-l of freshwater with DIC M 2 mol m-3 This work
budget is surprisingly good-the large uncertainties on individual fluxes notwithstanding. The total dissolved in- organic C (DIC) budget in the estuary is, however, com- plicated by the fact that the upper part of the estuary is also an area of intense biological activity. The first ob- vious effect of this activity is to provide a source of in- organic C that compensates for losses of CO, to the at- mosphere. Nevertheless, a plot of DIC vs. salinity, shown in Fig. 4, indicates that there is a net loss of inorganic C that occurs mainly in the upper part of the estuary. A simple calculation, performed at a salinity of 10 and based on the departure of the composition of the water mass from conservative behavior, indicates a net loss of DIC equal to 1.4 mmol kg-‘. On the other hand, the amount of CO2 transferred to the atmosphere between salinity 0 and 10 can be estimated from the fluxes reported in Fig. 3. Taking into account the residence time of the water masses in the upper estuary (-30 d) (Wollast 1988) and the mean river depth (- 5 m), we obtain a loss to the atmosphere of 4.2 mmol kg-‘. This loss corresponds to a mean atmospheric flux of 0.7 mol m-2 d-l. Because
8.2
8.0
7.8
7.6
7.4
PH (NBS) TAlk & DIC
6 * * t * * * * ! * * * 5 l ** $* ** .o* * * 4 $0 z ** * * 3 * * ** -w+\ l l 2 0 5 10 15 20 25 30 35 Salinity
Fig. 4. Distribution of pH (*, NBS scale), TAlk (0, meq kg- I), and DIC (+, mmol kg-‘) vs. salinity in the Scheldt es- tuary, March 1993. Line shows the alkalinity profile calculated from the mixing process of freshwater with seawater and the effect of nitrification on alkalinity (see text).
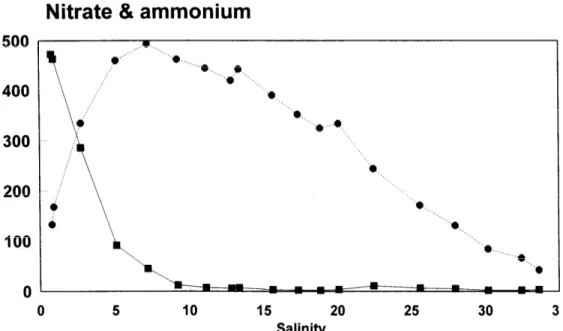
Nitrate & ammonium
500 400 300 200 100 0 a a. l u a l 15 20 25 30 3 SalinityFig. 5. Distribution of ammonium (B, in pmol kg- I) and nitrate (0, in pmol kg-‘) vs. salinity in the Scheldt estuary, March 1993.
the decrease of DIC in the water column is only 1.4 mmol kg-l, 2.8 mmol kg-l of H2C03 must have been added by degradation of organic matter.
It is also interesting that the deficit of dissolved oxygen with respect to the atmospheric equilibrium in the upper part of the estuary (Fig. 2) is very similar to the excess of CO2 in the water column. For example, at a salinity of 1, the oxygen deficit is 283 pmol kg-l and the excess of CO2 is 246 pmol kg- l (5,000 patm, i.e. 1,400% over- saturation). At a salinity of 11, these values are 96 pmol kg-l for O2 and 103 for CO, (2,405 patm, i.e. 677% oversaturation). Because the exchange coefficients of O2 and CO2 at the air-water interface are also similar (Wan- ninkhof 1992) the output flux of CO2 is of the same order of magnitude as the input flux of 02. This observation confirms that a large part of the atmospheric flux of CO, in that area is directly related to respiration of organic matter, although some of the oxygen input (N 1 mmol kg-l) is used to oxidize ammonium, as shown below.
The release of such large amounts of CO2 from the water column should have drastic effects on the pH of the system. For example, if we take the water at the fresh end of the estuary (salinity of 0.8) and let it equilibrate with the atmosphere, it is easy to calculate from chemical equilibrium constraints that this water would lose 0.5 mmol kg-l of CO2 and the pH would rise from 7.60 to 8.82. There is, however, a decrease of pH when the water moves to the sea and loses CO2 to the atmosphere (Fig. 4). This decrease can be explained by the decrease in alkalinity observed in the same area. As demonstrated in Fig. 4, alkalinity also exhibits a nonconservative behavior that can be explained by bacterially mediated nitrification in the upper estuary when oxygen is restored to the system
(Fig. 5). According to the stoichiometry of the nitrification reaction, given by NH, + + 202 + H,O = N03- + 2H30+, each nitrate produced consumes 2 equivalents of alkalin- ity. Thus, from the change in nitrate concentration with increasing salinity, it is easy to calculate the decrease in alkalinity. The result of this calculation is given by the curve in Fig. 4, which fits remarkably with the observed values of alkalinity.
The pH of the system is controlled by the values of alkalinity and DIC, and both parameters are strongly af- fected by bacterial activity-in particular respiration of organic matter and nitrification. Both processes acidify the system, but the release of CO2 to the atmosphere strongly reduces the decrease of pH.
It should be pointed out that there are strong seasonal fluctuations of the material fluxes and of the biological activity due to changes in river discharge and tempera- ture. Annual budgets require extended coverage over the year.
An unexpected conclusion is that although anaerobic conditions prevail in the upper estuary, oxygen remains the dominant oxidant in this biologically active area. The Scheldt results confirm that estuaries are extremely active systems in which there are intense modifications of the nature and fluxes of many components transported by rivers before these components reach the sea. Further- more, many estuarine processes produce greenhouse gas- es. Besides CO, discussed here, the Scheldt is also a sig- nificant potential source of N20 due to intense denitri- fication in the anaerobic zone of the estuary (Billen 1975; Wollast 1983). In addition, high bacterial production of methane can be observed in sediments of the turbidity maximum zone, with massive transfer of this gas to the
water column and the atmosphere. On a global scale, estuaries may act as nonnegligible sources of these gases, and their importance should be more thoroughly inves- tigated.
Michel Frankignoulle Isabelle Bourge Universite de Liege
Laboratoire d’O&anologie Institut de Chimie (Bat B6) B4000 Sart Tilman, Belgium
Roland Wollast Universite Libre de Bruxelles
Service d’oceanographie Chimique
Campus de la Plaine C.P. 208, Bd. du Triomphe B 1050 Bruxelles, Belgium
isotopic fractionation of oxygen dissolved in freshwater and seawater in equilibrium with the atmosphere. Limnol. Oceanogr. 29: 620-632.
BILLEN, G. 197 5. Nitrification in the Scheldt estuary. Estuarine Coastal Shelf. Sci. 3: 79-89.
CLARK, J. F., R. WANNINKH OF,P.?3cHLoSSER,AND H.J. SIMPSON. 1994. Gas exchange rates in the tidal Hudson River using a dual tracer technique. Tellus 46B: 274-285.
FRANKIGNOULLE, M. 1988. Field measurements of air-sea CO2 exchange. Limnol. Oceanogr. 33: 3 13-322.
KJZMPE, S. 1982. Valdivia Cruise, October 198 1: Carbonate equilibria in the estuaries of Elbe, Weser, Ems and in the southern German bight. Mitt. Geol. Paleaontol. Inst. Univ. Hamburg 52: 7 19-742.
LISS, P., AND L. MERLIVAT. 1986. Air-sea exchange rates: In- troduction and synthesis, p. 113-128. In P. Buat-Menard [ed.], The role of air-sea exchanges in geochemical cycling. Reidel.
LYMAN, J. 1975. Buffer mechanism of seawater. Ph.D. thesis, Univ. California, Los Angeles. 196 p.
References
BATES, R. G. 1973. Determination of pH. Theory and practice. Wiley-Interscience.
BENNET, J. P., AND R. E. RATHBUN. 1972. Reaeration in open- channel flow. U.S. Geol. Surv. Prof. Pap. 737.
BENSON, B. B., AND D. KRAUSE. 1984. The concentration and
Acknowledgments
This work was supported by the European Union STEP Pro- gram TTT (Transport, transfer and transformation of particu- late material in estuaries), contract CT90-0065, by the Impulse Program in Marine Sciences supported by the Belgian State, Prime Minister’s services, Science Policy Office, contract MS/ 1 l/060, and by the FNRS, Belgium, with which M.F. is a Re- search Associate.
We thank the officers and crew of the RV Belgica for their assistance during the cruise, and A. Disteche, J. Middelburg, and two anonymous referees for helpful comments, as well as MUMM (Oostende, Belgium) for providing CTD data.
MEHRBACH, C., C. H. CULBERSON, J. E. HAWLEY, AND R. M. PYTKOWICZ. 1973. Measurements of the apparent disso- ciation constants of carbonic acid in seawater at atmo- spheric pressure. Limnol. Oceanogr. 18: 897-907.
WANNINKHOF, R. 1992. Relationship between wind speed and gas exchange over the ocean. J. Geophys. Res. 97: 7373- 7382.
WEISS, R. F. 1974. Carbon dioxide in water and seawater: The solubility of a non-ideal gas. Mar. Chem. 2: 203-2 15. WILCOCK, R. J. 1984. Methylchloride as a gas tracer for mea-
suring stream respiration coefficients. 2. Stream studies. Water Res. 18: 53-57.
WOLLAST, R. 1983. Interactions in estuaries and coastal wa- ters, p. 385-407. In B. Bolin and R. B. Cook [eds.], The major biogeochemical cycles and their interactions. SCOPE 2 1. Wiley-Interscience.
-. 1988. The Scheldt estuary, p. 185-193. In W. Salo- mons et al. [eds.], Pollution of the North Sea: An assess- ment. Springer.
Submitted: 25 February 1995 Accepted: 2 October 1995 Amended: 27 November 1995