HAL Id: hal-02466623
https://hal.archives-ouvertes.fr/hal-02466623
Submitted on 4 Feb 2020
HAL is a multi-disciplinary open access
archive for the deposit and dissemination of
sci-entific research documents, whether they are
pub-lished or not. The documents may come from
teaching and research institutions in France or
abroad, or from public or private research centers.
L’archive ouverte pluridisciplinaire HAL, est
destinée au dépôt et à la diffusion de documents
scientifiques de niveau recherche, publiés ou non,
émanant des établissements d’enseignement et de
recherche français ou étrangers, des laboratoires
publics ou privés.
Characterization of human skin properties with sounds.
The music of the skin
Jean-François Petiot, Ludovic Fouere, Armelle Bigouret, Alex Nkengne, Sonia
Gagnaire, Michèle Thomas, Katelle Vié
To cite this version:
Jean-François Petiot, Ludovic Fouere, Armelle Bigouret, Alex Nkengne, Sonia Gagnaire, et al..
Char-acterization of human skin properties with sounds. The music of the skin. 16e Colloque National
S-mart, Apr 2019, les Karellis, France. �hal-02466623�
16e Colloque National S-mart 1/5 Les Karellis (73) – 3 au 5 avril 2019
Characterization of human skin properties with
sounds
The music of the skin
Jean-François Petiot, Ludovic Fouéré
Ecole Centrale de Nantes, LS2N (UMR CNRS 6004)1, rue de la Noë BP 92101 44321 Nantes, France Jean-Francois.Petiot@ec-nantes.fr
Armelle Bigouret, Alex Nkengne, Sonia Gagnaire,
Michèle Thomas, Katell Vie
Laboratoires CLARINS 5, rue Ampère 95300 Cergy Pontoise, France armelle.bigouret@clarins.com
Abstract: The friction properties of surfaces can be investigated via acoustic sensors that measure the noise generated during the sliding of the probe on the surface. This work presents a characterization of the human skin using a friction sensor, designed to measure the signal generated during the interaction between the finger of the experimenter and the skin of a subject. A panel of subjects (57) with different skin characteristics (age, hydration, firmness) was measured and supervised learning algorithms were used to infer the typology from the labeled data and the signals of the sensor. Next, a sonification of the signals was designed to make audible the differences between the skin categories. The sonification is based on a sound synthesis of a bowed string musical instrument, the violin, which mimics the interaction of the finger with the skin and constitutes a relevant metaphor. From the synthetized sounds corresponding to different experimental conditions (before and after the application of a cosmetic product), hearing tests were performed with a panel of experts. Results show that noticeable differences between the sounds can be highlighted that could make possible to test the efficacy of a product and to promote it with an original musical universe.
Key-words — friction sensor, sonification, supervised learning, hearing tests.
I. INTRODUCTION
The friction properties of the human skin depend on properties such as hydration, ageing and firmness. These properties can be investigated via acoustic or friction sensors [1] [2] [3]. The softness of the human skin can be assessed by a sliding of the finger on the skin. This evaluation can be subjective, with a set of sensory descriptors representative of the perceptions of the experimenter, but also objective, by using measurement devices of the interaction finger/skin.
The aim of the study is to present a new method based on the sonification of a friction sensor for the characterization of skin properties. The work belongs to a more general project, the “music of skin”, whose aim is to highlight the use of cosmetic products with musical sounds. Preliminary results on the sonification of skins were presented in [4] and [5]. This paper is the continuation of that work.
The objectives of this paper are:
• to study to which extent a discrimination of different skin types in relation with hydration, firmness and ageing, is possible, from the data of a friction sensor,
• to determine if sounds representative of differences skin could be discriminated against a hearing test
The paper is organized as follows. Section 2 (material and methods) presents the principles of the typological study with a supervised learning from the data of the sensor, the sound synthesis method to make audible differences between skin characteristics, and the protocol for the product study to test differences between skins properties from hearing tests. Section 3 is dedicated to the results of the supervised learning and the product study. Classification performances of the classifiers and significant differences between the experimental conditions are assessed. Conclusions are drawn in section 4.
II. MATERIAL AND METHODS
A. Friction sensor and measurement
A new vibration sensor was developed by ENISE, LTDS, UMR CNRS 5513. This glove-like device includes an accelerometer, sensitive to the vibrations generated by the friction of the index finger of the experimenter on the skin of the subject, connected to a conditioner and a computer for a real time recording of the signals.
To make the measurement, the experimenter is trained to slide slowly the index finger on the skin of the volunteer with a repeatable pressure and speed. An example of recording of a typical measurement, made of 10 repeated slidings in the same direction, is presented in Figure 1 (raw signal - sampling frequency 44100Hz).
16e Colloque National S-mart 2/5 Les Karellis (73) – 3 au 5 avril 2019
Figure 1. AMPLITUDE VS TIME OF THE RAW SIGNAL OF THE SENSOR FOR
10 REPEATED SLIDINGS OF THE FINGER OF THE EXPERIMENTER ON THE CHEEK OF A PATIENT
B. Signal analysis
Several descriptors can be extracted from the raw signal of the sensor. We focused mainly on spectral descriptors, time-frequency descriptors being irrelevant because too dependent on the gesture of the experimenter. Different spectral descriptors were tested (spectral centroid, variance, skewness, kurtosis, power spectral density) [6]. To summarize the information, the power spectral density was considered according to different frequency bands. Pre-tests showed that frequency bands according to a non-linear Mel scale were the most relevant to characterize the signals. In practice, each sliding of the finger on the skin was characterized by the power spectral density on 30 Mel frequency bands, in the range 100-1500Hz. Average values of these 30 frequency bands across the repetitions were next computed to characterize the skin.
C. Typological study and supervised learning
To classify the skin properties using the data of the sensor, a supervised learning task was conducted on a panel of 57 women (panel 1). For each subject, a measurement consisted in 10 repeated slidings of the finger of the experimenter on the cheek of the subject. Three repetitions of the measurement were carried out in the same session (this gives a total of 30 slidings per subject). The subjects were labeled according to three different properties:
• Age with 3 groups: 20-30 yo (N = 14), 35-50 yo (N = 28), 55-65 yo (N = 15)
• Hydration (measured with a corneometer CM825, Monaderm) with 2 groups: hydrated skin (N = 25), dry skin (N = 17). N.B.: certain subjects were not allocated in any group.
• Firmness (measured with a cutometer MPA 580, Monaderm) with 2 groups: firm skin (cutometer R7 > 0.4 – N = 27), looser skin (cutometer R7 < 0.4 - N = 30).
A general classification problem consists in (1) the discrimination between labeled groups of samples, based on spectral descriptors (variables) from the samples’ signal (supervised learning), and (2) the classification of new samples from their measurements (classification or affectation rule).
Different validation methods can be proposed to measure the generalization performances of the classifier. To avoid overfitting and poor generalization performances, cross-validation procedure must be used, with a clear independence between the learning set and the test set. In this study, we used
the Leave-One-Out Cross validation (LOOCV). The model is trained on all the samples except one; then the model predicts the class of the withdrawn sample; this operation is made N times for each sample. The quality of the classifier was assessed by a standard evaluation indicator, the Correct Classification Rate in LOOCV (CCR) (equation 1).
éq. (1) : 𝐶𝐶𝑅 =# !" !"#$%&! !"#$%&'#$ !" !!! !"##$!% !"#$$
!"!#$ !"#$%& !" !"#$%&!
It represents the rate of samples assigned to the correct class by the classifier.
Three different classification methods were tested during the project: Support Vector Machine (SVM), Discriminant Analysis (DA), Partial Least Square Discriminant Analysis (PLSDA) [7]. Preliminary results showed that the PLSDA method was the most efficient according to the CCR indicator.
PLSDA is an extension of PLS regression to the case of a qualitative dependent variable [8]. The model is similar to a PLS regression, where the qualitative dependent variable is simply recoded with binary dummy variables Yk. This method is particularly interesting when the independent variables Xj are numerous and correlated [9], which is the case in our application. The PLSDA method is based on the algorithm PLS2. The principle is to explain a set of dependent variables Yk by a set of p explanatory components. PLS regression is based on the iterative determination of these components, linear combinations of the initial variables Xj. The number of components to consider is a parameter of the method. It is generally set by a minimization of the prediction error in cross validation [10] (too much components creates overfitting, not enough components leads to a poor learning)
D. Classification models
The set of independent variables for the classification problems count 31 variables: the 30 power spectral density on the Mel frequency bands in the range 100-1500Hz plus the average level of the signal. The statistical individuals for this supervised learning are the measurements for each of the 30 repetitions (late fusion classification – an early fusion classification, based on the average of the independent variable across the repetition lead to similar performances). Different cases were considered from the dependent variables:
• Classification “age” with the variable “age” with 3 groups • Classification “age++” with the variable “age” with 2
extreme groups younger (20-30) vs older (+55)
• Classification “hydra” with the variable “hydration” with 2 groups
• Classification “firm” with the variable “firmness” with 2 groups
• Classification “hydra+firm” mixing firmness and hydration (hydrated + firm vs. dry+loose)
The performance of the different classifiers were analyzed in order to identify if the information contained in the physical spectra can discriminate skin differences.
16e Colloque National S-mart 3/5 Les Karellis (73) – 3 au 5 avril 2019 The PLSDA component were determined from satisfying
classifiers (see section III).
E. Sonification strategy for sensorial tests
To determine if the skin differences (visible on the spectra) are audible, the general approach consists in the sonification of the data given by the friction sensor [11]. In other words, the principle is to define a synthesized sound whose synthesis parameters are controlled by variables given by the sensor. The objective of this data sonification is to take advantage of the efficiency of our hearing sense to discriminate sounds, and to make audible skin differences by the way of sounds.
For the sound generation, we chose to synthesize a musical instrument which functioning is based on a friction interaction: the violin. This interaction is close to the finger/skin interaction and may constitute a relevant metaphor. Three synthesis parameters were considered:
• Pitch: location on a « low » - « high » scale. In practice, it is controlled by the fundamental frequency of the sound • Roughness [12]: psychoacoustical percept related to
amplitude fluctuations of the sound
• Inharmonicity: degree to which partials depart from whole multiple of the fundamental frequency
Since the detailed description of the sound synthesis is out of the scope of this paper, it is nevertheless interesting to mention that the synthesis is based on a source-filter model. A string signal is first synthesized (e.g. sawtooth signal when the sound is purely harmonic). To get a realistic synthesis, the string signal is next convolved with the impulse response of the body of a violin. The pitch, roughness, inharmonicity of the string signal is controlled by the PLSDA components of the classification models. After different tests, leading to relevant sounds, interpolations functions between the synthesis parameters and the PLSDA components were defined. To maximize difference between classes, sigmoid functions were considered (Figure 2).
Figure 2. EXAMPLE OF SIGMOID INTERPOLATION FUNCTION BETWEEN THE PLSDA COMPONANT AND THE SYNTHESIS PARAMETER
A musical note in permanent regime is synthesized (duration 2s – corresponding to the note A4 – 440Hz). Fade in and fade out, as well as a reverberation, are added to increase
the realism. Finally, this synthesis method allows the generation of a sound whose pitch, roughness and inharmonicity properties are directly controlled by the data of the friction sensor.
F. Product study – Hearing tests
The objective of this study is to assess, by hearing tests, the impact of the application of a cosmetic product on the quality of the skin thanks to previous analysis. A second panel of 41 women is considered (panel 2). For each subject, two measurements with the friction sensors (repeated 3 times) are made:
• Measurement before application of a product (date t0) • Measurement after 28 days of product application (date t28)
From these measurements, the average scores (across repetitions) according to the PLSDA components (obtained with the classification models) were computed. With the interpolation functions, the synthesis parameters (pitch, roughness, inharmonicity) were calculated and a sound is generated. Finally, for each subject, two sounds were generated: sound A (date t0) before application of the product, and sound B (date t28) after 28 days of product application.
A hearing test was then performed by a panel of five experts in order to:
• assess if differences between sound A (date t0) and sound B (date t28) are audible and significant,
• In case of significant differences, to verify that the application of the cosmetic product entails a change of the sound similar to a diminution of age (model “age++”), or to an increase of hydration and firmness (model “hydra+firm”).
A pairwise comparison test was designed (see interface Figure 3). Five experts, trained beforehand to the perception of the descriptors “pitch”, “inharmonicity”, and “roughness”, were involved.
Figure 3. INTERFACE FOR THE HEARING PAIRWISE COMPARISON TEST For each pair of sounds, and each expert, an interval scale was used to compute the scores differences according to each descriptor. The average scores differences (across experts and sounds) for each category (sound A, sound B) were next computed and compared with unilateral paired t-test.
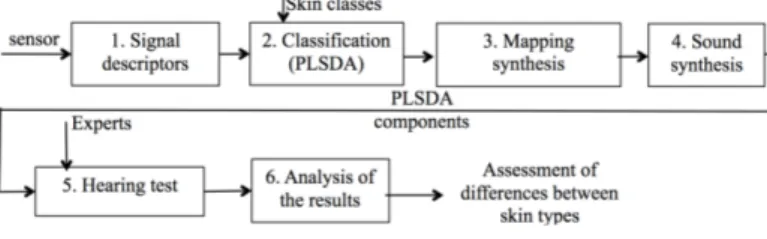
G. Overview of the methodology
A summary of the different phases of the methodology for the product study is given in Figure 4.
16e Colloque National S-mart 4/5 Les Karellis (73) – 3 au 5 avril 2019
Figure 4. DESCRIPTION OF THE DIFFERENT PHASES OF THE PRODUCT STUDY FOR THE ASSESSMENT OF DIFFERENCES BETWEEN SKINS Each subject is represented by 3 repetitions of 10 slidings of the friction sensor. From these measurements, the signal descriptors are computed (stage 1), and the average PLSDA scores are computed (stage 2). The interpolation functions allow the calculation of the synthesis parameters (stage 3) and the sound synthesis (stage 4). The comparison between the sounds before application of the cosmetic product (date t0) and after 15 days of product application (date t15) is done by a hearing test (stage 5) analyzed in stage 6.
III. RESULTS AND DISCUSSION
A. Supervised learning
The supervised learning uses the PLSDA method. 31 dependent variables are considered for the classification (power spectral density on 30 Mel frequency bands in the range 100-1500Hz plus the average level of the signal). The statistical individuals are the measurements for each of the 3*10 repetitions (late fusion classification).
For the cases “age, “hydra”, “firm”, , the performances of the classifiers with these dependent variables were unfortunately low (CCR lower than 60% - few above a random classifier, which would obtain a 50% CCR for two groups). We failed to classify correctly the skins in the groups considered from the measurement made by the sensor. This was mainly due to the large intragroup variance, caused by non-controlled experimental conditions (variations in the gesture of the experimenter during the measurements). But this may also be due to large inter-individual differences of the skin parameters, or to similar surface properties of the skin for the 20-30yo or 35-50yo categories.
For the two classification problems “age++” and “hydra+firm”, the performances of the classifiers were satisfying and the PLSDA components were determined.
For the model “age++”, the confusion matrix of the classification in LOOCV is given in table 1.
20-30 yo >55 yo Total % correct
20-30 yo 513 268 781 65.69%
>55 yo 117 362 479 75.57%
630 630 1260 CCR=69.44% Table 1. CONFUSION MATRIX FOR THE 2 CLASSES MODEL “AGE++”
The CCR of this model is 69.44%. The generalization ability of this model is a bit weak, but far above a random classifier that would obtain 50%. One PLSDA component is necessary for this model. The examination of the factor loading of the variables in the PLSDA component shows that high scores in the power spectral density (PSD) in the low frequency
range is characteristics of the “young” class, whereas high scores in the high range PSD is characteristics of the “old” class. This result is in agreement with other studies using friction sensors [1].
For the synthesis of sounds, given that there is only one PLSDA component with this model, it was decided that this component controls the roughness of the sound. The pitch and inharmonicity was kept constant.
The confusion matrix for the model “hydra+firm” is given in Table 2.
Hydr+firm Dry+loose Total % correct
Hydr+firm 310 80 390 79.49%
Dry+loose 71 289 360 80.28%
381 369 750 CCR=79.87% Table 2. CONFUSION MATRIX FOR THE 2 CLASSES MODEL
“HYDRA+FIRM”
The CCR of this model is 79.87%, which can be considered as a correct generalization ability. Three PLSDA components are defined for this classification. From the signals of the sensor, it is easier to define properties of the skin (hydration and firmness) than to predict age. This result is consistent, because of course the quality of the skin depends on age, but important differences exist between peoples on the evolution of skin qualities according to age.
For the synthesis of sounds, it was decided that PLSDA component 1 controls the pitch, PLSDA component 2 controls the roughness, and PLSDA component 3 controls the inharmonicity.
B. Product study
For the model based on “age++”, Figure 5 presents the average experts’ score of the difference between the perceived roughness before application and after application of the cosmetic product.
Figure 5. AVERAGE DIFFERENCE BETWEEN THE SCORE BEFORE APPLICATION OF THE PRODUCT (DATE t0) AND AFTER 28 DAYS OF PRODUCT
APPLICATION (DATE t28)
The average roughness (1.15) is significantly higher before application than after 28 days of application (paired unilateral t-test). It signifies that the violin sounds are in average perceived as less rough after the application of the product. This result confirms the ability of the sound synthesis to make
t0-t15 -1 0 1 2 3 4 5
average roughness-score difference (t0-t15)
Model "age" hearing test
average score > 0 (p<0.01 - unilateral t-test)
16e Colloque National S-mart 5/5 Les Karellis (73) – 3 au 5 avril 2019 audible skin properties differences. Additionally, it indicates
that the application of the cosmetic product on the skin produces an effect on the friction measurement that is in agreement with a diminution of age. Additional studies are of course necessary to prove that the product has an “anti-age” effect.
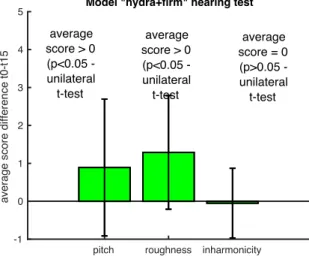
For the model based on « hydra + firm », the application of the product leads to significant differences according to 2 perceptual dimensions: pitch and roughness (Figures 6).
Figure 6. AVERAGE DIFFERENCE BETWEEN THE SCORE AFTER 28 DAYS OF PRODUCT APPLICATION (DATE t28) AND THE SCORE BEFORE APPLICATION OF
THE PRODUCT (DATE t0)
Again, this result confirms the ability of the sound synthesis to make audible skin properties differences, except for inharmonicity.
IV. CONCLUSIONS
In this paper, we showed that the sonification of the signal of a friction sensor highlights perceptual differences between skin qualities. Significant effect of the application of a cosmetic product on the perception of the sounds are noticed, changes that are in agreement with an increase of the hydration and firmness, and a decrease of age. Only “extreme” differences between skin properties have been highlighted (2 classes cases). Improvements are necessary to show more subtle differences. Another interesting contribution of this study is to make connections between different sensory modalities: touch and hearing. In particular, the synthesis of musical instruments is an interesting approach for marketers to promote cosmetic product with a qualitative musical universe.
Acknowledgments
The authors would like to thank the subjects and the experts for their participation in the sensory and auditory tests, H. Zahouani and R. Vargiolu (LTDS, Lyon, France) for their expertise on friction sensors and Mathieu Lagrange (LS2N, Nantes, France) for his advices on machine learning.
V. REFERENCES
[1] Zahouani, H., Mezghani, S., Vargiolu, R., Hoc, T., El Mansori, M. Effect of roughness on vibration of human finger during a friction test, (2013). Wear of Materials, Vol. 301(1-2), April 2013, 343-352.
[2] C. Laboutière, E. Segot-Chicq, G. Moneuze, A. Laurent-Lesaffre, G. Boyer, S. Laquieze, M. Pericoi, M-H. Gaudinat. Clinical evaluation of the efficacy of a men face care on hair beard softness using a tribo-measurement. 22nd EADV Congress, Istanbul, Turkey, 2013.
[3] Zahouani H., Vargiolu R., Boyer G., Pailler-Mattei C., Laquièze L., Mavon A. « Friction noise of human skin in vivo ». Wear 267 (2009) 1274-1280.
[4] Jean-François Petiot, Ludovic Fouéré, Armelle Bigouret, Sonia Gagnaire Alex Nkengne, Hassan Zahouani, Roberto Vargiolu. Sonification of a friction sensor for an acoustic characterization of the human skin. 173rd Meeting of the Acoustical Society of America and the 8th Forum Acusticum (Acoustics'17), June 2017, Boston, MA, USA.
[5] Jean-François Petiot, Ludovic Fouéré, Armelle Bigouret, Sonia Gagnaire, Alex Nkengne, Katell Vié, Hassan Zahouani, Roberto Vargiolu. Sound properties of the skin are linked to hydration, firmness and age. Conference IEEE COMET 2017 – Cosmetic Measurement and Testing, Juin 2017, Cergy-Pontoise. [6] Ronald L. Allen, Duncan W. Mills. Signal Analysis:
Time, Frequency, Scale and Structure. IEEE Press, Wiley-Interscience, 2004, USA.
[7] Tahir Mehmood & Bilal Ahmed. The diversity in the applications of partial least squares : an overview.
Journal of Chemiometrics 30, Issue 1, January 2016, 4-7.
[8] M. Tenenhaus, "L'approche PLS," Revue de statistique appliquée, vol. 47, no. 2, pp. 5-40, 1999.
[9] Chevallier S., Bertrand D., Kohler A., Courcoux P. Application of PLS-DA in multivariate image analysis. Journal of Chemometrics 2006; 20: 221-229.
[10] Filzmoser P., Liebmann B. and Varmuza K. Repeated double cross validation. J. Chemometrics 2009; 23: 160– 171.
[11] Hermann, T., Hunt, A., Neuhoff, J. G., editors (2011). The Sonification Handbook. Logos Publishing House, Berlin, Germany.
[12] Daniel Pressnitzer. Perception de rugosité psychoacoustique : d’un attribut élémentaire de l’audition à l’écoute musicale. Thèse de doctorat, Université Paris VI, IRCAM, 1998.
pitch roughness inharmonicity -1 0 1 2 3 4 5
average score difference t0-t15
Model "hydra+firm" hearing test
average score > 0 (p<0.05 -unilateral t-test average score > 0 (p<0.05 -unilateral t-test average score = 0 (p>0.05 -unilateral t-test


![La maladie des taches brunes du niébé [vigna unguiculata (l) walp.] au Burkina Faso: connaissance des agents pathogènes impliques et développement de méthodes de lutte](data:image/gif;base64,R0lGODlhAQABAIAAAP///wAAACH5BAEAAAAALAAAAAABAAEAAAICRAEAOw==)