HAL Id: hal-02153205
https://hal-ensta-bretagne.archives-ouvertes.fr/hal-02153205
Submitted on 12 Jun 2019
HAL is a multi-disciplinary open access archive for the deposit and dissemination of sci-entific research documents, whether they are pub-lished or not. The documents may come from teaching and research institutions in France or abroad, or from public or private research centers.
L’archive ouverte pluridisciplinaire HAL, est destinée au dépôt et à la diffusion de documents scientifiques de niveau recherche, publiés ou non, émanant des établissements d’enseignement et de recherche français ou étrangers, des laboratoires publics ou privés.
estimation in repeated MBES surveys
Nathalie Debese, Jean-José Jacq, Koen Degrendele, Marc Roche
To cite this version:
Nathalie Debese, Jean-José Jacq, Koen Degrendele, Marc Roche. Osculatory surfaces applied to systematic errors estimation in repeated MBES surveys. MARID VI 2019 : Marine and River Dune Dynamics, Apr 2019, Bremen, Germany. �hal-02153205�
1. INTRODUCTION
The Continental Shelf Service of the FPS Economy, SMEs, self-employed and Energy (Belgium) is in charge of the management and control of the sand extraction within the Belgian part of the North Sea. To this end, monitoring areas defined where the extrac-tion is concentrated are regularly surveyed with a multibeam echosounder (MBES - RV Belgica EM3002D 300kHz) to evaluate the impact of dredging on the seabed bathyme-try, morphology and habitat on a local scale. In each monitoring area, variations in sedi-ment volumes as a function of time are de-rived from the bathymetric time series com-posed of the Digital Bathymetric Models (DBM) derived from MBES surveys.
The dredging activity itself is controlled by an Electronic Monitoring System (EMS - informally called “black-boxes”) installed aboard each dredging vessel. The EMS rec-ords both the vessel position and pump ac-tivity at a frequency rate of one record per 30s, allowing an estimation of the extracted volume over any monitoring area for any
time interval assuming that dredging vessels are always using their maximum capacity (Roche et al., 2017 and Van den Branden et al., 2017).
The correlation between MBES and EMS data has been analyzed with different ap-proaches and at different spatial resolution (Roche et al., 2011 and 2017 and Terseleer et al., 2016). At the local spatial scale of the monitoring areas the volume variation measured by MBES is strongly correlated with the volume variation estimated from the EMS data, implying that most of the bathymetric variation is explained by the extraction itself. With respect to this high average correlation, the residuals are of the same decimetric order of magnitude as the uncertainty associated with the RV Belgica EM3002D bathymetric measurements which meet IHO S44 Special Order (IHO, 2008). On the other side, the strong concordance between the volumes derived from the EMS data and the volumes officially declared by the dredging companies suggest, on a first approach, that a negligible bias can be con-sidered for the volume estimation derived from the EMS data.
Osculatory surfaces applied to systematic errors estimation in
repeated MBES surveys
N. Debese
ENSTA Bretagne, Brest, France – [email protected]J. J. Jacq
Mines-Telecom Institute / IMT-Atlantique, Brest, France – [email protected]K. Degrendele
Federal Public Service Economy, SMEs, Self-employed and Energy – Continental Shelf Service, Brussel, Belgium – [email protected]M. Roche
Federal Public Service Economy, SMEs, Self-employed and Energy – Continental Shelf Service, Brussel, Belgium – [email protected]ABSTRACT: In the Belgium part of the North Sea, regular multibeam echosounder (MBES) surveys are carried out on reference areas to control the environmental impact of the sand extraction. The volume of sand extracted can be estimated from Electronic Monitoring System (EMS) installed aboard the dredging vessels. The correction of potential systematic errors affecting the MBES bathymetric measurements is a prerequisite for precisely analyzing the correlation between EMS and MBES volume. This paper presents a new ap-proach, based on osculatory surfaces, to estimate and correct the bathymetric data from these potential biases. Osculatory surfaces are smooth virtual surfaces giving access to the envelop surface of the sandbank. Sys-tematic errors are estimated by taken into account the morphological impact of the suction hopper dredgers and assuming a bathy-morphology stability of the sandbank on a decadal scale. Once applied to MBES bath-ymetric data, the volumes of sand extracted estimated from EMS data are in very high accordance with those deduced from MBES survey.
To clarify the respective importance of the extraction and the sediment-dune dy-namics in the overall volume variation esti-mated from the bathymetric time-series, it is necessary to correct as much as possible the systematic errors affecting the MBES bath-ymetric measurements. Through a case study, this contribution proposes an original approach to correct these systematic errors which are independent from one survey to another.
Section 2 describes the dataset used. Sec-tion 3 presents a number of preliminary con-siderations. Section 4 gives an operational description of osculatory surfaces applied to systematic errors estimation.
2. DATASET DESCRIPTION
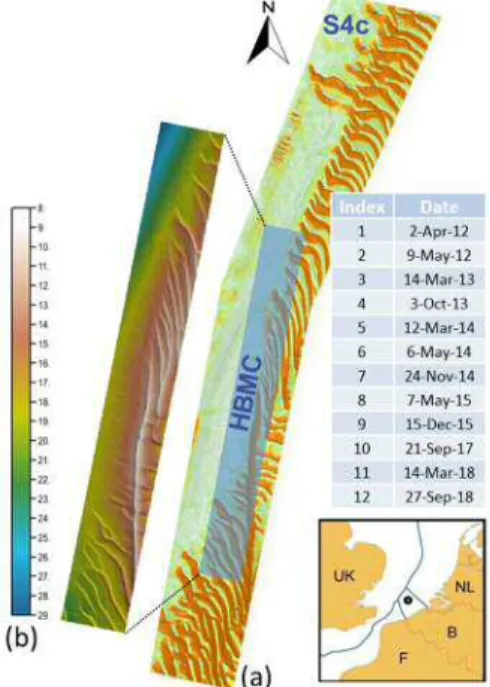
The Oosthinder bank is localized in the north of the Belgian part of the North Sea and is part of a group of elongated parallel sandbanks known as the Hinderbanken. Our study area, the monitoring area HBMC is located on the Oosthinder bank, within the extraction area 4c from which is extracted each spring since 2012, a large volume of sand for the beach maintenance.
Figure 1. (a) Location of HBMC monitoring area and RV Belgica EM3002D MBES survey dates; (b) DBM#1
The evolution of the bathymetry based on the MBES survey data, is due to: (1) short periods of intense extraction, visible by large trailing suction hopper dredgers marks along and across the sandbank; (2) natural sediment transport processes, resulting in changes in shape and migration of very large dunes (sensu Ashley 1990) superimposed on the bank.
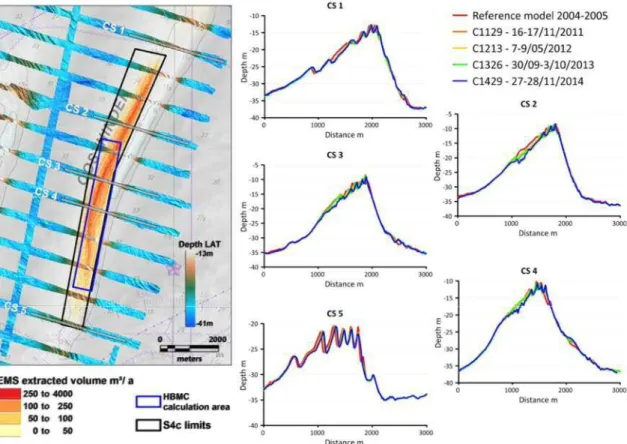
3. 3. PRELIMINARY CONSIDERATIONS A complex mechanism of maintenance of the tidal sandbanks related to the hydrody-namic and sediment transport regimes is mentioned by many authors (De Moor, 1984, Berné et al., 1998, Dyer & Huntley, 1999). The displacement of linear offshore banks is extremely variable from one bank group to another (see Kenyon and Cooper, 2005) and some tidal banks show stability phases alternating with dynamic phases (Van Cauwenberghe, 1971). The bathymet-ric profiles along perpendicular lines (old “DECCA” lines) to the Oosthinder using the available surveys from 2004 to 2014 allow an estimation of the overall sandbank varia-tion in vertical and horizontal direcvaria-tion on a decadal scale. The bathymetric profiles are displayed in Figure 2. Locally, the profiles on the north and south flanks of the sand-bank in areas without large dune pattern and where extraction is negligible show varia-tions of about ten meters in the horizontal direction. In the vertical plan, fluctuations of about twenty centimeters are observed, the latter being in the order of magnitude of the uncertainty associated with the MBES bath-ymetric measurements. But no significant trend is present: these variations, both in the vertical plane and in the horizontal plane, do not follow any drift as a function of time. From 2004 to 2014, in the investigated area, the Oosthinder bank is stable: oscillating randomly around a mean position.
The volume changes induced by natural net influx will then be considered as being negligible compared to those induced by anthropogenic activities. In this context,
estimating the volume variation on HBMC only requires the change in overall mean depth of the area, or equivalently, the thick-ness variation computed over the HBMC area.
In HBMC monitoring area, EMS data show that the volume of sand extracted be-tween two successive MBES surveys brought to the surface of the area can amount to 20 cm. Accordingly, MBES soundings depth uncertainty should be at least one order of magnitude less to achieve the initial objective. Hence a technique to eliminate the systematic errors that contrib-ute to this uncertainty is required. To obtain this, robust techniques are proposed to ad-just the global depths of the DBM, using the first survey as a reference. In this manner, at the spatial scale of the HBMC area, system-atic errors affecting MBES data will be a posteriori compensated.
The dune migration and the sand extrac-tion greatly complicate the registraextrac-tion of DBM’s since they reduce the redundant in-formation between DBM’s. The technique we propose aims to restore the missing in-formation by using an intermediate surface, referred as bottom-osculatory surface. Such a surface allows to virtually remove the dunes superimposed on the sandbank.
The osculatory surface that surrounds the sandbank tangentially at the base – toe of the dunes represents a hypothetic boundary be-tween a dynamic upper part shaped by the mobile dunes and a stable internal part. Giv-en the stability of the Oosthinder Bank in the HBMC area, this concept of an osculatory surface separating vertically the bank in a dynamic part, where the sand is mobile, of a stable part takes here all its meaning.
Figure 2. Bathymetric profiles on S4c Extraction Sector across the Oosthinder bank (crossection: average value calculated on a corridor of 25 m on both sides of the central position of the profile).
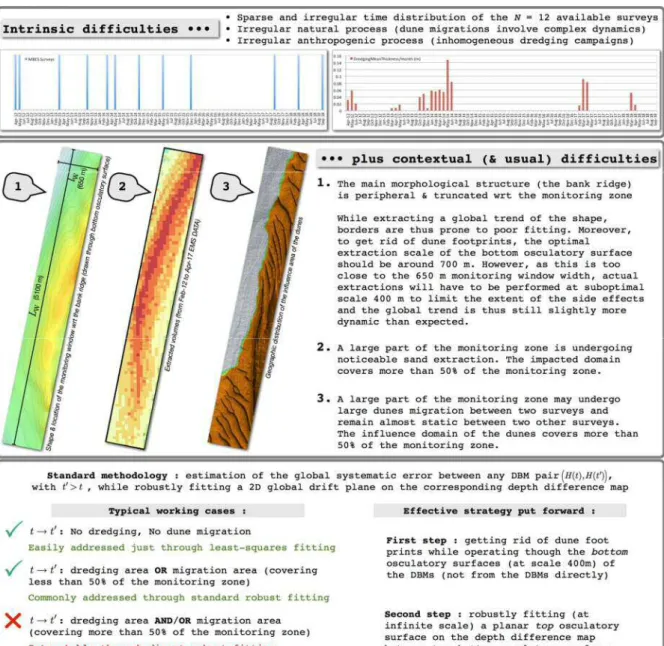
Figure 3. Actual challenges w.r.t. robust estimation of MBES systematic errors and corresponding strategy
4. OSCULATORY SURFACES
Osculatory surfaces are robust trend surfaces derived from DBM. The methodology aim-ing at derivaim-ing osculatory surfaces from DBM is fully described in Debese et al. (2018b). This shape transform operates through only two non-optional parameters: its scale length λ and the corresponding degree of the local representations.
Extracting HBMC osculatory surface is a challenging task. As displayed in Figure 1, HBMC area is a narrow strip of seabed, which only partially covers the sandbank.
This makes it difficult to define the entire shape of the bank and avoid edge effects. Very large dunes located in HBMC area are highly dynamic. The volume of sand in-volved in the dynamics is estimated to 1.8 million of meter cube. The very large dunes migrate at a speed of 30 m per year in the South west of more than 1 m locally from April 2012 to September 2018.
Besides the better understanding of sand bedform dynamics this technique provides, the osculatory surfaces are useful for the detection and quantification of systematic errors in bathymetric time series.
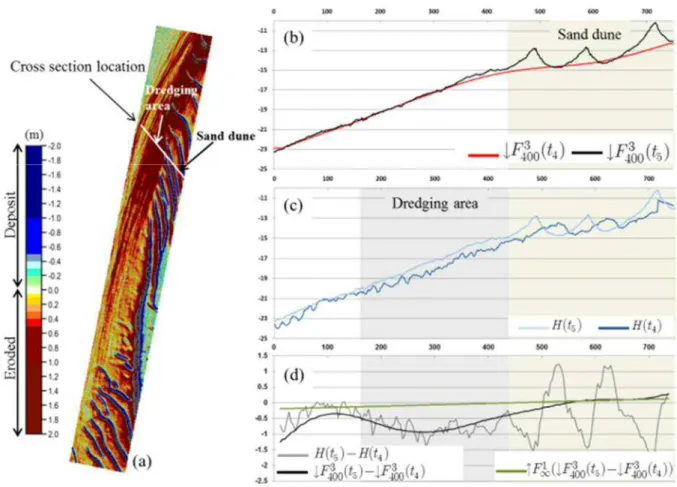
Figure 4. (a) DTM of differences (DoD) between DBM#5 and DBM#4 and location of the cross section; (b)
Bathymetric and osculatory resulting profiles for the survey#4; (c) DBM#4 and DBM#5 cross sections; (d) Cross sections in DoD between DBM#5 and DBM#4 and in DoD between their corresponding osculatory surfaces.
Figure 3 attempts to intuitively highlight both the actual data limitations and the methodological choices made to work around them while aiming at robustly track-ing the volume variation of the remaintrack-ing sand resource over time. The corresponding key operational step addresses the extraction of the set of bottom osculatory surfaces built from the DBMs (4x4 m) issued from the 12
MBES surveys currently
available. As they get rid of the dune struc-tures, the former are expected to deliver a reasonably stable shape with respect to the non-anthropogenic processes insofar as their common extraction scale is carefully chosen (Debese et al., 2018b). This study makes use of the bottom osculatory model
– that is, operating through an extraction scale set to 400 m and with local 2D models of degree 3 (Figure 4b). The key hypothesis made in this work expects that the distribu-tion of the remaining differences between a pair of bottom osculatory surfaces
, should then mostly result from potential systematic errors and/or pos-sible dredging campaigns. The global sys-tematic error component is extracted through a top osculatory planar global model fitted on the bottom osculatory difference map (Figure 4d). This robust trend extractor is expected to be im-mune against outliers patches resulting from dredging erosion since these patches are always concavities within the difference map. A scalar indicator of the appar-ent volume change from to (or its equivalent thickness upon divided by the area of the monitoring zone) due to system-atic errors is then just built as the mean
val-ue of the map .
Using this generic approach, preliminary results were already published in (Debese et al., 2018a). However, since the volume cor-rections were computed from the first-order indicators only, these results were still prone to large estimation drifts
along time. Indeed, although the bias opera-tor is expected to be robust w.r.t. the comparison of two successive surveys, its
linear concatenation
over the time se-quence does not provide the global robust-ness required to address the whole sequence of surveys, as displayed in Figure 5a by the dotted curve.
To this end, this paper proposes to explic-itly pre-compute the whole set of indicators
, with , i.e., getting
independent estimations. An estimation is then got as the weighted average of its possible cumulative evaluations, each summation result depending on the directed graph path (without loops) currently chosen between and – the shortest and longest corresponding graph lengths be-tween and being and , respec-tively. The weight of an estimation is taken as the inverse of its corresponding graph path length.
HBMC osculatory surfaces were extract-ed using a polynomial degree of three by setting to 400 m. As displayed in Figure 4a, this pair of parameters fully assimilates the ridge of the bank.
The temporal evolution of the volume changes estimated from MBES and EMS data are displayed on Figure 5. The black curve represents the volume changes esti-mated from EMS data while the red one represents the volume changes deduced from the bathymetric models issued from MBES surveys. The green curve represents the volume changes deduced from MBES bathymetric data after removal of the residu-al bias estimated through this globresidu-al ap-proach.
Figure 5. (a) The temporal evolution of the MBES-based volume changes measurements w.r.t. their predictions issued from the EMS system data-base – the time origin is the date of the first survey; (b) Linear regression applied to the differences of the depth changes between EMS each of the MBES datasets (raw and corrected).
5. CONCLUSIONS
A method is proposed to correct residual bias associated with bathymetric models derived from MBES data. The correction process makes use of a top osculatory planar model fitted on a bottom osculatory differ-ence map. A robust estimation of these bias-es is achieved through a global approach.
This method applied to the HBMC moni-toring area located on the Oosthinder bank where sand is extracted since 2012, signifi-cantly improves the estimation of the vol-ume variation w.r.t. time.
The correlation between the volumes measured by MBES and corrected with the volumes estimated from EMS data is very significant (Pearson's r² = 0.99). In the HBMC zone, sand extraction explains 99% of the variation of bathymetry during the period considered.
This contribution, which is rather hydro-graphic in nature, uses advanced morpho-metric techniques to correct the intrinsic errors associated with MBES bathymetric data. It is a first step in a long-term project whose ultimate objective is to accurately and reliably quantify in routine the sand volumes involved in the sandbanks dynamics and to make a link between the sand volume
in-volved in the dune dynamics and the hydro-dynamic regime. This method will be ap-plied soon to all MBES data acquired as part of the monitoring of sand extraction in the Belgian part of the North Sea.
7 REFERENCES
Ashley, G.M. 1990. Classification of large-scale subaqueous bedforms: a new look at an old prob-lem. Journal of Sedimentary Petrology, 60, 1: 160-172.
Berné, S., Lericolais, G., Marsset, T., Bourillet, J.-F. and De Batist, M., 1998. Erosional offshore sand ridges and lowstand shorefaces: Examples from tide- and wave-dominated environments of France. Journal o f Sedimentary Research, 68(4): 540-555
Debese, N., Jacq, J.J., Degrendele, K., Roche, M., 2018a. “Toward Reliable Volumetric Monitoring of Sandbanks”, In Proc. of the 5th International
Conference of the Int. Society for Geomorphome-try, Aug. 13-17, 2018, Boulder, USA.
Debese, N., Jacq, J.J., Degrendele, K., Roche, M., Garlan, T., 2018b. “Osculatory Surfaces Extrac-tion applied to Monitoring of Submarine Sand Materials”, Marine Geodesy, doi:10.1080/01490419.2018.1509161.
De Moor, G., 1984. Morfodynamiek an sedimentdy-namiek rond the Kwintebank. Brussel, Ministerie Economische Zaken, Vol. I, II, III, IV, V ; 219, 71, 65, 39, 36 p.
International Hydrographic Organization, 2008. Spe-cial Publication No. S-44, “IHO Standards for Hydrographic Surveys”, 5th Ed., Monaco.
Kenyon, N.H. and Cooper, B., 2005. Sand banks, sand transport and offshore wind farms. Technical Report. ABP Marine Environmental Research Ltd (ABPmer). pp 106.
Roche, M., Degrendele, K., De Mol, L., Schotte, P., Vandenreyken, H., Van Den Branden, R. and De Schepper, G., 2011. Synthesis of the monitoring of the impact from the aggregate extraction on the Belgian Continental Shelf. Brussels: Marine ag-gregate extraction: needs, guidelines and future prospects. Belgian FPS Economy – Study day 5 October 2017 : 5-37
Roche M, Degrendele K, Vandenreyken H, Schotte, P, 2017. Multi time and space scale monitoring of the sand extraction and its impact on the seabed by coupling EMS data and MBES measurements. Belgian marine sand: a scarce resource? Belgian FPS Economy – Study day 7 June 2017: 5-37
http://economie.fgov.be/fr/binaries/Articles-study-day-2017_tcm326-283850.pdf
Terseleer, N., Roche, M., Degrendele, K., Van den Eynde, D., Van Lancker, V.R.M., 2016. ICES Annual Science Conference, Theme session K: Make marine sediment extraction sustainable by mitigation of related processes, CM 2016/K:617. Van Cauwenberghe, C., 1971. Hydrografische
ana-lyse van de Vlaamse banken langs de Belgisch-Franse kust. Ingenieurstijdingen, 4, 141-149. Van den Branden, R., G. DeSchepper, and L. Naudts
(this volume). The Electronic Monitoring System (EMS) as a minimum requirement for monitoring the extraction of an increasingly scarce raw mate-rial. Belgian marine sand: a scarce resource? Bel-gian FPS Economy – Study day 9 June 2017 : 39-45 http://economie.fgov.be/fr/binaries/Articles-study-day-2017_tcm326-283850.pdf