HAL Id: hal-02265122
https://hal.inria.fr/hal-02265122
Submitted on 8 Aug 2019
HAL is a multi-disciplinary open access
archive for the deposit and dissemination of
sci-entific research documents, whether they are
pub-lished or not. The documents may come from
teaching and research institutions in France or
abroad, or from public or private research centers.
L’archive ouverte pluridisciplinaire HAL, est
destinée au dépôt et à la diffusion de documents
scientifiques de niveau recherche, publiés ou non,
émanant des établissements d’enseignement et de
recherche français ou étrangers, des laboratoires
publics ou privés.
Quality metric aggregation for HDR/WCG images
Maxime Rousselot, Xavier Ducloux, Olivier Le Meur, Rémi Cozot
To cite this version:
Maxime Rousselot, Xavier Ducloux, Olivier Le Meur, Rémi Cozot. Quality metric aggregation for
HDR/WCG images. International Conference on Image Processing (ICIP), Sep 2019, Taipei, Taiwan.
�hal-02265122�
QUALITY METRIC AGGREGATION FOR HDR/WCG IMAGES
Maxime Rousselot, Xavier Ducloux
Harmonic Inc., France
Olivier Le Meur, R´emi Cozot
Univ. Rennes, CNRS, IRISA, France
ABSTRACT
High Dynamic Range (HDR) and Wide Color Gamut (WCG) screens are able to display images with brighter and darker pixels with more vivid colors than ever. Automatically assessing the qual-ity of these HDR/WCG images is of critical importance to evaluate the performances of image compression schemes. In recent years, full-reference metrics, such as HDR-VDP-2, PU-encoding metrics, have been designed for this purpose. However, none of these met-rics consider chromatic artifacts. In this paper, we propose our own full-reference quality metric adapted to HDR and WCG content that is sensitive to chromatic distortions. The proposed metric is based on two existing HDR quality metrics and color image features. A support vector machine regression is used to combine the aforemen-tioned features. Experimental results demonstrate the effectiveness of the proposed metric in the context of image compression.
Index Terms— Image quality, High Dynamic Range, Machine learning, Image processing
1. INTRODUCTION
High Dynamic Range (HDR) and Wide Color Gamut (WCG) tech-nologies allow displaying always brighter and darker pixel with more vivid color. An HDR image can represent a range of lumi-nance closer to the perceptible range by the Human Visual System (HVS) while WCG images are able to represent more colors than ever. Current HDR screens can display a luminance that can go below 0.01 cd/m2and/or up to 10,000 cd/m2. Presently, no monitors
are able to faithfully represent WCG normalized by the BT.2020 [1]. However, highly promising solutions are developed towards this direction. HDR/WCG contents require new methods for assess-ing their quality. Image Quality Assessment (IQA) is a key tool to evaluate the performances of diverse image/video processing such as compression. Subjective evaluations are reliably assessing Quality. However they are often very time-consuming and not prac-tical in many applications such as the quality monitoring for live video applications. Objective metrics are often more convenient and quite accurate to perform IQA. However, the IQA metrics used for Standard Dynamic Range (SDR) images using the legacy gamut BT.709 [2] are not able to process the refined information brought by the new representations.
In recent years, full-reference objective quality metrics adapted to HDR video content have been proposed to tackle this problem. Two main strategies can be found in the literature. The first is to design dedicated metrics for HDR contents by modeling the HVS like HDR-VDP-2 [3, 4] or HDR-VQM [5]. The second strategy is to adapt the SDR quality metrics, such as PSNR, SSIM [6], MS-SSIM [7], VIF [8] and FSIM [9], to HDR context. All these metrics assume that pixels values are perceptually linear (or perceptually uniform). This is why Aydn et al. [10] designed the Perceptu-ally Uniform (PU) function to remap the luminance of HDR images.
This function has the same behavior than the classic gamma function for luminance corresponding to the SDR luminance range (below 80cd/m2) and keeps perceptual linearity above this range. However, all above-mentioned metrics have still one limitation: they do not consider chromatic distortions. In a previous work [11], we adapted SDR metrics, including color metrics, using a remapped version of perceptually uniform color space created specifically for HDR and WCG. We concluded that existing quality metrics still perform poorly for assessing the HDR chromatic distortions while perform-ing quite well on luminance dimension.
In this paper, we propose an HDR quality metric able to assess luminance and chromatic distortions caused by image compression. To obtain such a metric, we combine two full-reference quality met-rics and two color image features using a Support Vector Regressor (SVR). Combining several features and quality metrics for improv-ing the overall prediction performance was already proposed for SDR images and video. We can mention CQM [12], CF-MMF and CD-MMF [13], FVQA [14], EVQA [15] and the metric developed by Netflix, VMAF [16]. Recently, Choudhury et al. [17] proposed HDR-CQM, a combination of full-reference metrics adapted to HDR contents. The main idea is to combine, using support vector machine regression, the scores of a subset of metrics selected from a list of quality metrics. Although performing well, the proposed metric does not tackle the issue of WCG chromatic distortions. The paper is organized as follows. In Section 2, we elaborate on the proposed metric and the features being used. Section 3 describes the training methodology. In Section 4, we evaluate the performance of our metric. Section 5 is the conclusion.
2. PROPOSED METHOD
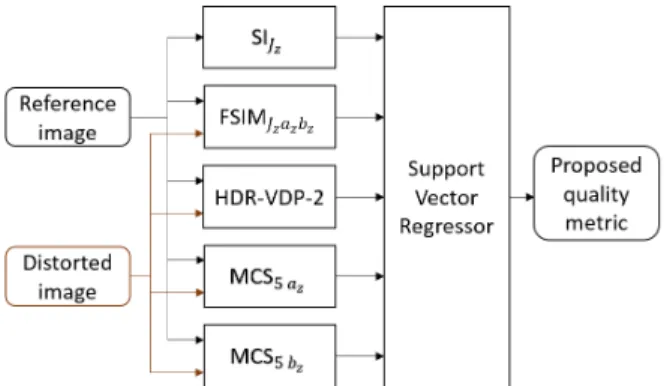
The proposed metric relies on the mixture parameters of several quality metrics and image features; the combination is learned by using supervised machine learning. The main idea is to take advan-tage of each metric / feature strengths while compensating individual weakness. A Support Vector Regression machine with a Gaussian radial basis function kernel is used to map the features to a qual-ity score. Figure 1 presents the overall architecture of the proposed method. The metric binary is available at www-percept.irisa. fr/software/.
2.1. Considered HDR quality metrics
Two HDR metrics were selected for their good performances on sev-eral databases [11]: HDR-VDP-2 and FSIMJzazbz.
• HDR-VDP-2 [3] (version 2.2.1 [4]): HDR-VDP-2 require nu-merous parameters such as the angular resolution, the surround luminance and the spectral emission of the screen. To ensure that HDR-VDP-2 score is coherent, we use the same angular resolu-tion (60 pix/deg, the angular resoluresolu-tion of three of the databases),
Fig. 1: Architecture of the proposed full-reference HDR quality met-ric.
for each studied database (cf. Section 3.1). We have shown in a previous work [18] that HDR-VDP-2 quality score shift when the angular resolution change but not in an expected way: HDR-VDP-2 score increases when the angular resolution decreases (or when the observer is closer to the screen).
• FSIMJzazbz: FSIM [9] is a full-reference metric adapted to SDR
images. To adapt it to HDR images we use a remapped version of the Jzazbz [19] color space as defined in [11]. FSIM is a
color-blind metric and only considers luminance distortions. The two metrics considered above are only considering lumi-nance distortions. To consider the chromatic dimension, we add two chromatic-based features.
2.2. Chromatic-based visual features
As we aim to extend the quality metric to color images, we add two features able to measure chromatic distortion. These features are inspired by the MS-SSIM features [7], the multi-scale version of the SSIM index [6]. SSIM conducts a comparison on three levels: luminance, contrast and structure. Each factor is estimated pixel-wise through a sliding window in order to achieve a distortion map. To obtain a global quality score, a mean is applied on this map. In MS-SSIM, contrast and structure are compared on different scales of the images. Our color features are created using the contrast (c) and structure (s) comparison function on the color components of the images. Because the HVS is less sensitive to high frequency variation in color, we use the scale 5 of the images, i.e. the images after 5 downsampling with a ratio of 2. The feature, MCS5 az, is
calculated as following: MCS5(X, Y ) = 1 M N M X m=1 N X n=1 c(xmn, ymn) · s(xmn, ymn) (1)
where X and Y are the reference and distorted images, respectively. xmnand ymnrepresent pixel values and M and N the image sizes.
For both original and degraded images, we calculate this feature on the Jzazbz color component of the images: MCS5 az for the az
component, and MCS5 bzfor the bzcomponent.
In addition, we also add a last feature to characterize the image complexity. Indeed this characteristic affects our perception of the image distortion.
2.3. Image spatial information
The last feature allows us to characterize the complexity of the im-age. Image complexity affects the image quality perception as it is related to the HVS spatial masking effects. It is measured on the Jz component of the reference images. We selected Spatial Index
SI as recommended by the International Telecommunication Union (ITU) [20]. The spatial information SIJzcorresponds to the standard
deviation of the image luminance plane which has been filtered by a Sobel filter: SI = std[Sobel(X)], where X is the reference image. 2.4. Mapping the features to the quality scores
To summarize, we compute from the original and distorted images a vector of 5 parameters: 2 parameters deal with the luminance com-ponent, 2 concerns considers chroma dimensions and one is used to characterize the image complexity. The relationship between these features and the quality scores is learned thanks to the SVR machine (cf. Figure 1). More details are given in section 3.3.
3. TRAINING METHODOLOGY 3.1. Image quality databases
To train the proposed model, a large collection of annotated HDR images is required. Unfortunately, there is, to the best of our knowl-edge, only a small number of HDR image databases annotated with subjective quality scores. In addition those databases are composed of a rather small amount of images.
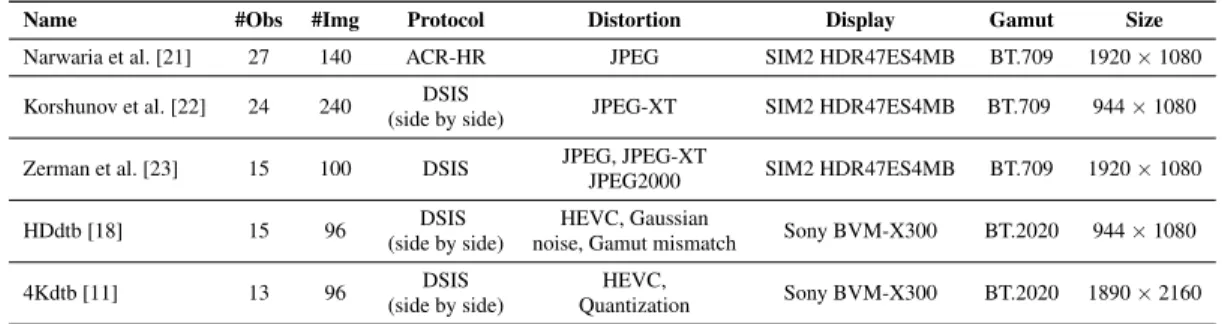
To obtain a suitable database for our experiment, we considered the five databases presented in Table 1: Narwaria et al. [21], Korshunov et al. [22], Zerman et al. [23], 4Kdtb [11] and HDdtb [18]. The first four databases were used for the training phase and HDdtb was considered as an independent test database used to validate our proposed metric.
Three of them, Narwaria et al., Korshunov et al. and Zerman et al. includes images rendered on the same display (the SIM2 HDR47ES4MB), which has a measured dynamic range going from 0.03 to 4250 cd/m2and is only able to display a BT709 gamut. The HDdtb and the 4Kdtb were created using the SONY BVM-X300 monitor which is able to handle the WCG BT2020 and has a peak brightness at 1000 cd/m2. The luminance of a black pixel was too
low to be measured by the equipment (<0.02 cd/m2). We assume a luminance for the black pixel at 0.001 cd/m2. All the databases focus on compression artifacts with the exception of the HDdtb which also evaluates two different distortions: Gamut mismatch and Gaussian noise.
Also, it must be emphasised that the 4Kdtb and HDdtb databases were designed to highlight metric sensitivity to chromatic distor-tions. Images of the 4Kdtb and the HDdtb database were compressed using three different methods:
• HEVC compression following the recommendation ITU-T H Suppl.15 [24]. This recommendation proposes different pro-cesses for increasing the quality of the compression like a chroma Qp adaptation. This adaptation is of special interest for this study because it corrects errors due to the compression of the chromi-nances.
• HEVC compression without the chroma Qp adaptation.
• HEVC compression with 8 bits quantization for the chrominances instead of 10 during the compression (4Kdtb only).
Table 1: Review of 5 HDR image quality databases in terms of number of observers, number of images, subjective test protocol, kind of distortion, used display, used gamut and image size.
Name #Obs #Img Protocol Distortion Display Gamut Size Narwaria et al. [21] 27 140 ACR-HR JPEG SIM2 HDR47ES4MB BT.709 1920 × 1080
Korshunov et al. [22] 24 240 DSIS JPEG-XT SIM2 HDR47ES4MB BT.709 944 × 1080 (side by side)
Zerman et al. [23] 15 100 DSIS JPEG, JPEG-XT SIM2 HDR47ES4MB BT.709 1920 × 1080 JPEG2000
HDdtb [18] 15 96 DSIS HEVC, Gaussian Sony BVM-X300 BT.2020 944 × 1080 (side by side) noise, Gamut mismatch
4Kdtb [11] 13 96 DSIS HEVC, Sony BVM-X300 BT.2020 1890 × 2160 (side by side) Quantization
As presented in Table 1, images of the 4Kdtb have a higher reso-lution than the other databases with an angular resoreso-lution around 120 pix/degree. To be as homogeneous as possible, we choose to downsample them to obtain a 60 pix/degree resolution before using the different quality metrics or train our model. Indeed, most quality metrics are not adapted to high resolution images.
Before the training, we limited the dynamic range of images accord-ingly to the used monitor available luminance during the conducted subjective test. We assume that the screen saturates if the image lu-minance is below or above its ability. The main characteristics of these databases can be found in table 1. A more detailed description of each database can be found in [11].
3.2. Combining several databases
One problem to solve is the combination of multiple databases. In-deed, each subjective test is different, using a different protocol or using a different range of image quality. Thus, the subjective score or Mean Opinion Score (MOS) given to an image is not necessar-ily the absolute quality score of this image. In order to make our training database, it is required to combine the scores of the four databases, namely Narwaria et al., Korshunov et al., Zerman et al. and 4Kdtb. For this purpose, we align the MOS of the different subjective tests into a common quality scale thanks to the Iterated Nested Least Square Algorithm (INLSA) proposed in [25]. INLSA allows to determine a common scale. This algorithm is based on the assumption that objective quality metrics are linearly correlated with the subjective scores. Four objective metrics were selected: HDR-VDP-2, VIFJzazbz, MS-SSIMJzazbz and FSIMJzazbz. The
figure 2 illustrates the impact of the INLSA algorithm. It represents the HDR-VDP2 score in function of the MOS before the INLSA al-gorithm (MOS are re-scale between 0 and 1) and after the INLSA algorithm.
3.3. Support Vector Regression
To train the SVR, we first conduct a grid-search using all of the training databases to tune the hyper-parameters to obtain optimal re-sults. Once the best hyper-parameters are found, we split our training database into two sets of images, one for training the SVR (80% of images) and one for testing (20% of images). This split is done ran-domly with the constraint that the same content can not be present in the training set and testing set. We then train the SVR using the function fitrsvm of Matlab. To obtain a more robust estimation of the proposed model performance and to eliminate selection bias, we repeat this split 1000 times.
We evaluate the performance of our proposed metric using the
me-(a) (b)
Fig. 2: HDR-VDP2 score in function of MOS (a) before the INLSA algorithm (b) after the INLSA algorithm
dian scores of four indexes: the Spearman Rank Order Correla-tion Coefficient (SROCC), the Kendall Rank CorrelaCorrela-tion Coefficient (KRCC), the Pearson Correlation Coefficient (PCC) and the Root Mean Square Error (RMSE). As recommended in [26], before com-puting these indicators, a non-linear regression is applied to the ob-jective quality scores thanks to a logistic function:
e Qi= a +
b 1 + e−(Qi−c)d
(2)
where Qiis the score of the quality metrics on the image i and eQi
the mapped quality score. Parameters a, b, c and d are determined by the regression conducted by the lsqcurvefit function of Matlab.
4. RESULTS 4.1. Proposed metric performance
In this section, we present the performance of the proposed met-ric on the 1000 test sets. The median performances across 1000 Train-Test Combinations can be found in Table 2. We compare the score of the proposed metric to five other metrics: HDR-VDP-2 and four SDR metrics adapted to HDR using two uniform color space Jzazbzand ICtCp [27] using the methodology presented in [11]:
MS-SSIMJzazbz, MS-SSIMICtCp, FSIMJzazbz, FSIMICtCp. All
of those metrics are color-blind and only consider luminance distor-tions. To ensure that each feature is meaningful, we also report four
Table 2: Median performances across 1000 Train-Test Combina-tions on the test set.
SROCC KRCC PCC RMSE MS-SSIMJzazbz 0.8096 0.6246 0.7963 16.6 MS-SSIMICtCp 0.9197 0.7507 0.9237 10.74 FSIMJzazbz 0.8955 0.7267 0.8953 12.2 FSIMICtCp 0.8807 0.7104 0.8757 13.52 HDR-VDP-2 0.9186 0.7496 0.9179 10.9 metric (1) 0.9234 0.7597 0.9244 10.46 metric (2) 0.9165 0.7563 0.9235 10.51 metric (3) 0.9113 0.7413 0.9101 11.36 metric (4) 0.9294 0.7692 0.9271 10.28 Proposed metric 0.9421 0.7899 0.9376 9.5
other trained metrics using only a subsection of all features. Met-ric (1) is trained with only HDR-VDP-2 and FSIMJzazbz, metric
(2) with all features except HDR-VDP2, metric (3) with all features except FSIMJzazbzand metric (4) with all features except SIJz.
Ta-ble 2 shows that the proposed model provides superior performances than any other metric. To ensure that the good performances of the proposed model are homogeneous across all databases, we also re-port the median SROCC of the 1000 trained metrics, database by database in Table 3. Because the number of images in the test set coming from one database was rather small, we use the complete databases to calculate the performance indexes and not only the im-ages used in the test set. We observe that achieving high accuracy on one database does not prevent the model performances on an-other database. Our proposed model reaches higher performances when compared to other metrics and especially to HDR-VDP-2 and FSIMJzazbz, the two metrics that are also forming the basis of our
model.
Table 3: Median SROCC across 1000 Train-Test Combinations database by database: (a) 4Kdtb (b) khorshunov et al. (c) Narwaria et al. (d) Zerman et al.
(a) (b) (c) (d) MS-SSIMJzazbz 0.8306 0.9648 0.9088 0.8109 MS-SSIMICtCp 0.8447 0.9529 0.8714 0.9260 FSIMJzazbz 0.8849 0.9663 0.8466 0.9031 FSIMICtCp 0.9049 0.9477 0.8645 0.8863 HDR-VDP-2 0.8678 0.9516 0.8909 0.9289 Proposed metric 0.9095 0.9704 0.9240 0.9474
4.2. Validation on an independent database
In this section, we provide further evidence that the proposed metric can be generalized to other databases. More specifically, we eval-uate its performance on the HDdtb database. In Table 4, we report results obtained on the complete HDdtb database and the results on the HDdtb images with compression artifacts only. It is worth men-tioning that such artifacts are of same nature that those we trained our model for. The proposed metric outperforms five state-of-the-art metrics for all performance indexes when considering the complete database. As it was expected, the gain is higher when considering only the images with compression artifacts.
Table 4: Performances of several metrics for (a) the complete database HDdtb (b) Only the HDdtb images with compression ar-tifacts.
(a) SROCC KRCC PCC RMSE
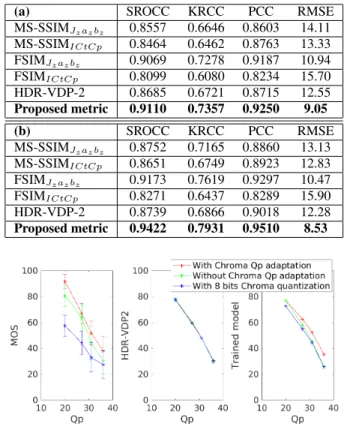
MS-SSIMJzazbz 0.8557 0.6646 0.8603 14.11 MS-SSIMICtCp 0.8464 0.6462 0.8763 13.33 FSIMJzazbz 0.9069 0.7278 0.9187 10.94 FSIMICtCp 0.8099 0.6080 0.8234 15.70 HDR-VDP-2 0.8685 0.6721 0.8715 12.55 Proposed metric 0.9110 0.7357 0.9250 9.05 (b) SROCC KRCC PCC RMSE MS-SSIMJzazbz 0.8752 0.7165 0.8860 13.13 MS-SSIMICtCp 0.8651 0.6749 0.8923 12.83 FSIMJzazbz 0.9173 0.7619 0.9297 10.47 FSIMICtCp 0.8271 0.6437 0.8289 15.90 HDR-VDP-2 0.8739 0.6866 0.9018 12.28 Proposed metric 0.9422 0.7931 0.9510 8.53
Fig. 3: Subjective and objective scores in function of HEVC Qp for the image Bike 30s.
4.3. Sensitivity to color distortions
One of the metric goals is to assess not only the luminance distor-tions but also chromatic distordistor-tions. To illustrate this behavior, we use the images of the 4Kdtb database. Indeed, the difference be-tween the compression strategies is chrominances management. As illustrated on Figure 3 (left), observers are sensitive to the different modes of compression. Scores from HDR-VDP-2 and from the pro-posed metric are given on the right hand side. As expected, HDR VDP2 is not sensitive to chromatic distortions while the proposed metric is.
5. CONCLUSION
In this paper, we proposed a new full-reference quality metric adapted to HDR/WCG content. This metric is a combination of two full-reference quality metrics as well as color image features and the image spatial information. Those features are fused into one metric with an SVR method. Experimental results show that the proposed metric can accurately assess the quality of images distorted by com-pression. Moreover, contrary to most HDR metrics, the metric is sensitive to chromatic distortions as well as luminance distortions. However, due to the characteristics of the database used to train and test the metric, it is not possible to assess its performance for distortion beyond image compression. Databases with more various kind of distortions are needed to improve the proposed metric.
6. REFERENCES
[1] “Parameter values for ultra-high definition television systems for production and international programme exchange,” Rec BT.2020-2, ITU-R, 2016.
[2] “Parameter values for the hdtv standard for production and in-ternational program exchange,” Rec BT.709-6, ITU-R, 2015. [3] R. Mantiuk, KJ. Kim, AG. Rempel, and W. Heidrich,
“Hdr-vdp-2: A calibrated visual metric for visibility and quality pre-dictions in all luminance conditions,” ACM Trans. Graph., vol. 30, no. 4, pp. 40:1–40:14, July 2011.
[4] M. Narwaria, R. Mantiuk, MP. Da Silva, and P. Le Callet, “Hdr-vdp-2.2: a calibrated method for objective quality pre-diction of high-dynamic range and standard images,” Journal of Electronic Imaging, vol. 24, pp. 24 – 24 – 3, 2015.
[5] M. Narwaria, MP. Da Silva, and P. Le Callet, “Hdr-vqm: An objective quality measure for high dynamic range video,” Sig-nal Processing: Image Communication, vol. 35, pp. 46 – 60, 2015.
[6] Z. Wang, AC. Bovik, HR. Sheikh, and EP. Simoncelli, “Image quality assessment: from error visibility to structural similar-ity,” IEEE Transactions on Image Processing, vol. 13, no. 4, pp. 600–612, April 2004.
[7] Z. Wang, EP. Simoncelli, and AC. Bovik, “Multiscale struc-tural similarity for image quality assessment,” in The Thrity-Seventh Asilomar Conference on Signals, Systems Computers, Nov 2003, vol. 2, pp. 1398–1402.
[8] HR. Sheikh, AC. Bovik, and G. De Veciana, “An informa-tion fidelity criterion for image quality assessment using natu-ral scene statistics,” IEEE Transactions on image processing, 2005.
[9] L. Zhang, L. Zhang, X. Mou, and D. Zhang, “Fsim: A feature similarity index for image quality assessment,” IEEE Transac-tions on Image Processing, vol. 20, no. 8, pp. 2378–2386, Aug 2011.
[10] TO. Aydın, R. Mantiuk, and HS. Seidel, “Extending quality metrics to full luminance range images,” Proc.SPIE, vol. 6806, pp. 6806 – 6806 – 10, 2008.
[11] M. Rousselot, O. Le Meur, R. Cozot, and X. Ducloux, “Quality assessment of hdr/wcg images using hdr uniform color spaces,” Journal of Imaging, vol. 5, no. 1, 2019.
[12] K. Okarma, “Combined full-reference image quality metric linearly correlated with subjective assessment,” in Artificial Intelligence and Soft Computing, Berlin, 2010, pp. 539–546, Springer Berlin Heidelberg.
[13] T. Liu, W. Lin, and CJ. Kuo, “Image quality assessment using multi-method fusion,” IEEE Transactions on Image Process-ing, vol. 22, no. 5, pp. 1793–1807, May 2013.
[14] JY. Lin, T. Liu, EC. Wu, and CJ. Kuo, “A fusion-based video quality assessment (fvqa) index,” in Signal and Information Processing Association Annual Summit and Conference (AP-SIPA), 2014 Asia-Pacific, Dec 2014, pp. 1–5.
[15] JY Lin, CH. Wu, I. Katsavounidis, Z. Li, A. Aaron, and CJ. Kuo, “Evqa: An ensemble-learning-based video quality as-sessment index,” in 2015 IEEE International Conference on Multimedia Expo Workshops (ICMEW), June 2015, pp. 1–6.
[16] Z. Li, A. Aaron, I. Katsavounidis, A. Moorthy, and M. Manohara, “Toward a practical perceptual video quality metric,” The Netflix Tech Blog, 2016.
[17] A. Choudhury and S. Daly, “Combining quality metrics for improved hdr image quality assessment,” in 2019 IEEE Con-ference on Multimedia Information Processing and Retrieval (MIPR), March 2019, pp. 179–184.
[18] M. Rousselot, E. Auffret, X. Ducloux, O. Le Meur, and R. Co-zot, “Impacts of viewing conditions on hdr-vdp2,” in 2018 26th European Signal Processing Conference (EUSIPCO), Sep. 2018, pp. 1442–1446.
[19] M. Safdar, G. Cui, YJ. Kim, and MR. Luo, “Perceptually uni-form color space for image signals including high dynamic range and wide gamut,” Opt. Express, vol. 25, no. 13, pp. 15131–15151, Jun 2017.
[20] “Subjective video quality assessment methods for multimedia applications,” Rec P.910, ITU-T, 2008.
[21] M. Narwaria, MP. Da Silva, P. Le Callet, and R. Pepion, “Tone mapping-based high-dynamic-range image compres-sion: study of optimization criterion and perceptual quality,” Optical Engineering, vol. 52, pp. 52 – 52 – 16, 2013.
[22] P. Korshunov, P. Hanhart, T. Richter, A. Artusi, R. Mantiuk, and T. Ebrahimi, “Subjective quality assessment database of hdr images compressed with jpeg xt,” in 2015 Seventh In-ternational Workshop on Quality of Multimedia Experience (QoMEX), May 2015, pp. 1–6.
[23] E. Zerman, G. Valenzise, and F. Dufaux, “An extensive perfor-mance evaluation of full-reference hdr image quality metrics,” Quality and User Experience, vol. 2, no. 1, pp. 5, 2017. [24] “Conversion and coding practices for hdr/wcg y’cbcr 4:2:0
video with pq transfer characteristics,” Rec H-Suppl.15, ITU-T, 2017.
[25] MH. Pinson and S. Wolf, “An objective method for combining multiple subjective data sets,” Proc.SPIE, vol. 5150, pp. 5150 – 5150 – 10, 2003.
[26] AM. Rohaly, J. Corriveau, JM. Libert, AA. Webster, V. Baroncini, J. Beerends, JL. Blin, L. Contin, T. Hamada, D. Harrison, et al., “Video quality experts group: Current re-sults and future directions,” in Visual Communications and Image Processing 2000. International Society for Optics and Photonics, 2000, vol. 4067, pp. 742–754.
[27] “Image parameter values for high dynamic range television for use in production and international programme exchange,” Rec BT.2100-1, ITU-R, 2017.