Effectiveness of R&D Tax Incentives in Small and Large Enterprises in Québec
36
0
0
Texte intégral
(2) CIRANO Le CIRANO est un organisme sans but lucratif constitué en vertu de la Loi des compagnies du Québec. Le financement de son infrastructure et de ses activités de recherche provient des cotisations de ses organisations-membres, d’une subvention d’infrastructure du Ministère du Développement économique et régional et de la Recherche, de même que des subventions et mandats obtenus par ses équipes de recherche. CIRANO is a private non-profit organization incorporated under the Québec Companies Act. Its infrastructure and research activities are funded through fees paid by member organizations, an infrastructure grant from the Ministère du Développement économique et régional et de la Recherche, and grants and research mandates obtained by its research teams. Les partenaires du CIRANO Partenaire majeur Ministère du Développement économique, de l’Innovation et de l’Exportation Partenaires corporatifs Banque de développement du Canada Banque du Canada Banque Laurentienne du Canada Banque Nationale du Canada Banque Royale du Canada Banque Scotia Bell Canada BMO Groupe financier Bourse de Montréal Caisse de dépôt et placement du Québec DMR Fédération des caisses Desjardins du Québec Gaz de France Gaz Métro Hydro-Québec Industrie Canada Investissements PSP Ministère des Finances du Québec Raymond Chabot Grant Thornton Rio Tinto Alcan State Street Global Advisors Transat A.T. Ville de Montréal Partenaires universitaires École Polytechnique de Montréal HEC Montréal McGill University Université Concordia Université de Montréal Université de Sherbrooke Université du Québec Université du Québec à Montréal Université Laval Le CIRANO collabore avec de nombreux centres et chaires de recherche universitaires dont on peut consulter la liste sur son site web. Les cahiers de la série scientifique (CS) visent à rendre accessibles des résultats de recherche effectuée au CIRANO afin de susciter échanges et commentaires. Ces cahiers sont écrits dans le style des publications scientifiques. Les idées et les opinions émises sont sous l’unique responsabilité des auteurs et ne représentent pas nécessairement les positions du CIRANO ou de ses partenaires. This paper presents research carried out at CIRANO and aims at encouraging discussion and comment. The observations and viewpoints expressed are the sole responsibility of the authors. They do not necessarily represent positions of CIRANO or its partners.. ISSN 1198-8177. Partenaire financier.
(3) Effectiveness of R&D Tax Incentives in Small and Large * Enterprises in Québec. Rufin Baghana†, Pierre Mohnen ‡. Résumé / Abstract Nous estimons l’efficacité des incitations fiscales à la R-D au Québec à partir des données des enquêtes annuelles de la R&D et de la manufacture et à partir des données administratives pour la période 1997 à 2003. L’élasticité-prix de court terme est estimée à -0.10 et celle de long terme à -0.14, avec une élasticité légèrement supérieure pour les petites entreprises. Nous trouvons une perte sèche assez nette pour les grandes firmes associée aux crédits d’impôt basés sur les niveaux de R-D. Pour les petites firmes cette perte sèche n’est pas suffisante pour détruire l’additionalité des crédits d’impôt. Les crédits d’impôt basés sur la recherche incrémentale n’accusent pas de perte sèche et sont de ce point de vue préférables aux crédits en proportion du niveau de R-D. Mots clés : Incitations fiscales à la R-D, élasticité-prix de court terme, Québec.. In this paper we evaluate the effectiveness of R&D tax incentives in Quebec, using manufacturing firm data from 1997 to 2003 originating from R&D surveys, annual surveys of manufactures and administrative data. The estimated price elasticity of R&D is -0.10 in the short run and -0.14 in the long run, with a slightly higher elasticities for small firms than for large firms. We show that there is a deadweight loss associated with level-based R&D tax incentives that is particularly acute for large firms. For small firms it is not sizeable enough to suppress the R&D additionality, at least not during quite a number of years after the initial tax change. Incremental R&D tax credits do not suffer from this deadweight loss and are from that perspective preferable to level-based tax incentives. Keywords: R&D tax incentives, price elasticity of R&D, Quebec.. *. We thank Simon Parker, Bronwyn Hall, Jacques Mairesse, Marco Vivarelli and the participants of the 2008 “Drivers and impacts of corporate R&D in SMEs” conference for helpful comments. We also wish to thank Brigitte Poussart from the Institut de la Statistique du Québec for her help in setting up the dataset and Michel Falardeau from the Ministère des Finances du Québec for his explanations of the R&D tax incentives in Québec. We acknowledge financial support from the SCIFI-GLOW grant no. 217436 of the 7th EU Framework Program † Rufin Baghana, Ministère des Finances, Québec. ‡ Maastricht University, UNU-MERIT and CIRANO, email: P.Mohnen@MERIT.unimaas.nl..
(4) Introduction Many countries rely on a policy of R&D tax incentives to spur R&D in the private sector. In some countries, the budget allocated to this policy is substantive. Canada is one of these countries. In 2006, the Canadian federal government spent about $3 billion a year on its R&D tax incentives program (Finance Canada, 2007). Among the Canadian provinces, Québec has been the most generous in its R&D tax incentives for many years. In 2005, provincial payments for fiscal assistance amounted to 538 million dollars. Tax incentives have the virtue of being more neutral in the type of firms and projects funded than measures of direct R&D support in the form of grants and subsidies, letting private business determine the projects and the amount of R&D. This virtue could also be seen as a weakness, in so far as it might be socially preferable to steer R&D towards projects with high spillovers. Many countries try to focus their support on small and medium size enterprises, which are, more than big firms, plagued by the market failure of financing intangible investment in the presence of information asymmetries. As firms rely more on internal funds than on external debt and equity for finance their investments, especially R&D investments, small firms might be more financially constrained than large firms.1 A number of studies have been done to evaluate the effectiveness of tax incentives in making firms spend more on R&D. The usual evaluation consists in checking whether there is R&D additionality, in the sense that private firms increase their R&D expenditures by more than it costs the government to support the tax incentives program. If per dollar of government support less than one dollar of additional private R&D gets spent by business, then public support partially crowds out private funding for R&D. The evaluation of the so-called “bang for the buck” is a rough cost-benefit analysis which generally does not take into account factors like spillovers, indirect tax returns, administration costs, and the opportunity cost of spending taxable income on R&D support.. 1. See the literature on the cash-flow sensitivity of investment following the seminal work of Fazzari, Hubbard and Peterson (1988).. 1.
(5) In the literature there are two approaches to the evaluation of the effectiveness of R&D tax incentives. The first approach estimates the treatment effect by constructing counterfactuals, instrumenting the treatment, comparing experimental and treated firms before and after the introduction of a policy change, or by comparing firms that are close to a discontinuity in the treatment design. Matching estimators compare the average R&D effort of firms that receive R&D tax credits with the average R&D of firms that do not but that are otherwise similar, in particular in having the same likelihood of receiving R&D tax credits (Czarnitzki, Hanel and Rosa, 2004; Corchuelo and Martínez-Ros, 2008, Duguet, 2007). Instrumental variables estimators instrument the treatment by regressing it on a certain number of explanatory variables (Cappelen, Raknerud and Rybalka, 2008) or by controlling for the selected firms that know about R&D tax incentives and apply for it (Corchuelo and Martínez-Ros, 2008). Difference-in-difference estimators compare the R&D of firms in the reference and treated group before and after a policy change, in this case a new feature in R&D tax incentives (Cornet and Vroomen, 2005). Regression discontinuity design compare the R&D of firms that are affected or unaffected by an exogenous discontinuity in the treatment function, for example just below and just above a ceiling in the conditions for being eligible to receive R&D tax credits (Haegeland and Moen, 2007). The second approach is based on a structural model deriving from some kind of optimization objective a demand for R&D equation that depends inter alia on a user cost of R&D itself a function of R&D tax credit parameters (Bernstein, 1986, Hall, 1993, Bloom, Griffith and van Reenen, 2002, Mairesse and Mulkay, 2003). The structural modeling approach permits simulations of the effects of future tax changes and allows distinguishing between short-run and long-run effects. Given the endogeneity of the amount of R&D tax credits received and a possible distributed lag specification, instrumental variables estimations are used. This study evaluates the effectiveness of the R&D tax incentives program in the province of Québec. We rely on a modeling of factor demand similar to the ones adopted in studies that have opted for an estimation of a factor demand model for R&D with R&D tax. 2.
(6) parameters included in the user cost of R&D (as in Bloom, Griffith and van Reenen (2002), Mairesse and Mulkay (2002), Dagenais, Mohnen and Therrien (2004), Hægeland and Moen (2007)). We construct an observational specific B-index that enters the user cost of capital and that reflects the various changes over time and across firms in the R&D tax credit scheme in Quebec and in Canada. As opposed to most other studies, we have access to administrative data capturing the real R&D tax support received by firms operating in the province of Quebec. For a survey of the empirical literature on R&D tax incentives, see Hall and van Reenen (2000) and Mohnen (2000). For previous work on Canadian firms, see Bernstein (1986), Lebeau (1996), Department of Finance and Revenue (1997), Dagenais, Mohnen and Therrien (2004), Czarnitzki, Hanel and Rosa (2004), and Parsons and Phillips (2007). The originality of this study is that it exploits the actual R&D tax credits received by every firm instead of just relying on the statutory tax rates and eligibility conditions and attributing tax incentives to every eligible firm. Indeed, many firms may either not know of the existence of tax incentives (especially small firms) or decide not to apply for R&D tax credits because of administration costs, inexperience or apprehension in dealing with the tax authorities. The second advantage of using the observed payments is that it does not oblige us to collect data on certain types of R&D, like cooperative R&D, that would be difficult to get. The third advantage has to do with the fact that in the R&D surveys firms operating in more than one province may not always split their R&D by province wheras from the administrative data the provincial figures are declared automatically. Few studies in the literature have been able to make use of the actual payments of tax incentives (Brouwer, den Hertog, Poot and Segers, 2002; Haegeland and Moen, 2007; de Jong and Verhoeven, 2007, Duguet, 2007). Since the tax support is more generous towards small and medium sized enterprises, it is of interest to compare the effectiveness of this policy for SMEs and large enterprises. Lokshin and Mohnen (2007) report that small firms (with less than 200 employees) are more sensitive to R&D tax incentives than large firms in the Netherlands. Small firms are likely to be more reactive to changes in R&D tax incentives (at least if they actually. 3.
(7) apply for them) as they have more difficulty in financing their R&D. They have little collateral, they may be young firms with little to show in terms of success, they may not even have patents to signal their capability to innovate. The estimation of the model and the evaluation of the program in terms of R&D additionality will be done separately for both types of firms. We want to investigate whether the same holds for firms in Quebec. The paper is organized as follows. Section 1 provides an overview of the R&D tax incentives in Quebec. Section 2 explains the construction of firm panel data resulting from the merger of three data sources. Section 3 sketches the structural model of demand for R&D from which we shall estimate the price elasticity of R&D. Section 4 presents and comments on the estimation results. Section 5 presents some simulation analyses of R&D tax experiments to calculate the ratio of additional R&D per dollar of tax expenditure for different modules of the R&D tax credit and to show differences in the effectiveness of R&D tax incentives for small and large firms.. 4.
(8) 1. Tax treatment in Quebec It should be noted that fiscal measures to support innovative activities other than R&D have also been implemented in Quebec. This is the case for the measures set up with respect to information technology development centres (ITDCs) and marketplaces for the new economy (MNEs) and other measures related to the knowledge-based economy such as the refundable tax credit for E-commerce solutions and the refundable tax credit for technological adaptation services. This study, however, focuses only on R&D fiscal measures and we present below the fiscal measures that took place in Quebec in the last three decades, that is to say, the SR&DE refundable tax credit; the super-deductions for R&D and the refundable tax credit based on the increase in R&D expenditures.2 Table 1 summarizes the estimated cost of the various fiscal measures in support of R&D that are in order:. 1.1 The refundable tax credit for scientific research and experimental development (SR&ED) (1983- ) This tax credit is the main R&D fiscal incentive in Quebec. Introduced in 1983, it was the first fiscal measure aimed at R&D in Quebec. As revealed in the appendix, the SR&ED has been modified a few times. At the beginning it was essentially based on the salaries 2. As firms claiming R&D tax credits in Quebec are also tax claimants at the federal level of government, Revenu Québec arranged. with the federal taxation agency, the Canada Revenue Agency, to apply the same definition for eligible R&D activities. Furthermore, to ensure the uniformity in its application at both, provincial and federal level, QR&ED are solely determined by Canada Revenue Agency. This definition complies with the guidelines of the OECD Frascati Manual (OECD, 2002). More specifically, Quebec's Taxation Act defines “scientific research and experimental development” by the systematic investigation or search that is carried out in a field of science or technology by means of (i) basic research or applied research undertaken for the advancement of scientific knowledge or (ii) experimental development undertaken for the purpose of achieving technological advancement for the purpose of creating new, or improving existing, materials, products, devices or processes, including incremental improvements thereto. It includes work undertaken directly in support of R&D, where it is commensurate with the needs of such research or experimental development and corresponds to engineering, design, operations research, mathematical analysis, computer programming, data collection, testing and psychological research. However, it excludes work undertaken in one of the following: market research or sales promotion; quality control or routine testing of materials, products, devices or processes; research in the social sciences or the humanities; prospecting, exploring or drilling for, or producing, minerals, petroleum or natural gas; the commercial production of a new or improved material, device or product, or the commercial use of a new or improved process; style changes; or routine data collection.. 5.
(9) of researchers. Later on, Quebec’s government put emphasis on both human capital and more intense cooperation between business, universities and research centres in designing the tax credit. This lead to the following four measures:. 1) The refundable tax credit for salaries and wages of researchers It still represents the major component (more than 95% in the last years) of the overall fiscal incentives in Quebec. The tax credit can be claimed by corporations that conduct R&D activities in Quebec or that have such activities carried out in Quebec on their behalf. For example, in 2003 corporations may claim a refundable tax credit that amounts to 17.5% on the salaries and wages they pay in Quebec in a given taxation year. However, for the first $2 000 000 of annual salaries and wages paid in a given taxation year, the rate of the tax credit is as follows:3 — 37.5% in the case of SMEs4; — between 37.5% and 17.5%, in the case of corporations with assets between $25 and $50 million. A linear reduction in the rate of the tax credit (from 37.5% to 17.5) is applied with respect to asset increase according to the following formula: 35% - {[(A- 25 000 000 $) x 17.5%] / 25 000 000 $}, A being the corporation’s assets; — 17.5%, in the case of corporations with assets of $50 million or more. 2) The refundable tax credit for university research or research carried out by a public research centre or a research consortium This tax credit permits firms that conclude a university research contract with an eligible university entity, a public research centre or a research consortium to claim a refundable credit of 35% of the eligible R&D expenditures. In the case where the research is done by an eligible university entity, a public research centre or a research consortium that is not affiliated to the taxpayer, 20% is subtracted from the eligible expenditures in calculating the tax credit. Entitlement to such tax credits need prior authorization. 3) The refundable tax credit for pre-competitive research 3 4. See the appendix for the history of R&D tax credit rates in Quebec.. Quebec's Taxation Act defines a corporation as a SME, a business with asset, including those of associated corporation, less than 25 million. In addition, the business must not be controlled by one or more non-residents of Canada.. 6.
(10) Under this scheme, corporations that enter into a cooperative agreement with nonaffiliated corporations to carry out work on their own or to have work carry out on their behalf, under a pre-competitive research project, a catalyst project or an environmental technology innovation project, may claim a refundable tax credit of 35% of the eligible R&D expenditures incurred in Quebec. Again the cooperative agreement needs to be authorized by the government. 4) The dues or contributions paid to a research consortium A corporation that is a member of a recognized research consortium may claim a refundable tax credit of 35% of its total fees or dues paid to a research consortium to conduct in Quebec R&D related to its activities.5 1.2 The super-deductions for R&D (1999-2000) Introduced in March 1999 and withdrawn a year later6, the super-deductions for R&D were an alternative to the refundable SR&ED tax credits. Firms could choose between the refundable tax credit and the super-deduction. Firms with sufficient income were better off choosing super-deductions in order to reduce their eligible business income to zero, and those with an operating loss were better off choosing the refundable tax credits. Firms choosing the super-deductions could reduce substantially their net investment cost because the federal government applied different rules in the treatment of refundable tax credits and super-deductions for R&D. For example the net cost incurred by an SME for a $100 wage expenditure would be only $ 9 in the case of super-deductions compared to $ 27 if a tax credit were claimed. The super-deductions were withdrawn after one fiscal year when the federal government decided to apply the same rules in the treatment of refundable tax credits and super-deductions for R&D. 1.3 The refundable tax credit based on the increase in R&D expenditures (1999-2004) This tax credit was announced by the government of Quebec along with the superdeductions in the Budget speech of March 1999. It was implemented for a five year period as part of the effort to increase the ratio of R&D expenditures to GDP to the 5. There can be no double-counting : a firm may only claim one type of tax credit per dollar spent on R&D.. 6. In table 1, it appears in two years because firms use different fiscal years.. 7.
(11) average performance of the G7 countries. The credit applied only to SMEs, i.e. companies with assets below $25 million. Under this tax credit, SMEs could claim an additional 15% tax credit on the eligible R&D expenditures exceeding a reference amount equal to the average R&D expenditures for the preceding three years. SMEs that opted for super-deductions could also benefit from this tax credit with an additional deduction of 190% of their eligible R&D expenditures.. Table 1: Evolution of the estimated cost of fiscal incentives aimed at R&D in Quebec, 1997-2005 (Millions of dollars) Year Scientific research and experimental development ⎯ Salaries of researchers ⎯ University research ⎯ Other Super-deductions for R&D Credit based in the increase in R&D expenditures Total R&D tax credits. 1997. 1998. 1999. 2000. 2001. 2002. 2003. 2004. 2005. 319. 326. 383. 372. 506. 566. 525. 495. 510. 7. 6. 6. 7. 8. 7. 6. 6. 6. 21. 19. 29. 28. 24. 25. 23. 22. 22. -. -. -. 55. 44. 347. 351. f 418. 25 487. 45 627. 41 639. 41 596. 18 541. 538. (-) The measure did not apply that year (f) The tax cost is less than CAN $ 2 million Sources: Ministère des Finances, Québec, 2005.. 2. DATA The dataset used in this study results from the matching of three different microdata files: the survey on Research and Development in Canadian Industry (RDCI), the Annual Survey of Manufactures (ASM), and administrative data from Revenu Québec. The RDCI survey is a firm-level survey conducted on an annual basis by Statistics Canada. Its sampling frame comprises all Canadian firms known or believed to perform or fund R&D. Since 1997, only firms performing or funding more than $1 million in R&D are surveyed. For all the other firms, the data are extracted from administrative data 8.
(12) from Canada Revenue Agency (CRA).7 The Annual Survey of Manufactures (ASM)8 is an annual survey conducted by Statistics Canada that collects data on employment, wages, total cost of materials, total sales of manufactured products, inventories, value added by manufacturing and capital expenditures.. It also provides other principal. industrial statistics such as energy consumption and information on commodities consumed, produced and shipped. Contrarily to the RDCI survey described above that collects and reports data at the company or enterprise level, the reporting unit in the case of the ASM survey is the establishment. More specifically, the universe of this survey consists of all establishments primarily engaged in manufacturing activities, that is, all establishments classified in sectors 31, 32 and 33 under the North American Industry Classification System (NAICS). Two methods are used to collect data, the data collected directly from firms’ respondents by questionnaires and the data obtained from administrative files from Canada Revenue Agency. Administrative data from Revenu Québec (ADRQ) comprises records of the amounts of SR&ED or other fiscal incentives to R&D effectively received by R&D performers located in Quebec or having had R&D conducted on their behalf in Quebec. This is a slight difference compared to the target population of Statistics Canada RDCI survey described above, which does not include firms that contract out their R&D activities. However, Statistics Canada and Revenu Quebec both use the same definition for SR&ED. The reporting unit in the present dataset is the provincial-enterprise, which is the same as in the case of the RCDI survey data of Statistics Canada. Matching was performed at the level of Provincial-enterprises9. The three files contained only firms located in Quebec. Matching proceeded in two steps: the RDCI data from Statistics Canada was matched to the fiscal data from Revenu Québec, and the resulting 7. For firms with less than 1 million of R&D expenditures, the R&D data come from Revenue Canada for firms that claim R&D federal tax credits. We have no information about small R&D performers that claim no R&D tax credits and that might nevertheless have some R&D expenditures.. 8. Starting in 2004, the Annual Survey of Manufactures has been amalgamated with the Annual Survey of Forestry to form the Annual Survey of Manufactures and Logging (ASML).. 9. The notion of ‘‘Provincial-enterprise’’ is used to designate all establishments of a given enterprise within a province and in the same industry as identified by the 4-digit NAICS 1997.. 9.
(13) file was then matched to the ASM data from Statistics Canada. Another difficulty was due to the fact that the data correspond to different levels of aggregation. While the RCDI-ADRQ matched data are at the provincial–enterprise level, the ASM data are at the establishment level. To solve this problem, we grouped the establishments in the ASM data file by provincial-enterprises prior to performing the matching in the cases of multiestablishments enterprises. We decided to discard all cases of mergers and acquisitions. The data on the fiscal support received from the Federal government were constructed by using the official statutory rates.10 Breaking R&D performers by size class in the manufacturing sector between 1997 and 2003, data show that most of the R&D tax credit applications come from small firms but that the large firms get the greater part of the amount of attributed tax credits. As shown in Table 2, more than 65.3 % of all tax claimants are small firms (0 to 50 employees) making up 28.5% of the total value of attributed tax credits. However, large firms that represent only 3.6 % of tax claimants get more than 37.5% of the total amount of attributed tax credits. The tax credit for salaries of researchers was the most important program accounting for at least 75% of the total attributed tax credits. The tax credit for university research shows no significant differences across size classes. Tax credit for pre-competitive research was used more often by small and medium sized firms (less than 500 employees). The reason is that because of limited capacity of funding a research project, firms enter into partnership contracts for pre-competitive research projects (or to have the project done on their behalf). This tax credit and the credit for university research, however, represented only 0.9% and 0.6% resp. of the total attributed tax credit over the sample period. Concerning the tax credit for dues or contributions paid by. 10. The main difficulty encountered in matching the RDCI/ADRQ and ASM datasets is that they do not have a unique identifier. While Statistics Canada uses the company number to identify establishments in the RCDI file, Revenu Quebec uses a different identifier called NEQ (numéro d’entreprise du Quebéc). However, since the file from Statistics Canada includes the names and addresses of the surveyed firms, the NEQ was obtained from the registry of enterprises from Quebec’s Inspector General of Financial Institutions (IGIF). We were confronted with the problem that the company names could sometimes differ because of translation or transcript errors. After 2000, at least 93% of the firms in the RDCI/ADRQ file could be matched with the ASM file, before 2000 only 69% to 77% of the firms could be matched. In terms of total R-D, the totals from RDCI and the matched data hardly differ.. 10.
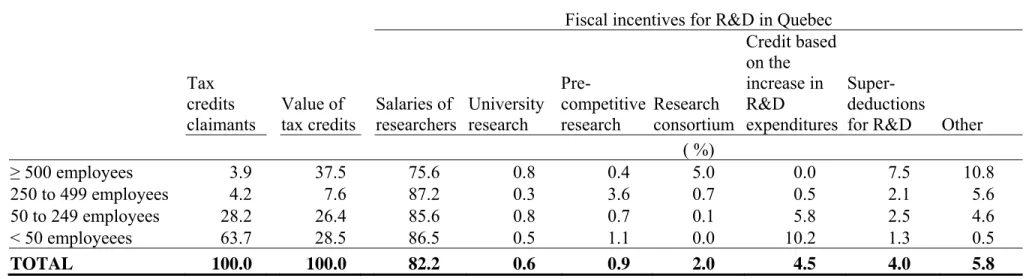
(14) corporations to a research consortium, data show that the majority of beneficiaries were firms with more than 500 employees. Table 2 also shows the non-negligible use of other fiscal incentives such as the superdeductions for R&D and the tax credit based on the increase in R&D expenditures. Even though these fiscal measures lasted only 1 and 5 years respectively, corresponding claims totaled 4.0% and 4.5% respectively of the total attributed tax credits over the sample period.. 11.
(15) Table 2: Use of Quebec’s R&D tax credits by class size in the manufacturing sector (% of firms), 1997-2003. Tax credits claimants ≥ 500 employees 250 to 499 employees 50 to 249 employees < 50 employeees TOTAL. 3.9 4.2 28.2 63.7 100.0. Value of tax credits 37.5 7.6 26.4 28.5 100.0. Fiscal incentives for R&D in Quebec Credit based on the Preincrease in SuperSalaries of University competitive Research R&D deductions researchers research research consortium expenditures for R&D Other ( %) 75.6 0.8 0.4 5.0 0.0 7.5 10.8 87.2 0.3 3.6 0.7 0.5 2.1 5.6 85.6 0.8 0.7 0.1 5.8 2.5 4.6 86.5 0.5 1.1 0.0 10.2 1.3 0.5 82.2 0.6 0.9 2.0 4.5 4.0 5.8. Sources: Ministry of Revenue of Quebec and Statistics Canada, compiled by the Institut de la Statistique du Québec and by the authors. 12.
(16) 3. MODEL The model from which we estimate the elasticity of R&D with respect to its user cost is the same as the one used in Lokshin and Mohnen (2007). In a nutshell, we start from a CES approximation to the true production function for firm i at time t (as in Chirinko et al., 1999; Hall and van Reenen, 2000; Mairesse and Mulkay, 2004):. Qit = Ft ( K it , X it ) = γ [ βK it− ρ + (1 − β ) X it− ρ ]−ν / ρ. (1). where Qit is the output, K it is the end of period R&D stock, X it is the other inputs, and γ (a scale factor), β (the distribution parameter), ν (a measure of the returns to scale) are parameters to be estimated that characterize the technology, as well as ρ that enters the expression for the elasticity of substitution ( σ ) between R&D stock and the other inputs and is given by σ = 1 /(1 + ρ ) ≥ 0. In a static model of profit maximization, the optimal. amount of R&D capital in logarithms would be given by11 kit* = a + (σ + (1 − σ ) /ν )qit − σ (u R ,it − pQ ,it ) .. (2). where u R ,it is the logarithm of the user cost of R&D and pQ ,it the unobservable output price. Following Klette and Griliches (1996) we assume a price elasticity of ε > 0 in absolute value of the demand for the output of firm i relative to industry demand: qit − qIt = −ε ( pQ ,it − pIt ). (3). where qIt is the industry demand and pIt the industry price in period t .Substituting (3) into (2) yields the long-run relationship kit* = a + φvit − σ (u R ,it − pI ,it ) + γqI ,t. 11. (4). Logarithmically-transformed variables are denoted by small letters.. 13.
(17) where φ = σ + μ (1 − σ ) /ν , and γ = (1 − μ )(1 − σ ) / v , and vit is the nominal output deflated by the industry output price deflator. Investment is composed of a replacement investment ( Ritr ) and a net investment ( Ritn ). The former is proportional to the R&D stock at the beginning of the period: Ritr = δK i ,t −1 . The latter represents the change in the R&D stock: Ritn = K it − K i ,t −1 . Hence we can write. ΔK it Rit R r + Ritn . = it =δ + K i ,t −1 K i ,t −1 K i ,t −1. (5). We approximate the discrete growth rate in the R&D stock by a log difference and assume that the growth rate in the R&D stock follows a partial adjustment mechanism. k t − k t −1 = λ ( k t* − k t −1 ). (6). which after substitutions can be rewritten as. kt − kt −1 = λ (kt* − kt*−1 ) + (1 − λ )λ (kt*−1 − kt*−2 ) + (1 − λ ) 2 λ (kt*−2 − kt*−3 ) + .... (7). Changes in the R&D stock are therefore expressed as a weighted sum of changes in the desired R&D stocks in the past. We can now rewrite (5) as. λ dvit λ (du Rit − dpIit ) λ dqIit Rit = δ +φ −σ +γ + ε it K i ,t −1 I − (1 − λ ) L I − (1 − λ ) L I − (1 − λ ) L. (8). or as. R Rit = λδ + (1 − λ ) i ,t −1 + φλ dvit − σλ ( du Rit − dp Iit ) + γλdq Iit + (ε it − (1 − λ )ε i ,t −1 ) K i ,t −1 K i ,t −2. (9). 14.
(18) We have appended a random error term in (9) to account for random unobserved disturbances. Any individual effect present in (4) is removed by the first-differencing. The error term follows a MA(1) process. Because of the simultaneity between the user cost and the amount of R&D we have to instrument for the contemporaneous change in the user cost of R&D. The short-run elasticity of R&D stock with respect to the user cost of R&D is given by − σλ . The long-run elasticity is given by − σ .. 4. Estimation results. Table 3 gives the magnitude of the variables appearing in the final estimating equation (9). The R&D stock has been constructed by the perpetual inventory method, the starting value being obtained by dividing the initial R&D flow by the sum of the R&D depreciation rate (taken to be 15%) and the growth rate of R&D flow during the sample period. The R&D stock is on average 5 times bigger than the R&D flow. All nominal values are converted in 2002 prices by the appropriate deflators. The R&D deflator is computed as the average of the GDP deflator and the monthly wage index of the manufacturing sector in Quebec (Statistics Canada, Cansim, table 281-0039). The industry price and quantity used to eliminate the firm output in equation (3) is from the NAICS 3-digit industry in which the firm has its major activity.. 15.
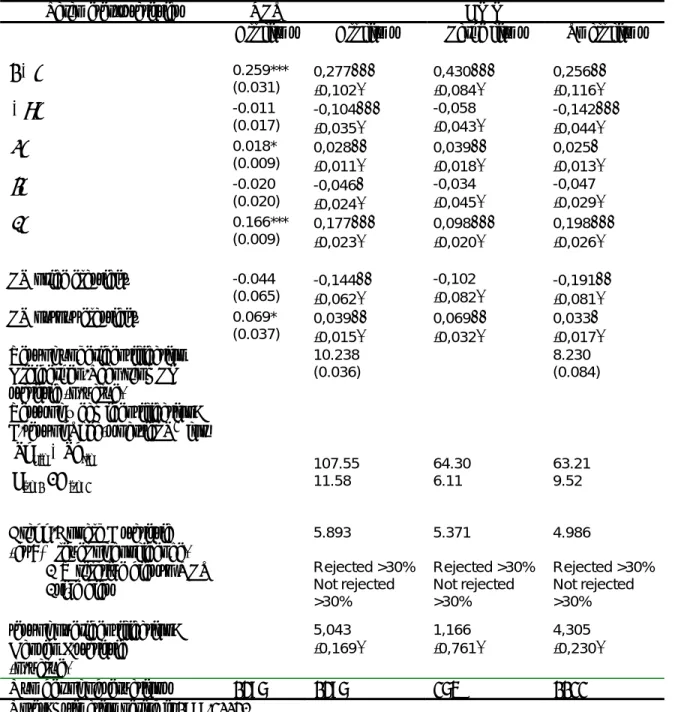
(19) Table 3. Variable constructions and descriptive statistics Variable. Construction. R K. Ratio of R&D flow to R&D stock, constructed as own R&D expenditures divided by R&D stock at the beginning of the period User cost of R&D deflated by the industry output deflator Firm sales in real terms, in logarithm. u. All firms 0.24 (0.25). Large firms 0.25 (0.25). Small firms 0.23 (0.23). 0.08 0.07 0.11 (0.05) (0.05) (0.03) 15.31 14.85 17.64 v (1.73) (1.42) (1.17) Industry sales 21.65 21.65 21.67 qI (0.64) (0.63) (0.65) (at 4-digit NAICS classification), in logarithm Log-difference in user cost of R&D deflated by 0.24 0.26 0.13 Δu (0.26) (0.27) (0.22) industry output deflator 0.08 0.09 0.03 Log-difference in firms’ real sales Δv (0.52 ) (0.50) (0.58) 0.03 0.03 0.02 Log-difference in industry real sales Δq I (0.19) (0.19) (0.18) 4.36 10.34 21.20 R&D stock, in million 2002 CAN$ K (39.50 ) (22.64) (95.30) Note: The descriptive statistics are sample means for the years 1997-2003. The base year is 2002.. In table 4 we present the GMM estimates for all firms in our sample, and separately for the large firms (with more than 250 employees) and the small firms (with less than 250 employees). As we can see, most of the firms in our sample are small, benefiting from favourable R&D tax credits. We have relatively few large firms in our sample. Two explanatory variables have to be instrumented: the user cost of R&D, which may vary with the amount of R&D, and the lagged dependent variable, which is correlated with the MA(1) error term. Without instrumenting, i.e. estimating equation (9) by ordinary least squares, yields a short-run price elasticity − σλ of -0.01 (non-significant). We then turn to the GMM estimations. As instrumental variables we use the one-period lagged level of the user cost of R&D (in log), the two-period lagged level of the dependent variable, and the contemporaneous R&D deflator, interest rate and tax credit on researchers’ salaries in Quebec. The rank test of underidentification rejects the null hypothesis that the matix of reduced form coefficients has less than full rank, and hence points to the relevance of the instruments and to the identification of the model with those instruments. Regarding the weakness of the instruments, the F-test based on Shea’s partial R2 is greater than 10 for 16.
(20) the first-stage significance of the exogenous variables in explaining the user cost of R&D but less than 10 in explaining the lagged dependent variable. However, in the presence of two endogenous variables we should rather use the Cragg Donald statistic (the minimum eigenvalue of the first stage F-statistic matrix) and the Stock and Yogo (2002) critical values for testing whether the instruments are weak 1) in terms of relative bias, i.e. whether the maximum relative squared bias of the IV estimator relative to the OLS estimator is at least some value b, and 2) in terms of bias in the Wald test size, i.e. whether the actual size of the test is at least some value b above the nominal level of the test. At the 5% level, we reject the null hypothesis that the instruments bias the IV estimate relative to the OLS estimate by more than 30% and we do not even reject the null that the bias in the size of the Wald test exceeds 30%. With our instruments the Sargan test of overidentifying restrictions is accepted. We have explored with different additional instruments (the lagged value of sales in logarithms, the Federal incremental tax credit rate, the ratio of log assets over log employees, and the ratio of growth in output over growth in employment). In each case the test of overidentifying restrictions was rejected. We thus conclude that our instruments are rather weak, but that at least they fulfill the overidentifying restrictions. The speed of adjustment in the desired R&D stock λ is equal to 0.74 for small firms and 0.57 for large firms, although statistically speaking they are not significantly different from each other. The short-run price elasticity of R&D is -0.14 for small firms and not significantly different from zero for large firms. It may be that large firms are not very price responsive, but it may also be that our sample size is too small for large firms to yield significant coefficients. For the whole sample, however, the short-run price elasticity is significantly different from zero and lower than for the subsample of small firms. Small firms do hence seem to be somewhat more price responsive than large firms. The long-run price elasticity σ is equal to -0.19 for small firms and -0.14 for the whole sample. The long-run output price elasticity is equal to 0.03 for small firms and 0.07 for large firms. From the constant term in the regression we can recover the estimated R&D depreciation rate, which turns out to be between 17% and 27%, thus not far away from our ad hoc choice of 15%.. 17.
(21) Table 4. Estimation of R&D equation (9) by GMM Parameters/statistics. 1− λ. − σλ. φλ γλ δλ LR price elasticity LR output elasticity. OLS All firms. GMM Large firms. Small firms. 0.259*** (0.031) -0.011 (0.017) 0.018* (0.009) -0.020 (0.020) 0.166*** (0.009). 0,277*** (0,102) -0,104*** (0,035) 0,028** (0,011) -0,046* (0,024) 0,177*** (0,023). 0,430*** (0,084) -0,058 (0,043) 0,039** (0,018) -0,034 (0,045) 0,098*** (0,020). 0,256** (0,116) -0,142*** (0,044) 0,025* (0,013) -0,047 (0,029) 0,198*** (0,026). -0.044 (0.065) 0.069* (0.037). -0,144** (0,062) 0,039** (0,015) 10.238 (0.036). -0,102 (0,082) 0,069** (0,032). -0,191** (0,081) 0,033* (0,017). 107.55 11.58. 64.30 6.11. 63.21 9.52. 5.893. 5.371. 4.986. Rejected >30% Not rejected >30%. Rejected >30% Not rejected >30%. Rejected >30% Not rejected >30%. 5,043. (0,169). 1,166 (0,761). (0,230). 1386. 264. 1122. Test of underidentification Kleibergen-Paap rank LM statistic (p-value) Tests of weak identification: F-test of Shea’s partial R2 for. du Rit − dpIit Ri ,t −1 / K i ,t − 2 Cragg-Donald F statistic (at 5% level of confidence) . IV relative bias to OLS . size bias test of overidentification: Hansen J-statistic (p-value) Number of observations. All firms. 1386. 8.230 (0.084). 4,305. Notes: Estimation period is 1998-2003. *** indicates significance at 1%, ** at 5%, * at 10%. Standard errors of the long-run elasticities are computed using the delta method. Heteroscedasticity consistent standard errors in parentheses unless otherwise indicated.. 18.
(22) We have also experimented with an alternative modeling of the dynamics in the R&D investment by specifying an error-correction model with an autoregressive distributed lag specification ALD(1,1) following Mairesse and Mulkay (2004). This specification does not assume a particular type of adjustement as we do in the above model. However, the alternative model did not yield a significant price elasticity of R&D. Maybe a higherorder lagged specification would be required but our short time interval does not allow us to do this. Finally, we could think of estimating a different sensitivity to R&D tax credits between small and large firms by exploiting a regression discontinuity design, in the sense that the user cost of R&D would be lower for small firms that benefit from more generous R&D tax credits. The number of firms falling in a close neighbourhood of the discontinuity in the R&D tax credit schedule, some falling just above and some just below $2 ML of R&D wages was too small to find good matches to compare the treatment effect of both types of firm. 5. Measuring effectiveness of R&D To evaluate the effectiveness of the whole R&D tax incentive program we compare the present situation with a fictive scenario where the government changes part of the R&D tax incentive scheme. In the absence of a proper cost-benefit calculation, including all indirect costs and benefits related to such a program (administration costs, opportunity costs and externalities), the usual way to assess the effectiveness of R&D tax incentives consists in computing the so-called “bang for the buck” (BFTB). By that is meant how much private R&D increases per dollar of R&D tax receipts foregone. If it is greater than 1, R&D tax incentives are considered to be effective in stimulating additional R&D; a value smaller than 1 means that part of the money received from tax incentives substitutes for private financing. We start from an old scenario where firms invest in R&D every year to keep the R&D stock constant and/or to expand that stock. In the new scenario the government decides to increase the tax incentives, which leads to a decrease in the user cost of R&D and to increases in the R&D stock of knowledge until a new desired R&D stock is reached. As firms invest more in R&D, government needs to spend more on R&D tax incentives. In. 19.
(23) table 5 we describe the evolution of the flows and stocks of R&D before and after the change in R&D tax credits (the stocks and flows in the new scenario are denoted by ~). In principle, given our assumed partial adjustment process, it takes until infinity to reach the new steady state, but in practice the new optimal stock is reached after 15 to 20 years.. Table 5. Trajectory of R&D flows and stocks under two scenarios Old scenario periods. R&D flow. R&D stock. 0. R0. K0. 1. R1 = δK 0 + ( K1 − K 0 ). K1. 2. R2 = δK1 + ( K 2 − K1 ). K2. 3. R3 = δK 2 + ( K 3 − K 2 ). K3. 4 t. .. .. Rt = δK t −1 + ( K t − K t −1 ). Kt. New scenario (after a change in the R&D tax credits) R&D flow R&D stock. R0 ~ ~ R1 = δK 0 + ( K1 − K 0 ) ~ ~ ~ ~ R2 = δK1 + ( K 2 − K1 ) ~ ~ ~ ~ R3 = δK 2 + ( K 3 − K 2 ) .. ~ ~ ~ ~ Rt = δK t −1 + ( K t − K t −1 ). ~ K2 ~ K3. K0 ~ K1 = K1 + (∂K1 / ∂u1R )Δu1R ~ = K1 + ( K 2 − K1 ) + (∂K 2 / ∂u1R )Δu1R ~ = K 2 + ( K 3 − K 2 ) + (∂K 3 / ∂u1R )Δu1R .. ~ ~ K t = K t −1 + ( K t − K t −1 ) + (∂K t / ∂u1R )Δu1R. Notes: The derivative ∂K j / ∂u R represents the change in desired R&D stock that occurs j-1 periods after the change in the user cost of R&D caused by a change in the tax incentives in period 0 ( Δu R ). For simplicity, here the firm subscript i has been omitted. 0. To find out how much R&D arises from an R&D tax incentive scheme, we have to compute the differences in R&D flows (or expenditures) from period 1 onwards till infinity between the two scenarios, where the flows of each additional year are discounted by 1/(1+r) vis-à-vis the previous year. This in our particular model is equal to12. ∞ ⎡ ∂K i ,t −1 ⎞ ∂K it ⎤ 0 ⎛ ∂K i1 ~ t −1 ⎟+ − + = + ... + ( R R ) /( 1 r ) ⎢δ ⎜⎜ ⎥ Δu Ri ∑∑ ∑∑ it it ∂u R ⎟⎠ ∂u R ⎦ i t =1 i t =1 ⎣ ⎝ ∂u R ∞. 12. (1 + r )t −1. (10). See Lokshin-Mohnen (2007) for a detailed derivation of (10).. 20.
(24) where. ~ ∂K it t −1 K it = −σλ (1 − λ ) , u Ri ,t ∂u Ri. (11). where − σλ is the estimated short-run user cost elasticity of R&D stock in the first period, λ is the estimated partial adjustment coefficient, δ is the depreciation rate of the R&D stock, taken to be 15%, r is the risk-free interest rate, taken to be on average 3%, and where the user cost elasticity, common to all firms of a given size class and constant over time, is converted to a marginal effect for period t using the optimal R&D stock and the user cost of R&D of period t.. For every dollar of private R&D expenditure the government supports a fraction of it by giving tax incentives in proportion to the wage and salary costs for researchers, the fraction of R&D carried out by a public research centre, the fraction carried out in a research consortium, the fraction of pre-competitive research, or the increments of R&D with respect to a base year. Let us denote the fraction of the private R&D so supported by the tax incentive program for firm i at year t by γ 1 Rit + γ 2 ΔRit , where γ 1 is the R&D tax credit rate in proportion of the level of R&D and γ 2 the rate in proportion of the increase in R&D. Appendix A explains in detail the various rates that apply in Quebec. Table A.1 lists for every year the average user cost of R&D, the B-index and its components, and what the user cost of R&D would be without the R&D tax credit. The total cost to the government to support the R&D tax credit program is given by ∞. ~. ∑ (W t =1. t. ∞ ~ ~ − Wt ) /(1 + r ) t −1 = ∑∑ [(γ 1 Rit + γ 2 ΔRit ) − (γ 1 Rit + γ 2 ΔRit )] /(1 + r ) t −1 . i. (12). t. 21.
(25) The BFTB is given by the ratio of (10) and (12). In other words, we compute the ratio of the increases in R&D for all the firms along the entire trajectories towards their new steady states to the saving in government costs to support R&D along those trajectories, both appropriately discounted13. In our computation of the BFTB we use size-class specific short and long-run estimated price elasticities reported in section 4. We use two size classes: small firms with fewer than 250 employees, and large firms with 250 and more employees. We report each time the BFTB computed for all firms with the specificities in the tax scheme that pertain to them and with their own price elasticities. We also report the BFTB separately for small and large firms. We run the following two experiments. In the first we increase the level-based provincial tax incentives ( γ 1 ) by 10% (all rates appearing in PL and PO are increased by 10%), in the other we increase the increment-based provincial R&D tax credit ( γ 2 ) by 10%. The result of the first experiment is plotted in fig. 1. For small firms the BFTB, i.e. the ratio of cumulative additional R&D to cumulative government expenses to support R&D, starts at a value much higher than one and slowly drops to a value that stays above 1 even after 20 years. Hence for small firms it is beneficial to support R&D by tax incentives. More R&D gets created than it costs the government to support it even after 20 years. For large firms, however, the BFTB starts at 3 but falls below 1. Already after seven years the cumulative additional R&D no longer covers the cumulative government costs to support this R&D. If we take all the firms in our sample, the BFTB falls below the bar of one after 13 periods. Thus if we consider the whole adjustment towards a new steady state, the level-based R&D tax incentives do not come out as very effective. The reason for this ineffectiveness is that level-based tax incentives contain a deadweight loss, namely the tax support on the R&D that would be done in the absence of all support. The importance of the deadweight can be computed by rewriting (12) as. 13. Because of the unbalanced nature of our sample, t0 is different for every firm. We take it to be the last year a firm is observed in the sample. In the simulation for the removal of the incremental R&D tax credit, we take as the reference year the last year this tax credit was in effect.. 22.
(26) ∞. ~. ∑∑ [γ~ ( R. it. 1. i. ~ − Rit ) + (γ~1 − γ 1 ) Rit + γ~2 (ΔRit − ΔRit ) + (γ~2 − γ 2 )ΔRit ] /(1 + r ) t −1 .. (13). t. The second term represents the deadweight loss connected to a change in the level-based R&D tax credit. In percentage of the total, the deadweight loss converges to 68% for small firms and to 82% for large firms. In the second experiment we increase only the incremental based R&D tax credit by 10%, i.e. the rate appearing in PI. In this case, there can also be a deadweight loss, the fourth term in (13), to the extent that we do not start from an initial steady state but that some R&D investment was already planned before the tax change. However, this deadweight loss is likely to be small. By simulating the effect of the tax change on R&D and government support for R&D for a period of 20 years, we find that the bang for the buck is about 2.98 for small firms and 2.79 for large firms. The incremental R&D tax credit is much more effective than the level based tax credit, and its effectiveness does not vary very much by firm size.. Figure 1 Evolution of the bang for the buck when increasing by 10% the level-based provincial rate of R&D tax credit. Mean BFTB. Mean of BFTB 7 6 5 4 3 2 1 0 1. 2. 3. 4. 5. 6. 7. 8. 9. 10. 11 12 13 14 15. 16 17 18 19 20. years after the change in R&D tax credit All firms. Large firms. Small firms. 23.
(27) 6. Conclusion In this paper we evaluate the effectiveness of R&D tax incentives in Quebec, using manufacturing firm data originating from R&D surveys, annual surveys of manufactures and administrative data. The data cover the years 1997 to 2003. We estimate the price responsiveness of R&D from a factor demand model for R&D with partial adjustment towards the steady state. From the estimated price elasticities we compute the bang for the buck for changes in the level-based and in the increment-based provincial R&D tax credits. We are especially interested in comparing the effectiveness of R&D tax incentives for small and large firms. Small firms in Quebec are slightly more responsive than large firms to price changes in the user cost of R&D driven by various kinds of tax credits aimed at stimulating R&D. Their estimated price elasticity of R&D investment is 0.14 in the short run and 0.19 in the long run (in absolute value). The estimated short-run elasticities are in line with those estimated by Bernstein (1986), 0.13, and Dagenais, Mohnen, Therrien (2002), 0.07, for Canada. The long-run elasticities are larger in those studies (0.30 and 1.09 resp.) because of a faster estimated adjustment speed. Our estimated bang for the buck differs sizeably from those estimated by Hall (1993) and Mairesse and Mulkay (2004) on US and French data respectively. Apart from possible differences in modeling and in the definition of the bang for the buck, the main reason for their much higher estimated effectiveness ratios (above 2) is likely to be due to the exclusive use of incremental R&D tax credits in France (until recently) and the United States. Our results on the differences between small and large firms regarding their sensitivities to R&D tax credits confirm the results on Dutch firms reported in Lokshin and Mohnen (2007). We show that there is a deadweight loss associated with level-based R&D tax incentives that is particularly acute for large firms. For small firms it is not sizeable enough to overcome the R&D additionality, at least not during quite a number of years after the 24.
(28) initial tax change. Incremental R&D tax credits do not suffer from this deadweight loss and are from that perspective preferable to level-based tax incentives. If it wants to run an efficient fiscal policy in support of R&D, the province of Quebec would be advised to continue using both the incremental R&D tax credit and the levelbased tax credits in favour of small firms. It is precisely small firms that have difficulty in getting outside financing for their R&D efforts. Of course, effectiveness is not the only nor the ultimate goal in giving R&D tax credits. An important consideration is the social rate of return on tax-supported R&D. It would be interesting in future work to compare the social returns on government supported R&D via tax credits and direct subsidies, on government supported and non-supported R&D, and on R&D support for large and small firms.. 25.
(29) References. Bernstein, J.I. (1986), The Effect of Direct and Indirect Tax Incentives on Canadian Industrial R&D Expenditures. Canadian Public Policy, XII, 438-448. Bloom, N., R. Griffith and J. Van Reenen (2002), Do R&D Credits Work? Evidence From A Panel Of Countries 1979-97, Journal of Public Economics, 85, 1-31. Brouwer, E., den Hertog, P., Poot, T., Segers, J. (2002), WBSO nader beschouwd. Onderzoek naar de effectiviteit van de WBSO, Opdracht van het Ministerie van Economische Zaken, DG Innovatie. Cappelen, Adne, Arvid Raknerud and Marina Rybalka (2008), “The effects of R&D tax credits on patenting and innovation”, mimeo Chirinko, R., Fazzari, S.M., Meyer, A.P., (1999), “How responsive is business capital formation to its user cost? An exploration with micro data”, Journal of Public Economics, 74, 53-80. Corchuelo Martínez-Azúa, Beatriz and Ester Martínez-Ros (2008), “The effects of fiscal incentives for R&D in Spain”, mimeo Czarnitzki, D., P. Hanel and J. Rosa (2004), ”Evaluating the impact of R&D tax credit on innovation: A microeconometric study on Canadian firms”, ZEW discussion paper 04-77. Dagenais, M., P. Mohnen and P. Therrien (2004), « Les firmes canadiennes répondentelles aux incitations fiscales à la recherche-développement? », Actualité Économique, 80(2/3), 175-206. De Jong, J.P.J. and W.H.J. Verhoeven (2007), Evaluatierapport WBSO 2001-2005: Effecten, doelgroepbereik en uitvoering, EIM and UNU-MERIT. Department of Finance Canada and Revenue (1997), The Federal System of Income Tax Incentives for Scientific Research and Experimental Development – Evaluation Report, Ottawa. Duguet, E. (2007), “L’effet du crédit d’impôt recherche sur le financement privé de la recherche: une évaluation économétrique”, mimeo Fazzari, S. M., R. G. Hubbard and B.C. Petersen (1988), « Financing constraints and corporate investment », Brookings Papers on Economic Activity 1, 141-195. Finance Canada (2007), Tax Expenditures and Evaluations 2006. Ottawa. Grégoire, P.E. (1992), Compte rendu de l’enquête sur la perception des mesures fiscales en R-D. Ministère de l’Industrie, Commerce et Technologie, Québec.. 26.
(30) Haegeland, T. and J. Moen (2007), “Input additionality in the Norwegian R&D tax credit scheme”, reports 2007/47, Statistics Norway 2007 Hall, B. (1993), R&D tax policy during the eighties: success or failure? Tax Policy and the Economy 7, 1-36. Hall, B. and J. van Reenen (2000), “How effective are fiscal incentives for R&D? A review of the evidence”, Research Policy, 29, 449-469. Klette, T., J., Griliches, Z. (1996). The inconsistency of common scale estimators when output prices are unobserved and endogenous. Journal of Applied Econometrics 11, 343– 361. Lebeau, D. (1996), Les mesures d’aide fiscale à la R-D et les entreprises québécoises. Conseil de la science et de la technologie du Québec. Lokshin, Boris and Pierre Mohnen (2007), “Measuring the effectiveness of R&D tax credits in the Netherlands”, UNU-MERIT working paper #2007-025. Mairesse J. and B. Mulkay, 2004. "Une évaluation du crédit d’impôt recherche en France, 1980-1997", Revue d’Economie Politique, 114 (6), 747-778. McFetridge, D.G. and J.P. Warda (1983), Canadian R&D Incentives: Their Adequacy and Impact. Canadian Tax Paper No. 70, Canadian Tax Foundation, Toronto. Ministère des Finances du Quebec (1999), An Integrated Fiscal Strategy for the Knowledge-Based Economy, Bibliothèque nationale du Québec. Ministère des Finances du Quebec (2005), Tax Expenditures, Bibliothèque nationale du Québec. Mohnen, P. (2000), « R&D tax incentives : Issues and evidence », in The Political Economy of Industrial Policy in Europe and the Member States, Damien Neven and LarsHendrik Röller (eds.). Berlin : Ed. Sigma, pp.183-199. Nadiri, M.I. and S. Rosen, 1969. Interrelated factor demand functions. American Economic Review, 79 (4), 674-689. OECD (2002), Frascati Manual 2002: Proposed Standard Practice for Surveys on Research and Experimental Development, OECD. Parsons, M. and N. Phillips (2007), “An evaluation of the Federal tax credit for scientific research and experimental development”, Department of Finance, working paper 200708.. 27.
(31) Stock, J.H. and M. Yogo (2002), “Testing for weak instruments in linear IV regression”, prepared for Festschrift in honor of Thomas Rotemberg, NBER Technical working paper 284. Warda, J. (2002), “Measuring the value of R&D tax treatments in OECD countries”, STI Review, 27, 185-211.. 28.
(32) Appendix: Construction of the user cost of R&D. The user cost of R&D is given by u Ri = p R (r + δ ) Bit , where p R is the R&D deflator, r is the opportunity cost of funds, δ is the R&D depreciation rate, and B is the B-index given by:. Bit =. 1 [1 − PLi ,t − POi,t − PI i,t − FCi,t − PDi,t − FDi,t ] 1−τ. where PLi ,t , POi ,t , PI i ,t , FCi ,t , PDi ,t , FDi ,t are defined as follows:. PL: Quebec’s SR&ED tax credit and superdeductions for salaries and wages For small firms (assets < 25 000 000). ⎧⎪ ⎛ Rp ⎞ ⎛ Rp ⎞ PLi,t = wiL,t ⎨min⎜ L ,1⎟ (1− D1i,t )c1pL,t + D1i,t s1L,tτ p,t +1R <wL R ⎜1− L ⎟ (1− D1i,t )c2pL,t + D1i,t sL2,tτ p,t ⎟ p i ,t i ,t ⎜ ⎪⎩ ⎜⎝ wi,t Ri,t ⎟⎠ ⎝ wi,t Ri,t ⎠. [. ]. [. ⎫. ]⎪⎬ ⎪⎭. For medium sized firms (25 000 000 < assets < 50 000 000) ⎫⎪ ⎧⎪ ⎛ Rp ⎞ ⎛ Rp ⎞ PLi,t = wiL,t ⎨min⎜ L ,1⎟ (1− D1i,t )c1pL,1,t + D1i,t s1pL,1,tτ p,t +1R <wL R ⎜1− L ⎟ (1− D1i,t )c2pL,t + D1i,t s2pL,tτ p,t ⎬ ⎟ p i ,t i ,t ⎜ ⎪⎭ ⎪⎩ ⎜⎝ wi,t Ri,t ⎟⎠ ⎝ wi,t Ri,t ⎠ where,. [. ]. [. ]. ⎡ ( Asset i ,t − 25000000)(c 1pL ,t − c 2pL ,t ) ⎤ c 1pL,1 ,t = c 1pL ,t − ⎢ ⎥ ; 25000000 ⎢⎣ ⎥⎦ ⎡ ( Asseti ,t − 25000000)( s1pL ,t − s 2pL ,t ) ⎤ s1pL,1 ,t = s1pL ,t − ⎢ ⎥ 25000000 ⎣⎢ ⎦⎥. For large firms (assets > 50 000 000). [. PLi ,t = wiL,t (1 − D1i ,t )c 2pL ,t + D1i ,t s L2,tτ p ,t. ]. PO: Quebec’s tax credits and superdeductions for university research, pre-competitive research and consortium research. 29.
(33) [. Pr Co E POi ,t = (.8wiUn , t + wi , t + wi , t − si , t ) (1 − D2 i , t )c pO , t + D2 i , t s pO , tτ p , t. ]. This holds for small as well as for large firms. In the case of tax credit and superdeductions for university research, eligible expenditures are fixed at 80% of the value of sub-contracted work. PI: Quebec’s incremental tax credit. [. ]{. PIi ,t = (1 − D3i ,t )c pI ,t + D3i s pI ,tτ p,t (1 − wiB,t ) −. [ ∑ (1 − w 1 n. n. 1. B i ,t −n. ) /(1 + r ) n. ]}. FC: Federal SR&ED tax credit Small firms (assets < 25 000 000) ⎡ ⎛ ⎤ ⎞ Rf ,1⎟⎟c1f ,t + ⎢min⎜⎜ C ⎥ E E ⎥ ⎝ (wi,t + wi,t − PLi,t − POi,t − PIi,t − si,t )Ri,t ⎠ C E E ⎢ FCi,t = (wi,t + wi,t − PLi,t − POi,t − PIi,t − si,t )⎢ ⎥ ⎛ ⎞ 2 ⎥ Rf ⎢1 ⎜1 − ⎟c ⎢ Rf <(wiC,t +wiE,t −PLi ,t −POi ,t −PIi ,t −siE,t ) Ri ,t ⎜ (wC + wE − PL − PO − PI − s E )R ⎟ f ,t ⎥ i ,t i ,t i ,t i ,t i ,t i ,t i ,t ⎠ ⎝ ⎣ ⎦. For federal SR&ED tax credit, eligible expenditures are current R&D expenditures and machinery and equipment expenditures. Medium sized firms : 25 000 000 < assets < 50 000 000 ⎡ ⎛ ⎤ ⎞ Rf ,1⎟⎟c1f,1,t + ⎢min⎜⎜ C ⎥ E E ⎥ ⎝ (wi,t + wi,t − PLi,t − POi,t − PIi,t − si,t )Ri,t ⎠ C E E ⎢ FCi,t = (wi,t + wi,t − PLi,t − POi,t − PIi,t − si,t )⎢ ⎥ ⎛ ⎞ 2 ⎥ Rf ⎢1 ⎜1− ⎟c ⎢ Rf <(wiC,t +wiE,t −PLi ,t −POi ,t −PIi ,t −siE,t ) Ri ,t ⎜ (wC + wE − PL − PO − PI − sE )R ⎟ f ,t ⎥ i,t i ,t i ,t i ,t i,t i,t i,t ⎠ ⎝ ⎣ ⎦. where, ⎡ ( Asseti ,t − 25000000)(c1f ,t − c 2f ,t ) ⎤ c1f,1,t = c1f ,t − ⎢ ⎥; 25000000 ⎣⎢ ⎦⎥. 30.
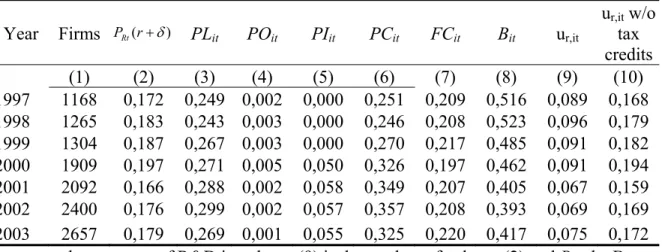
(34) Large firms ( assets > 50 000 000) FCi ,t = ( wiC,t + wiE,t − PLi ,t − POi ,t − PI i ,t − siE,t )c 2f ,t ;. PD : Quebec’s R&D expensing PDi ,t = ( wiC,t + wiE,tθz E + wiB,t z B − FCi ,t − siE,t )τ p ,t ;. FD : Federal R&D expensing FDi ,t = ( wiC,t + wiE,t z E + wiB,t z B − FCi ,t − PLi ,t − POi ,t − PI i ,t − siE,t )τ f ,t. We assume that all firms are profitable, i.e. that they are able to take full advantage of all R&D tax credits and deductions. PLi ,t , POi ,t and PI i ,t are obtained not by the above formulas but by dividing the observed tax credit payments corresponding to these items by the corresponding R&D. FCi ,t is computed using the statutory tax credit rates as in the above formula. Table A1 decomposes the user cost of R&D into its various components. All symbols and some key parameter values are given in table A2.. Table A1. Annual average user cost of R&D, 1997-2003 (All firms). ur,it w/o tax credits (1) (2) (3) (4) (5) (6) (7) (8) (9) (10) 1997 1168 0,172 0,249 0,002 0,000 0,251 0,209 0,516 0,089 0,168 1998 1265 0,183 0,243 0,003 0,000 0,246 0,208 0,523 0,096 0,179 1999 1304 0,187 0,267 0,003 0,000 0,270 0,217 0,485 0,091 0,182 2000 1909 0,197 0,271 0,005 0,050 0,326 0,197 0,462 0,091 0,194 2001 2092 0,166 0,288 0,002 0,058 0,349 0,207 0,405 0,067 0,159 2002 2400 0,176 0,299 0,002 0,057 0,357 0,208 0,393 0,069 0,169 2003 2657 0,179 0,269 0,001 0,055 0,325 0,220 0,417 0,075 0,172 Note: ur,it, the user cost of R&D in column (9) is the product of column (2) and Bit, the Bindex in column (8). PLit, POit, PIit, FCit and the Bit are described above. PCit in column (6) is the sum of columns (3) to (5), i.e. all forms of R&D tax credits in Quebec. Column (10) is the user cost of R&D without provincial and federal R&D tax credits. Year. Firms PRt (r + δ ). PLit. POit. PIit. PCit. FCit. Bit. ur,it. 31.
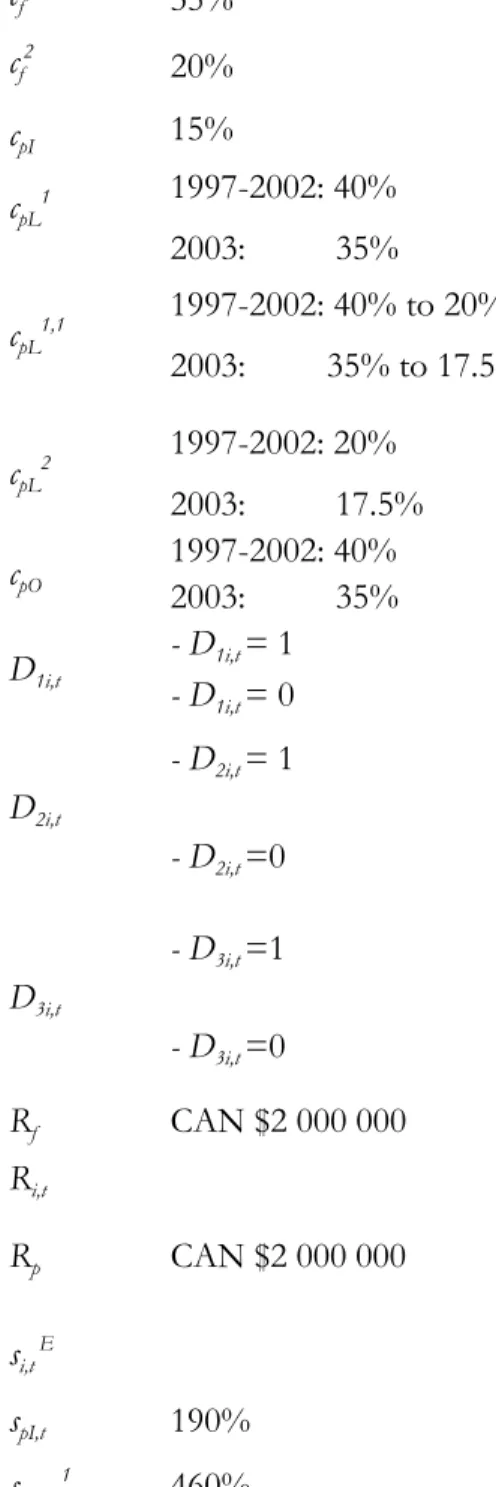
(35) Table A2. Symbols and some parameter values* Variable Value. Description. Asseti,t. Asset of firm i in year t ;. 1. 35%. First bracket rate for federal SR&ED tax credit;. cf2. 20%. Second bracket rate for federal SR&ED tax credit;. cpI. 15%. Quebec' s incremental R&D tax credit rate;. 1997-2002: 40%. First bracket rate for Quebec's salaries of researchers tax credit;. cf. cpL1 cpL1,1. cpL2 cpO D1i,t. 2003:. 35%. 1997-2002: 40% to 20% 2003:. 35% to 17.5%. 1997-2002: 20% 2003: 17.5% 1997-2002: 40% 2003: 35% - D1i,t = 1 - D1i,t = 0 - D2i,t = 1. D2i,t - D2i,t =0. Quebec's tax credit rate for university research, precompetitive research and dues paid to consortium -R&D performer claimed superdeduction for salaries -R&D performer claimed tax credit for salaries -R&D performer claimed superdeduction for university, precompetitive or consortium research -R&D performer claimed tax credit for university, precompetitive or consortium research. - D3i,t =0 CAN $2 000 000. First bracket ceiling for federal SR&ED tax credit;. D3i,t. Total R&D spending of firm i in year t;. Ri,t Rp. Second bracket rate for Quebec' s salaries of researchers tax credit;. -R&D performer claimed superdeduction based on the increase in R&D expenditures -R&D performer claimed tax credit based on the increase in R&D expenditures. - D3i,t =1. Rf. First bracket variable rate for Quebec's salaries of researchers tax credit applying to firms with assets between CAN $25 000 000 and CAN $50 000 000;. CAN $2 000 000. First bracket ceiling for Quebec’s salaries of researchers 'tax credit;. spI,t. 190%. Proportion of Quebec' s subsidies for equipment in total R&D of firm i in year t Quebec's superdeduction incremental rate. spL,,t 1. 460%. First bracket rate for Quebec' s superdeduction for. si,t E. 32.
(36) Variable Value. spL,,t 1,1. between 460% and 230%. spL,,t 2. 230%. spO,,t. 460%. θ τf τp τ Wi,tB Wi,tC Wi,tCo Wi,tE Wi,tL Wi,tPr Wi,tUn zB. zE *. **. **. Applied in 1999: 125% SMEs: 22,12%** Large firms: 22,12% SME’s: 8,90%*** Large firms: 8,90%. Description salaries and wages; First bracket variable rate for Quebec' s superdeduction for salaries and wages applying to firms with assets between CAN $25 ML and 50 ML ; Second bracket rate for Quebec' s superdeduction for salaries and wages; Quebec' s superdeduction for university, pre-competitive and consortium research; Depreciation deduction rate of the acquisition costs of machinery and equipment Federal corporate income tax rate. Quebec's corporate income tax rate. Combined federal and province of Quebec corporate income tax rate Proportion of land and building expenses in total R&D; Proportion of current R& D expenditure in total R&D; Proportion of dues paid to a research consortium; Proportion of machinery and equipment expenses in total R& D; Proportion of labor costs in total R&D; Proportion of precompetitive research project expenses; Proportion of university research contract expenses; Present value of depreciation of R&D building Present value of depreciation of R&D machinery and equipment The values of the variables given in the table are limited to the study period i.e., for the years 1997 to 2003. The subscripts i and t represent the firm and time, respectively. For the years 1997 to 2002, a federal corporate income tax rate of 13.12% applied to the first CAN $ 200 000 of the taxable income of SME’s. In 2003, the ceiling of CAN $ 200 000 was raised to CAN $ 225 000. For the years 1997 and 1998, a Quebec,s corporate income tax rate of 5.75% applied to the first CAN $ 400 000 of the taxable income of SME’s. τf +τp. 33.
(37)
Figure


+5


Documents relatifs
The current (draft) Statement does not deal with the decision to opt, at EU level, for a super deduction or for a tax credit. It only addresses the more general and
If the incumbent degree of altruism in a society is 2 A , then D ( ) d is the marginal e¤ect of a slight increase in a mutant’s degree of altruism, from to + d , on its child’s
These scientific practices which are defined, mobilized, exchanged and negotiated through time and space by the suc- cessive alliances built between the different
Effect of R&D Tax Credit on the cost-metrics of cloud computing: A case study from France.. Forty-Sixth Annual Hawaii International Conference on System Sciences, Jan 2013,
Exiting period conditional on working in period 20 Tobit (2) Exiting period Tobit (3) Baseline treatment Fixed II treatment Random II Treatment Random II treatment *
In this case, career concerns lower the amount of explicit incentive compensation necessary to induce managers to use their discretion productively; the principal takes advantage of
The main objective of this work is to verify whether the dimensions of the SERVQUAL tool are adequate or enough to evaluate the quality of service of a small
Direct and indirect financial incentives are well studied by public choices theorists in urban economics; non-financial incentives are considered in some forms of planning
