HAL Id: tel-02968839
https://tel.archives-ouvertes.fr/tel-02968839
Submitted on 16 Oct 2020HAL is a multi-disciplinary open access archive for the deposit and dissemination of sci-entific research documents, whether they are pub-lished or not. The documents may come from teaching and research institutions in France or abroad, or from public or private research centers.
L’archive ouverte pluridisciplinaire HAL, est destinée au dépôt et à la diffusion de documents scientifiques de niveau recherche, publiés ou non, émanant des établissements d’enseignement et de recherche français ou étrangers, des laboratoires publics ou privés.
Tracheal Sounds in the Context of Implanted Phrenic
Nerve Stimulation
Xinyue Lu
To cite this version:
Xinyue Lu. Cardiorespiratory Monitoring by Microphone via Tracheal Sounds in the Context of Im-planted Phrenic Nerve Stimulation. Micro and nanotechnologies/Microelectronics. Université Mont-pellier, 2020. English. �NNT : 2020MONTS011�. �tel-02968839�
UNIVERSITY OF MONTPELLIER
In Automatic and Microelectronic Systems Doctoral School: I2S (Information Systems Structures)
Research unit: NeuroResp, LIRMM, INRIA-CAMIN, UMRS1158, Sorbonne University
Cardiorespiratory Monitoring by Microphone via Tracheal Sounds
in the Context of Implanted Phrenic Nerve Stimulation
Prensented by LU Xinyue on March 23, 2020
Under the direction of [Christine AZEVEDO COSTE] and [Thomas SIMILOWSKI]
Before the jury composed of
Thomas PENZEL Professor University of Charite Reporter Norbert NOURY Professor University of Lyon1 Reporter Julie FONTECAVE-JALLON Lecturer University of Grenoble-Alpes Examiner Phillipe FRAISSE Professor University of Montpellier President of jury Christine AZEVEDO Research director INRIA-CAMIN Thesis director David GUIRAUD Research director INRIA-CAMIN Invited
INTRODUCTION 1 1 General introduction 3 1.1 Physiology introduction . . . 3 1.1.1 Electrophysiology . . . 3 1.1.2 Respiratory system . . . 5 1.1.3 Cardiac system . . . 8 1.2 Respiratory paralysis . . . 12
1.2.1 High spinal cord injury . . . 12
1.2.2 The Ondine syndrome . . . 12
1.2.3 Treatments . . . 13
1.3 The diaphragm pacing . . . 13
1.3.1 History . . . 13
1.3.2 Diaphragm pacing technique . . . 14
1.3.3 AtroStim . . . 17
1.3.4 Aim of thesis: diaphragm pacing (DP) in close loop . . . 18
1.4 Clinic cardiorespiratory monitoring . . . 21
1.4.1 Ventilation measurement . . . 22
1.4.2 Respiratory effort evaluation . . . 23
1.4.3 Cardiac diagnostic: electrocardiogram (ECG) and
phonocardiogra-phy (PCG) . . . 24
1.4.4 Other measurements . . . 26
1.4.5 Polysomnography and polygraphy . . . 26
1.4.6 Examples of characterizations of abnormal respiratory events . . . . 27
1.5 Respiratory detection from tracheal sounds (TS) . . . 29
1.5.1 Method selection . . . 29
1.5.2 Respiratory sounds . . . 30
1.5.3 The historical context of TS processing . . . 30
1.5.4 ECG-derived respiration (EDR) and Phonocardiogarm-derived de-termination of respiratory rhythm (PDR) . . . 34
2 Experimental setup and data acquisition 36 2.1 Experimental setup . . . 36
2.1.1 Microphone and support . . . 36
2.1.2 Analog card . . . 37
2.1.3 Signal acquisition . . . 37
2.1.4 Protocols . . . 38
2.2 Preliminary data analysis for system specification . . . 42
2.2.1 Recordings on healthy subjects with portable data acquisition card 42 2.2.2 Recordings on high tetraplegia under intra-thoracic phrenic nerve stimulation (IT-PNS) . . . 43
2.2.3 Recordings on healthy subjects with high precision acquisition in-strument and reference signals . . . 46
3 Algorithm for respiratory detection from tracheal sounds 47 3.1 Algorithm for pilot protocol . . . 47 3.2 Improved breathing detection algorithm for clinic protocol on healthy subjects 47
3.2.1 Speech detection . . . 48
3.2.2 Frequency band separation . . . 48
3.2.3 Temporal envelope detection . . . 49
3.2.4 Frequency detection . . . 51 3.2.5 PDR detection . . . 51 3.2.6 Decision-making . . . 54 3.2.7 Statistics . . . 56 4 Results 57 4.1 Evaluation method . . . 57
4.2 Detection result for pilot protocol on healthy subjects (protocol 1) . . . 58
4.3 Detection result for pilot protocol on patient under IT-PNS system (protocol 2) . . . 59
4.4 Detection result for clinic protocol on healthy subject with reference signal (Protocol 3) . . . 60
4.4.1 Apnoea detection . . . 60
4.4.2 Respiratory event detection . . . 60
4.4.3 Influence of speech and noise . . . 61
4.4.4 Influence of position . . . 62
4.4.5 Advantage of combining several detection domains . . . 62
4.4.6 Cardiac sound processing . . . 63
5 Discussion and Conclusion 69 5.1 Performance of algorithm . . . 69
5.2 Method PDR . . . 70
5.3 Cardiac peak envelogram . . . 70
5.5 Conclusion . . . 72
Appendix A Analog card design 75
Appendix B Abstract of the protocol description submitted to the ethical
committee (Comité de Protection des Personnes CPP) 78
1.1 Nervous system. . . 4
1.2 Neuron structure. . . 4
1.3 The spinal pathway during respiration. . . 5
1.4 The resting potential. . . 5
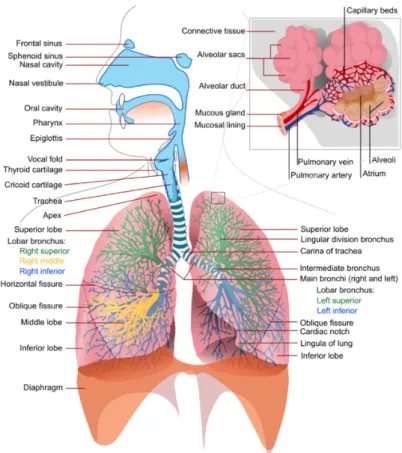
1.5 The structure of respiratory system. . . 6
1.6 Respiratory muscle organization. . . 6
1.7 Inspiration and expiration. . . 7
1.8 Breathing rate control. . . 8
1.9 Diagram of respiratory regulation. . . 9
1.10 Heart anatomy. . . 9
1.11 Blood circulation between heart, lungs and other body tissues. . . 10
1.12 General structure of implanted DP system. . . 14
1.13 The IT-PNS stimulator – Mark IV Breathing Pacemaker R. . . . 14
1.14 The intra-diaphragmatic phrenic nerve stimulation (ID-PNS) stimulator – NeurRxDP4 R [15]. . . . 15
1.15 The trans-venous phrenic nerve stimulation (TV-PNS) stimulator – remed¯e R [15]. . . 16
1.16 Structure of the AtroStim R. . . . 17
1.17 Sending stimulation information by radiofrequency communication – AtroStim R. 18 1.18 Stimulation procedure. . . 19
1.19 Stimulation signal of AtroStim R. . . . 19
1.20 Obstructive apnea because of airway collapse in sleeping. . . 19
1.21 The pneumotachograph. . . 22
1.22 The nasal cannula. . . 22
1.23 The inductance plethysmography. . . 22
1.24 The thermistor SleepStrip R. . . . 24
1.25 The esophageal pressure [28]. . . 24
1.26 Relationship between the onset and duration of action potentials of cardiac cells during an isolated cardiac cycle and corresponding ECG pattern . . . 25
1.27 The four heart sounds in relation to various hemodynamic events and the ECG. [6]. . . 25
1.28 Example of polysomnography (PSG) signals showing some central sleep apnoea (CSA). . . 28
1.29 Example of PSG signals showing some Obstructive sleep apnoea (OSA). . . 28
1.30 Commercially available tracheal sounds sensors. . . 33
2.1 Illustration of the microphone setup. . . 36
2.2 Position of the microphones: two microphones are inserted into the support that is fixed at suprasternal notch with two strips of adhesive tape. . . 37
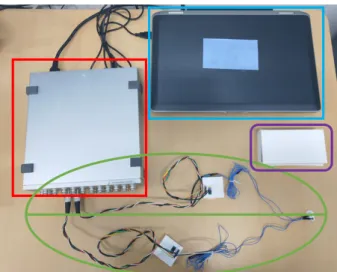
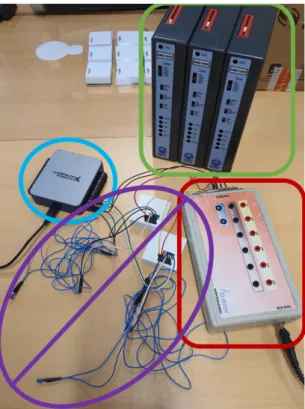
2.3 Materials of recording system. . . 38
2.4 Principle of protocol design. . . 38
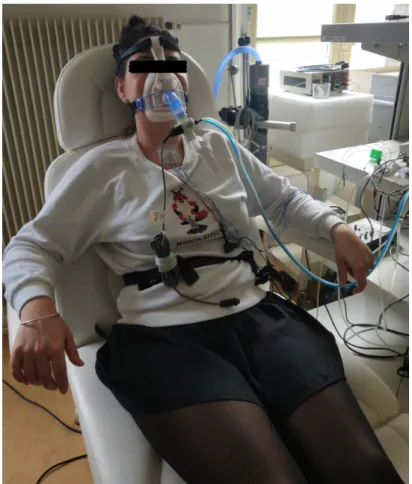
2.5 One participant was being taken recordings for protocol 3. . . 40
2.6 The spirometer for patients under IT-PNS. . . 41
2.7 Improved experimental setup for protocol 4. . . 42
2.8 Two recording examples from protocol 1 with their corresponding spectrogram. 43 2.9 Two recordings of patients with IT-PNS and with mechanical ventilation. . 44 2.10 The artifacts peaks come from stat "ON" sent by radiofrequency – 25 MHz. 44
2.11 One enlarged respiratory cycle under IT-PNS. . . 45 2.12 The placement of microphone for recordings under IT-PNS. . . 45 2.13 Recording examples of one subject in different positions for protocol 3.
Recording procedure: 0-60 s normal respiration (NR); 60-70 s apnea (holding breathing spontaneously, AP); 70-100 s normal respiration + speech (RS); 100-120 s normal respiration + environmental noise (RN). . . 46
3.1 Diagram of the detection algorithm. . . 48 3.2 Temporal and frequency detection result of the same period from the same
recording. A positive (resp. negative) pneumotachograph reference signal (purple) indicates inspiration (resp. expiration). The adaptive (pink) and minimum thresholds (gray) are marked in the figure. The envelop signal (temporal or PSD) is in blue and the final detection result is in red with
the peak "middle-timing moment". . . 50 3.3 Cardiac S peak detection. There is a small delay between the ECG (yellow)
and the extracted cardiac signal (blue). Predicting area PA(ncb) (purple) defined by ±20% of last heart beat-to-beat interval b_b(ncb − 1) and the adaptive threshold. The cardiac envelogram is in red and the detected cardiac peak (S1/S2) is marked by a green star. . . 53 3.4 Phonocardiogram-derived determination of respiratory rhythm. The
ex-tracted cardiac signal is shown in green, and the processed envelogram is in red. Only one cardiac peak (S1/S2) detected (pink star) for each cardiac cycle. Positive (Negative) of the PDR detection result (yellow) indicates the inspiration (expiration) as reference signal. . . 54 3.5 Final decision-making for apnea detection. The reference signal:
pneumota-chograph is in blue and the apnea detection signal is in red. Detection stat: 2 – Speech; 1.5 – Respiration; 0 – Pauses; -1 – apnea. . . 55 3.6 Final decision-making for respiratory event detection. Top: results from
temporal detection; Middle: results from frequency detection; Bottom: results from cardiac (PDR) detection. The final detected events are marked in purple dashed lines. . . 55
4.1 Example of respiratory event counting. Respiratory envelope (in blue), detection signal (in red). (a) If two continuous respiratory events are recog-nized as a single event, or the pause/apnoea is detected as one respiratory event, a false positive detection will be reported; (b) If one respiratory event is recognized as two events, or one respiratory event is not detected, a false negative detection will be reported. . . 57 4.2 One example of detection result for a 30-seconds recording in protocol 1 . . 58 4.3 One example of detection result for a 30-seconds recording in protocol 1 . . 59 4.4 Detection result for the 30-seconds recording under IT-PNS . . . 59 4.5 Box plot for final respiratory detection result – The line and the cross inside
the box correspond to the median and the mean value, respectively. The box-limits represent the first and the third quartiles, the points highlight outliers, and the upper and lower bars represent the maximum and minimum values, respectively. Specificity: blue box; Sensitivity: orange box; Accuracy: gray box. . . 61 4.6 Influence of speech and noise on respiratory detection. Box plot (as box plot
of Fig. 4.5) for specificity (green and light gray boxes), sensitivity (orange and yellow boxes) and accuracy (dark gray and blue boxes) of temporal (T), frequency (F) and cardiac (C) detection domains, separated in NR+AP phases (in blue rectangular) and RS+RN phases (in green rectangular). . . 61 4.7 Box plot (like box plot of Fig. 4.5) for specificity (green rectangle), sensitivity
(purple rectangle) and accuracy (red rectangle) in sitting (orange boxes) and lying (blue boxes) positions. . . 62 4.8 Box plot (as box plot of Fig. 4.5) for specificity (blue), sensitivity (green)
and accuracy (orange) of temporal (T), frequency (F), cardiac (C) detection domains and global result (G). . . 63 4.9 PDR (green) processed from tracheal sounds and EDR (red) processed from
ECG and the thoracic strap signal (blue). Their positive (negative) slopes indicate inspiration (expiration). . . 64 4.10 Top: the EDR signal and its local maxima (peaks) iEDR; Middle: the
PDR signal and its local maxima iP DR; Bottom: the linear regression fit line between iEDR and iPDR (a = 0.98). . . 65
4.11 Top: the EDR signal and its local maxima (peaks) iEDR; Middle: the PDR signal and its local maxima iP DR; Bottom: the theory fit line(y=x) in red and the linear regression fit line between iEDR and iPDR (a = 0.68). 65 4.12 Box plot (like box plot of Fig. 4.5) for the evaluation of the results of PDR
according to EDR, separated into NR+AP (blue), RS+SN (orange) and
global results (gray). . . 66
4.13 Box plot (like box plot of Fig. 4.5) for the evaluation of the results of PDR according to EDR, separated in sitting (left) and lying (right) positions. . . 66
4.14 The left, middle and right figures show the linear regressions for NR+AP, RS+RN and the whole recording. The blue points are from the group of R-R vs. S1-S1 or S2-S2 (group 1, at the middle group of each figure), the orange points are from the group of R-R vs. S2-S1 (group 2, at the top of each figure), and the yellow points are from the group of R-R vs. S1-S2 (group 3, at the bottom of each figure). The slopes of each fit line are presented the in figure title (a1, a2 and a3 are slopes for the group 1, group 2 and group 3, respectively). . . 67
4.15 Box plot (like the box plot of Fig. 4.5) for the distribution of fit line slopes for each group in each part and the global signal (in different rectangle). . 68
5.1 The comparison of different envelogram methods [56]. . . 71
5.2 Envelogram obtained by wavelet decomposition (in red) modify amplitude of cardiac peaks (heart sounds in blue). . . 71
5.3 The schematic of the Wiener adaptive filter for noise reduction . . . 71
5.4 Noise reduction by Wiener filter. . . 72
A.1 principle schema Sallen & Key . . . 76
2.1 Information of the participants included in protocol 3: clinic protocol on
healthy subjects. . . 41
3.1 Temporal detection states . . . 49
3.2 Frequency detection stats. . . 51
3.3 Cardiac detection (PDR) stats. . . 53
4.1 Median values comparing for specificity, sensitivity and accuracy of each detection domain – NR+AP vs. RS+RN. . . 62
4.2 Median values comparing for specificity, sensitivity and accuracy – sitting vs. lying. . . 62
4.3 Median values comparing for specificity sensitivity and accuracy (SSA) of each detection domain – single detection domain v.s. combining detection domain. . . 63
AASM American Academy of Sleep Medicine AHI Apnoea-Hypopnoea Index
AM amplitude modulation CO2 carbon dioxide
CPAM primary Health Insurance Fund: Caisse primaire d’assurance maladie CSA central sleep apnoea
DP diaphragm pacing ECG electrocardiogram
EDR ECG-derived respiration EEG electroencephalography EMG electromyography EOG electro-oculography HAS Haute Autorité de Santé
HF-SCS high frequency spinal cord stimulation HRV heart rate variation
ICSD-2 international Classification of Sleep Disorders ID-PNS intra-diaphragmatic phrenic nerve stimulation IRP induction respiratory plethysmography
IT-PNS intra-thoracic phrenic nerve stimulation O2 oxygen
OSA Obstructive sleep apnoea
PaCO2 partial pressure of carbon dioxide
PaO2 partial pressure of oxygen
PCG phonocardiography
PDR Phonocardiogarm-derived determination of respiratory rhythm PSG polysomnography
PTT pulse transit time SaO2 oxygen saturation
SCI spinal cord injury
SSA specificity sensitivity and accuracy SSP suprasternal pressure
TS tracheal sounds
Individuals with a respiratory paralysis are essentially supplied by mechanical ventila-tion. However, severe drawbacks of mechanical ventilation were reported: low autonomy, high health costs, infection risk due to tracheotomy, etc. When patients’ phrenic nerves and diaphragms are still functional, implanted diaphragm pacing (DP) can provide them a more natural respiration. Compared to classic mechanical ventilation, implanted DP can cancel some of the disadvantages mentioned above, and can also help to significantly improve speech and recover some olfactory sensation because air passe through the nose and/or the mouth.
But existing implanted DP systems can not monitor patient’s induced respiration and they stimulate at constant intensity and frequency - they work in open-loop. It means that stimulation intensity, pulse width and frequency are fixed at the installation of the implant, updated at each control visit, but do not adapt to patient’s continuous situation evolution because of the absence of respiratory monitoring. To close the loop, an ambulatory respiratory monitoring solution needs to be developed. Adding adaptive abilities to existing systems would improve the efficiency of the delivered stimulation.
The gold standard for apnea/hypoventilation evaluation is the polygraph, which includes a pulse oximeter and at least one respiratory flow sensor . In a clinical use, flow sensors could be nasal cannula, pneumotachograph, thermistor or plethysmograph. But these sensors need to be placed over the face or are sensitive to patient’s movements. They are therefore not compatible with an implanted DP system which is portable and for a daily living use. With this in mind, this thesis investigated an acoustic method. The proposed tracheal sounds recording requires only one tiny support of microphones fixed on the neck with a support, which is the only physical contact with the patient.
Many previous studies have shown some positive results on apnoea detection from tracheal sounds in sleep apnea, especially for obstructive sleep apnea. Their detection algorithms are either based on the envelope of sound signals (in time domain) . Some groups also used statistical methods for respiratory phase detection and classification, and even for air flow estimation associated with sounds entropy or the log of the sounds
variance. But only few methods were developed for real-time applications (processing delay within seconds) with robustness requirements, indeed, all these studies have been carried out in quiet and controlled acoustic environments with stable sources of noises, and with limited movements of the subjects (during sleep).
The present thesis aims at a real-time and continuous breath and heart beats detection (day and night), even during wakefulness in noisy environments. The recorded tracheal sounds contain not only respiratory sounds, but also heart beats sounds (PCG) so that some basic cardiac information, as cardiac rhythm, could be calculated. Furthermore, inspired by ECG-derived respiration, the similar method could also be applied on PCG to get respiratory information. We proposed a new algorithm to detect respiration phases, by combining the signal processing both in the temporal (envelope and PCG-derived respiration) and the frequency domains. We assessed the performances of the algorithm in emulated noisy environments.
General introduction
1.1
Physiology introduction
This section is based on [5] and [6].
1.1.1
Electrophysiology
The nervous system is a complex system on which all of the body’s functions depend. This system consists of 2 parts (Fig. 1.1):
• Central nervous system: the brain and the spinal cord;
• Peripheral nervous system: the autonomic nervous system, the enteric nervous system and the peripheral nerves.
The enteric nervous system controls the activity of the digestive tract but won’t be discussed in this thesis. The central nervous system is responsible for receiving, integrating and transmitting information; The autonomic nervous system regulates the action of internal organs in the context of the integrated functioning of the organism; The peripheral nerves are pathways responsible for driving information (nerve impulses). Sensory information are sent from sensory receptors into spinal cord by afferent nerves, and motor information are sent from spinal cord to effector (e.g. muscles) by afferent nerves.
The neuron is the functional unit of the nervous system, and they are very differentiated. One neuron cell body gives rise to two types of extensions: an axon and dendrites (Fig. 1.2). The dendrites are very branched and receive information from many other nerve
cells and the axon transmits information to other neurons or to non-neuronal cells such as muscles.
Figure 1.1: Nervous system. Figure 1.2: Neuron structure.
The neurons innervate to muscles are called motoneurons. Their bodies locate the spinal cord (central nervous system), their axons group together in fascicles and travel in nervous thrones (the efferent nerve) to reach their target organs . Otherwise, the neuron carries sensitive information is called sensory neuron, its cell body is right next to the spinal cord and its axon has two sides: the carried information are transmitted from the side connected to receptor to another side going into spinal cord (afferent nerve).
Taking the example of respiration (Fig. 1.3), the respiratory command is sent from respiratory center and transmit through spinal cord to the body of respiratory motoneuron, then this command travels on efferent pathway of phrenic nerve to respiratory muscles (red lines on Fig. 1.3). Meanwhile, some sensory information (e.g. pain) can be transmit to spinal cord by afferent pathway and may be sent to brain to be treated (green lines on Fig. 1.3). More respiratory details will be described in §1.1.2.
Information generated and transmitted by nervous system (nerve impulse) are in fact electrical impulses, called action potential, initiated in neuron bodies and then transmit on axons to target cells or organs. Because of ionic molecules with different electrical charges at two sides of neuron cell membrane, it exists a differential potential between inside and outside of the neuron cell. In resting state, this neuronal membrane potential is -70 mV (Fig. 1.4). But when there are some stimulus, some ionic molecules may cross through the membrane, these exchanges make the potential increase (depolarisation). If the stimulus reaches a minimum intensity (the threshold, depending on type of neuron), the action potential occurs in form of all-or-nothing: it won’t be generated if a stimulus intensity
Figure 1.3: The spinal pathway during respiration.
not high enough, and it will stay at the same amplitude and duration even if the stimulus intensity is much higher than the threshold. Once an action potential occurs, it will stimulate another action potential in neighbor zone so the electrical impulse propagates. These nerve impulses can lead to muscle contractions when they reach targeted muscles.
Figure 1.4: The resting potential.
1.1.2
Respiratory system
Respiratory mechanism
Internal or cellular respiration produces the energy required by animals to maintain a normal level of activity. During this process, oxygen (O2) is used by the mitochondria and
carbon dioxide (CO2) is produced. The necessary O2 is taken from the atmosphere, while
the CO2 produced is removed from the body during external respiration, which is the
subject of this study. The key point of external respiration is the process of gas exchanges that take place between air and blood in deep areas of the lungs. The structure of the respiratory system is illustrated in Fig. 1.5.
The lungs are the main organs of the respiratory system located in the rib cage, they offer the respiratory surface (the alveoli) where the gas exchange happens. Before reaching
Figure 1.5: The structure of respiratory system.
the level of the lungs, the air must pass through the upper airway (the nasal cavities, the pharynx, the larynx and trachea) and then enter the bronchi and bronchioles. The lungs are not able to inflate themselves; they inflate with air through the intervention of respiratory muscles that induce variations in the size of the thoracic cage. (Fig. 1.6).
Figure 1.6: Respiratory muscle organization.
The main respiratory muscle is the diaphragm, it forms a continuous layer that separates the thorax from the abdomen. At rest it forms a sort of dome, but when it contracts during inspiration, it flattens to increase the thoracic volume. Like liquids and gases, air
will always move from a zone of high pressure to a zone of low pressure. When thoracic volume increases, the pressure inside the lungs (alveolar pressure) falls down to be lower than the atmospheric pressure so that air enters into the lungs. This is the process of inspiration. At this moment, some abductor and dilator muscles of the upper airway are also activated to stabilize the airway and to prevent its collapse (obstruction) from negative intra-airway pressure due to diaphragm contraction [7]. During expiration, the diaphragm slowly relaxes and the elastic recoil force reduces thoracic volume so that the alveolar pressure exceeds inducing passive exhalation. These processes are illustrated in Fig. 1.7.
If the demand of O2 increases, other respiratory muscles could be recruited. The activity
of external intercostal muscles can stretch the thoracic cage upwardly and outwardly to increase supplementary thoracic volume, so increase inspiratory volume. On the other hand, the internal intercostal muscles and abdominal muscles can be required during exercise to assist decreasing thoracic volume and so the passive expiration becomes active.
Figure 1.7: Inspiration and expiration.
Respiratory regulation
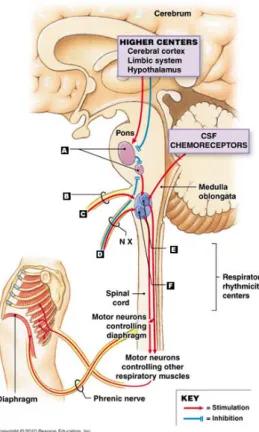
The respiratory muscles do not contract spontaneously but in response to efferent activity of the phrenic and intercostal nerves. The diaphragms are the main respiratory muscles, they are innervated by phrenic nerves originating in the cervical spine from the C3, C4 and C5 roots. As the example shown in §1.1.1, the respiratory command (nerve impulses) are sent from the respiratory center which is located in the brain and the brainstem, the commands pass through the cervical spine and phrenic nerve to provoke diaphragm contraction. This respiratory center can be divided into two parts (Fig. 1.8): the higher center (cerebral cortex, hypothalamus) controlling conscious respiration, and the respiratory rhythmicity center (medulla oblongata) controlling the unconscious respiration. The former can override the latter with conscious decisions such as breathing
exercises. In medulla oblongata, we distinguish two groups of neurons that discharge potential actions with an intrinsic rhythm corresponding to the respiratory cycle: the dorsal respiratory neurons (inspiratory neurons) and the ventral respiratory neurons (inspiratory and expiratory neurons). These two groups of neurons work together in the
way of reciprocal inhibition: one adds its activity when another initiates it.
The unconscious controls are determined by chemical and mechanical receptors. In general, ventilation is stimulated by gas exchanges: a lack of oxygen (hypoxia) and a rise in CO2 (hypercapnia). The partial pressures of the blood gases are detected by peripheral
and central chemoreceptors. They respond to variations in partial pressure of oxygen (PaO2), partial pressure of carbon dioxide (PaCO2), and arterial pH and are the only
receptors that respond to hypoxia. Central chemoreceptors are located in the brainstem and respond to most of the chemical stimuli of ventilation. Fig. 1.9 illustrates the principle of respiratory regulation.
Figure 1.8: Breathing rate control.
1.1.3
Cardiac system
As the O2 brought by inspiration needs to be transported over the body and the
produced CO2 needs to be brought to the lungs to be removed outside the body by
Figure 1.9: Diagram of respiratory regulation.
oxygen metabolism products and nutrients with the blood systems. In this process, our heart works as a pump to circulate the blood over the body.
Cardiac anatomy
The heart is located in the thoracic cage, on left side, in a fibrous bag called the pericardium which prevents an excessive dilation of the heart when it fills with too much blood. The pericardium is attached to the diaphragm, which allows the apex of the heart to be relatively fixed.
Figure 1.10: Heart anatomy.
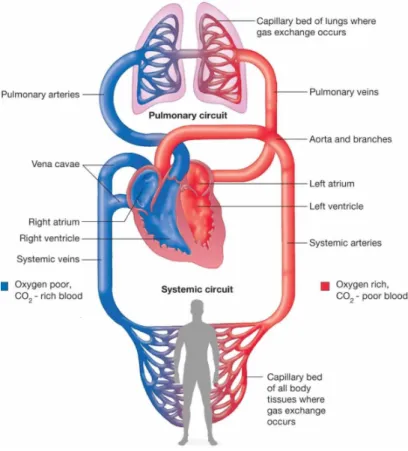
The heart is about the size of a closed fist and is made up of four muscular cavities: two atria and two ventricles, which lie side by side, separated by a muscular sheet called the septum (Fig. 1.10). The circulation is organized in such a way that the right part of the heart ejects the blood through the lungs (pulmonary circulation) and the left part of the heart pumps the blood into the rest of the body (systemic circulation). The two circulations are therefore placed in series (Fig. 1.11). Atria are thin-walled cavities that
receive blood from large veins and distribute it into the ventricles that provide the force needed to propel the blood through the pulmonary and systemic circulation. The atria are separated from the ventricles by a fibrous septum that contains the four heart valves: the atrioventricular valves and the aortic and pulmonary valves, theses valves can prevent back-flow of blood. And the cardiac muscle is called myocardium.
Figure 1.11: Blood circulation between heart, lungs and other body tissues.
Cardiac cycle
Not like respiratory muscles, the heart beats spontaneously. It shows a proper rhythmic-ity that is independent of any extrinsic nervous system. The excitation (action potentials) is initiated by a group of specialized cells, located in the sinus node, near the point of entry of the large veins in the right atria. The spontaneous depolarization wave (nerve impulses, 60-100 times per minute) begins from the sinus node, it spreads first through the two atria, then it goes into the ventricles with a delay about 0.1 seconds allowing contraction of the atria before the ventricular muscle is excited. After that, the electrical pulse (nerve impulses) is conducted throughout the rest of the heart.
As the mechanism of air going in and out our body, the blood flows form higher pressure areas towards lower pressure areas. When a cardiac muscular cavity contracts (atria or ventricles), the pressure within this cavity increases, and the blood is pushed out. As a
result, venous blood from the body and from the lungs enters the empty atria and flows into the empty ventricles (atrial and ventricular diastole), and the last blood volume is forced into ventricles by atrial contraction (atrial systole); then ventricular contraction (ventricular systole) ejects blood out through arteries; finally, the ventricles relaxes and
1.2
Respiratory paralysis
As presented in §1.1.2, the respiratory muscles contractions (the breathing) are con-trolled by spontaneous command from the respiratory center. If this respiratory command is absent or interrupted, spontaneous breathing is no longer possible. This is called respiratory paralysis, and depending on the original reason of paralysis, it can be divided into two groups: central respiratory paralysis and acquired respiratory paralysis. Patients with respiratory paralysis are dependent on artificial ventilation.
1.2.1
High spinal cord injury
A damage to the spinal cord (nervous pathway is damaged) can cause temporary or permanent changes in its function, like loss of muscle function, sensation, etc. If the damage happens at cervical level (above C5), the transmission of respiratory commands may be interrupted. This case is an acquired respiratory analysis. In France, the incidence of patients with cervical spinal cord injury depending on artificial ventilation support is estimated around 12.7 per one million inhabitants, among which 6.5% requires long-term mechanical ventilation [8].
1.2.2
The Ondine syndrome
In the case of the central respiratory paralysis, the ventilatory impulses generated by the brain stem are lacking. It can be caused by brain stem lesions or drugs and substances, etc [9]. When this lack of ventilatory impulses happens during sleep, it induces Central Sleep Apnoea (CSA). Congenital cases are very rare, such as congenital central alveolar hypoventilation. This kind of CSA is often referred to Ondine’s curse, so it is also called Ondine syndrome. In 2008, only 1000 total cases were known in the world [10], about 60 patients were in France, and 10%-15% whithin them have a artificial ventilatory dependence [11].
Most of the time, we breath automatically without thinking about it. The respiratory center will send respiratory commands in response of different levels of gases in the blood (1.1.2). But for patients with Ondine syndrome, their respiratory center are not sensible to changes of gases in blood due to a mutation in gene (PHOX2B: it codes for a protein involved in the development of the autonomic nervous system during the embryonic stage). Fortunately, on awakening, the extra motor area (an area of the cortex that is not normally involved in automatic breathing) comes to the rescue. It commands a regular breathing,
regardless of the need for oxygen. As soon as sleep occurs, this area becomes inactive and the patient may stop breathing spontaneously [12].
1.2.3
Treatments
For patients with respiratory paralysis, artificial ventilation can replace or help to restore patient’s ventilatory function. The most common treatment is mechanical ventilation which pushes air into patient’s lungs through tracheotomy (an incision on the front of the neck and opening a direct airway through this incision in the trachea with a tube). However, severe drawbacks of mechanical ventilation are reported: (1) the induced positive pressure disturbs the venous return [13], (2) ventilators are noisy and limit mobility which reduces the quality of life, (3) tracheotomy may cause respiratory infections, reduction of olfaction, taste and speech [14].
As presented in §1.1.1, action potential (nerve impulse) is generated by a stimulus on neuron. In fact, this stimulus can be artificial. It means, the respiratory command sent from respiratory center is missing or interrupted, but it can be reproduced by an artificial electrical stimulation after the damaged region on the respiratory pathway. In the case where phrenic nerves and diaphragm remain functional (the motoneurons innervated to diaphragm are still complete, the nervous pathway from phrenic nerve to diaphragm has no damage), the mechanical ventilation can be replaced by another artificial ventilation: Diaphragm Pacing (DP), which could cancel some of the disadvantages mentioned above. Furthermore, DP induces a more natural respiration and reduces health care costs [13][14].
1.3
The diaphragm pacing
1.3.1
History
The first DP (stimulation on the phrenic nerve) goes back to the discovery of electricity. In 1819, diaphragmatic contraction induced by phrenic nerve stimulation is described for the first time. Leroy d’Etiolles put the concept of DP into practice in 1829. Next, Duchenne De Boulogne described in detail the technique of DP by stimulation of the phrenic nerve on the neck [15]. It was in the 1970s that W. Glenn and his team proposed the first clinical applications of implanted DP (by phrenic nerve stimulation), and this technique has been used to date [13].
The implanted DP was introduced in France around 1985, by a team led by Dr.Jean-François Brûlé at Helio-Marin Hospital in Berck, but stopped after the latter’s death. From
the mid of 1990s, this activity was put in place again by the pulmonology team of Pitié-Salpêtrière Hospital Group. Until 2015, this activity resulted in a total of 47 implantations in patients with tetraplegia and patients with central hypoventilation. The accumulated knowledge and results contributed to the positive opinion that was expressed by the Haute Autorité de Santé (HAS) regarding the technique in 2009, then to the registration of two stimulators (Atrostim R and NeurRxDP4 R). The cost of using the registered devices can
benefice from the reimbursement of social security, which is important for promoting the wide use of implanted DP systems.
1.3.2
Diaphragm pacing technique
Depending on the targeted tissue activated by electrical stimulation, the DP techniques can be divided into four categories:
Intra-thoracic phrenic nerve stimulation (IT-PNS)
This technique corresponds to an implantation of electrodes in direct contact with the phrenic nerves, at the level of the thorax. Two commercial systems rely on this technique: Atrostim R (AtroTech, Tampere, Finland) and Mark IV Breathing Pacemaker R
(Avery Biomedical Devices, USA 1.13). The two systems have a similar structure (Fig. 1.12): An inner part includes the electrodes; Another external part includes the electric pulse generator (controller). The connection between these two parts is done by radio-frequency with a subcutaneous receptor and an external antenna (wireless connexion). The electrodes are implanted by mini-thoracotomy, on each phrenic nerve with VATS or under video-surgery.
Figure 1.12: General structure of implanted DP system.
Figure 1.13: The IT-PNS stimulator – Mark IV Breathing Pacemaker R.
Until 1996, based on 64 following patients who have been implanted with Atrostim R
device for an average of 2 years, about 50% were able to maintain full-time IT-PNS, while about 80% of them were able to maintain the stimulation on the day only [16]. In
France, the IT-PNS is the most used technique with the Atrostim R system. Between 1997
and 2007, for an implantation duration of more than 3 years, ventilatory weaning was obtained in 18 out of 20 patients [14]. According to the report activity 2011-2015 ("post-reimbursement") of intrathoracic phrenic nerve stimulation within the "Multidisciplinary Group of Respiratory Neurostimulation" coordinated by the Department of Pneumology and Medical Resuscitation of Pitié-Salpêtrière, during the period of 2011-2015, 24 months after implantation, 9 out of 12 patients had achieved autonomy with the stimulation system for at least 12 hours per day, corresponding to a total weaning capacity of the artificial ventilation (including 3 patients who died before 24 months). For two patients, ventilatory autonomy was 4 hours and 2 hours, respectively.
Intra-diaphragmatic phrenic nerve stimulation (ID-PNS)
The ID-PNS is based on the implantation of intramuscular electrodes near the termina-tions of the phrenic nerves in the diaphragm, by laparoscopic way. To do this, a mapping is performed perioperatively to identify the phrenic motor point in each diaphragm, and two stimulation electrodes are at this level. Only one system is available on the market with this technique, NeurRxDP4 R (Synapse, Oberlin, Ohio, USA). This system also has
an inner part (electrodes) and an outer part (generator), but both parts are connected by a transcutaneous cable (shown in Fig. 1.14).
Figure 1.14: The ID-PNS stimulator – NeurRxDP4 R [15].
With the NeurRxDP4 R device, a study of 51 patients shows that approximately 50%
of the patients were able to maintain full-time stimulation. For patients not using the device for full-time, the duration of application could range from 4 hours to 5 hours. A total of 49 high spinal cord injury (SCI) implanted patients (96%) were with a complete weaning (>12 hours stimulation per day) from mechanical ventilation [16]. In France, NeurRxDP4 R is also registered in the HAS, and can therefore be reimbursed by social
security. For tetraplegic patients, ID-PNS is effective and has been reported to be easier to implement and less expensive than its intrathoracic counterpart [17]. In contrast, shoulder
pain and infection problems have been described in the literature, and this pain might be caused by the high stimulation intensity [17].
Transvenous phrenic nerve stimulation (TV-PNS)
The TV-PNS is based on the implantation of electrodes in the subclavian vein at a point near the phrenic nerve. It is a temporary unilateral stimulation. This technique is specifically used to treat CSA, especially in the case of cardiac stroke. The device is implanted by an electrophysiologist in the cardiac suite, in general, under conscious sedation. The remed¯e R system (Respicardia Inc., Minnetonka, MN, USA) is the only
TV-PNS system on the market (shown in Fig. 1.15). This system is fully implantable, it has a stimulation probe and a detection probe to provide stimulation in case of CSA. Since 2015, the first pilot studies on different stimulation durations have all shown a significant reduction in Apnoea-Hypopnoea Index (AHI) (the number of sleep apnoea or hypopnoea events per hour) and an improvement in sleep quality [18][19][20][21].
Figure 1.15: The TV-PNS stimulator – remed¯e R [15].
There is also another transvenous phrenic stimulation (SP-TV) on the same principle but it is non-invasive. The goal is to stimulate the diaphragm during mechanical ventilation to avoid or strengthen the atrophied diaphragms, and to alleviate the disadvantages of mechanical ventilation (exp, improvement of venous return). In the First-in-Human protocol of TV-PNS on 23 patients, significant reductions in pressure-time-product of the ventilator were obtained [22].
High frequency spinal cord stimulation (high frequency spinal cord stimulation (HF-SCS))
The HF-SCS is a high frequency stimulation (> 300Hz) applied directly on the spinal cord at the thoracic level. This technique can activate not only the phrenic nerves, but
also the intercostal muscles (ventral T2) and the exhalation muscles (dorsal T9-T11). On the other hand, certain movements (legs, arms, ...) and sensations (pains, tingling, ...) are also activated [16][23]. For the moment, there is still no device available on the market. Stimulation of the intercostal muscles is an effective method for providing long-term ventilatory support by combining it with phrenic stimulation [16]. In addition, 3 patients with high tetraplegia who had been implanted with the HF-SCS system had improved ability to eliminate secretions by HF-SCS-stimulated cough [24]. The latest research on 11 dogs has shown that, unlike the dorsal HF-SCS at the level T9 which causes positive pressure in the thorax (active exhalation), the ventral HF-SCS at same level of the spine causes a strong negative pressure (inspiration) from weak stimulation currents. This method could therefore be an alternative method to restore ventilation in patients with SCI with ventilatory dependence [23].
1.3.3
AtroStim
In this study, the implanted DP system used is the AtroStim R (AtroTech, Tampere,
Finland). It is an IT-PNS system. For the implanted part, it has symmetrical structure for the left and right sides, furthermore these two sides can work independently. The AtroStim R is also the only IT-PNS system which has multiple stimulation contacts: 4
contacts on each side, and these 4 contacts stimulate the phrenic nerve alternatively (Fig. 1.16). Compared to the unipolar stimulation, the design of alternative stimulation with multiple contacts activates only one part of the phrenic nerve at time, so that the intensity and the frequency of stimulation can be reduced to prevent the fatigue of diaphragm. More over, all these 4 contacts can also work independently.
Figure 1.16: Structure of the AtroStim R.
At the installation of the device, stimulation parameters are set into the external controller. During stimulation, the controller sends power and stimulation commands to implanted radiofrequency receivers. This radiofrequency communication is based on amplitude modulation (AM). As shown in Fig. 1.17, the message signal is a rectangular
waveform, and the carrier signal is a sinusoid waveform which frequency is 25 MHz. The period of message signal corresponds to the stimulation period, and the duty cycle of this rectangular waveform (the ratio between the pulse width and the period) controls the stimulation intensity.
Figure 1.17: Sending stimulation information by radiofrequency communication – AtroStim R.
According to the received commands, electrical pulses (stimulus) are sent through the quadripolar electrodes alternatively to provoke diaphragmatic contractions, so to have an inspiration (Fig. 1.18). During the respiratory cycle, inspiration is an active movement whereas expiration is passive. Therefore, IT-PNS is by nature limited to inspiration. Two cycles of stimulation signals of the AtroStim R system are illustrated in Fig. 1.19. One
breathing cycle lasts T1, including inspiration phase T2 (it is also the stimulation duration)
and the expiration phase (T1 → T2). Each red vertical line in this figure represents
one stimulation pulse which pulse-width is 200 µs. The minimum stimulation intensity (threshold) is IT H. And IT V is the intensity corresponding to the tidal volume, it is also
the maximum stimulation intensity. During T2, the stimulation begins at the intensity of IT H, and increases at each pulse until the IT V, then remains at the IT V until the end of
T2. Except stimulation pulse-width, all other stimulation parameters mentioned above
are manually adjustable depending on patient’s situation during and after implantation operation.
A ramp stimulates muscle fibers progressively to avoid a fast contraction of the diaphragm. This mimics the natural recruitment of motor units during spontaneous inspiration. In general, the inspiration would begin when stimulation intensity reaches the IT V.
1.3.4
Aim of thesis: DP in close loop
Even though DP has several advantages over the classical mechanical ventilation, it is not safe enough to maintain a full-time ventilatory assistance because of the absence
Figure 1.18: Stimulation procedure. Figure 1.19: Stimulation signal of AtroStim R.
of any "efficacy alarm" [16]. For example, DP systems alarms warn users of electronic failure, but, contrary in the case of mechanical ventilators, do not warn about ventilatory inefficiency. Indeed, DP systems do not embark any ventilatory monitoring. As described in §1.1.2, upper airways muscles can help to stabilize airways. Diaphragms contract to create negative inter-pressure during inspiration. If at this process that upper airways muscles are relax or contract much later than diaphragm, upper airways are not stable and may collapse because of this inter-pressure. This may happen to high tetraplegic patients with DP system [7], because they can’t feel the diaphragm contraction (efferent pathway is also damaged due to spinal cord injury) to synchronize their upper airways muscles’ activities. Especially in sleeping (lying) because the largest upper airways muscle (tongue) relaxes and slips towards pharynx that inducing more possibility of upper airway collapse (Fig. 1.20). As a result, patients cannot be left alone during the day and usually return to mechanical ventilation during the night for safety reasons, e.g. obstructive sleep apnoea.
Figure 1.20: Obstructive apnea because of airway collapse in sleeping.
In addition, all existing DP systems work in open-loop; indeed, stimulation is delivered with constant predefined parameters. It means that stimulation intensity, pulse width and frequency are fixed at the installation of the implant, updated at each control visit, but do not adapt to patient’s continuous situation evolution because of the absence of respiratory
monitoring. To close the loop, an ambulatory respiratory monitoring solution needs to be developed.
In this thesis, the first aim is to detect if patient is breathing or not; and secondly is to offer detailed respiratory information: inspiration/expiration, pauses, respiratory rhythm, volume, etc. Finally, for patients implanted DP system or patients with sleep apnoea problems, it’s also important to evaluate their cardiac activities.
1.4
Clinic cardiorespiratory monitoring
The American Academy of Sleep Medicine (AASM) from 1999 and the international Classification of Sleep Disorders (ICSD-2) have defined some abnormal respiratory events as [25]:
• Hypopnoea: A decrease from baseline* in the amplitude of a valid measurement of breathing during sleep that either reaches 50% with an oxygen desaturation of 3% or an arousal, or alternatively a 30% reduction with 4% oxygen desaturation.
*Baseline:
– For subjects with stable respiration: average amplitude of stable respiration within 2 minutes before the event.
– For subjects without stable respiration: average amplitude of the 3 most extensive cycles within 2 minutes before the start of the event.
• Apnoea: The cessation of breathing (respiratory flow) lasting for more than 10 seconds.
• Obstructive Sleep Apnoea (OSA): An apnoea or hypopnoea for more than 10 seconds with presence of ventilatory effort.
• Central Sleep Apnoea (CSA): An apnoea without presence of ventilatory effort. • Mix apnoea: Apnoea begins as a CSA but ends up with presence ventilatory efforts.
To evaluate the degree of severity of sleep apnoea, the Apnoea-Hypopnoea Index (AHI) is introduced on the number of apnoeas and hypopnoeas occurring during 1h of sleep. This severity is classed as: mild (5 ≤ AHI ≤ 15 events.h−1), moderate (15 < AHI < 30 events.h−1) and severe(AHI ≥ 30 events.h−1) [26].
According to these definitions, two essential parameters are important to measure, evaluate and identify abnormal respiratory events: the respiratory ventilation (air flow) and the respiratory effort. Furthermore, for classifying hypopnoea, the oxygen saturation and snoring are also needed to be measured.
In this section, some clinic methods to detect/quantify respiratory air flow, to evaluate respiratory effort and to monitoring cardiac activity are presented.
1.4.1
Ventilation measurement
Pneumotachograph
The traditional pneumotachograph (Lilly type) is a device which measures the differen-tial pressure between before and after a membrane in the tube to calculate the volume of air passed. This is the only available solution to quantitatively measure respiratory flow, and is considered as the reference method. However, there are other innovative pneumotachographs that are in the form of a mask rather than a spirometer (Fig. 1.21). The principles of this type of pneumotachograph depends on the sensors used in spirom-eters. These sensors can be ultrasonic, mechanical (Turbine), thermal, etc. [27] It is necessary to wear a mask to avoid the leak of gas which is uncomfortable. The traditional pneumotachograph must be heated up to 37 degrees to avoid condensation, it is also not very pleasant for the user. Snoring is an event that is thought to indicate an obstruction, it is favored by the opening of the mouth. As the mask covers the mouth it reduces snoring noises and disrupts the quality of sleep.
Nasal cannula
The nasal telescope is a small device placed at the end of the nose (Fig. 1.22). It measures nasal pressure changing during respiration, and the volume can be estimated as approximately the root square of the measured pressure:
P ≈ ˙V2
The results obtained can vary a lot if the patient expires using the mouth or if he has a nasal obstruction. Moreover, a displacement of the sensor can cause a loss of signal.
Figure 1.21: The pneumota-chograph.
Figure 1.22: The nasal can-nula.
Figure 1.23: The induc-tance plethysmography.
Plethysmography
Plethysmography contains a chest and an abdominal band. It evaluates the tidal volume by the summation of the thoracic and abdominal movements after calibration. But, on the other hand, it is difficult to stabilize the calibration during the night when patients change position. The types of sensors used for plethysmography can vary:
• The induction respiratory plethysmography (IRP) is based on an electromagnetic measurement of a section’s surface variations;
• Bio-impedance sensors measure changes in chest impedance related to breathing. There are also piezoelectric straps and cushions ultra-sensitive to movement.
Thermistors
Like the nasal telescope, the thermistor is placed at the end of the nose (Fig. 1.24). It is based on the difference of temperature between the exhaled air and the inspired air. More precisely, it detects the expiration when the exhaled air heats the sensor. Sensitivity of the sensor is lower if the ambient temperature is high. In addition, the sensor no longer works if it is in contact with the skin. The thermistor does not perform fairly accurate measurements (the flow variation is not linear with the temperature variation), so it is recommended not to use the thermistors alone for the detection of respiratory events.
1.4.2
Respiratory effort evaluation
Esophageal pressure
This is the reference method for measuring respiratory efforts, and the recommended method for highlighting high-resistance episodes. The pressure sensor permanently touches the posterior wall of the pharynx (Fig. 1.25), which is uncomfortable for patients and disrupts the quality of sleep. The dynamics of the airway is also changed.
Thoraco-abdominal movements
The principle is to look for a phase shift between thoracic and abdominal movements. The measurements can be performed similarly to the plethysmography mentioned above. On the other hand, the variations are influenced by the displacement of the sensors, the change of position, the stage of sleep and the degree of obesity. Moreover, the visual
Figure 1.24: The thermistor SleepStrip R. Figure 1.25: The
esophageal pressure [28].
analysis of the phase shift is not always easy, and it is possible to have obstructive events without thoraco-abdominal phase shift. A comparative study showed that 37% of screened apnoeas as central on the straps (inductance) are reclassified as obstructive or mixed on the esophageal pressure data [29]. This method gives important errors on apnoea classifications.
The pulse transit time (PTT)
The pulse transit time is the time required for the wave corresponding to the pulse to travel the distance between the aortic valve and the last phalanx, which is about 250 ms. This method is based on the fact that velocity is proportional to the rigidity of the arterial wall. The increase in PTT reflects the increase in respiratory efforts, and the micro-arousals are associated with a decrease in PTT. This method can give accurate results, but it has only been validated on a small population and few events. In addition, the measurements are sensitive to artifacts.
1.4.3
Cardiac diagnostic: ECG and PCG
As explained in §1.1.3, the heartbeat is due to an activity initiated by an electrical impulse that is conducted throughout the myocardium. This electrical impulse is in fact in the orm of action potentials (specific potential difference), and these action potentials can be recorded by correctly placing electrodes on the chest as with Electrocardiogram (ECG). As said in 1.1.3, the atria contracts before ventricles, and the action potentials present different characteristics in those different regions (Fig. 1.26), the registered ECG is the sum of these different action potentials, and it gives insight into both normal and abnormal heart function.
The first detectable wave (P wave), appears when the impulse spreads to the atrial myocardium, depolarizing the atria. Then three waves appear together: Q, R and S and
so-called QRS complex corresponding to the depolarisation of 2 ventricles. At the end, the T wave occurs and indicates the ventricular repolarization.
Figure 1.26: Relationship between the onset and duration of action potentials of cardiac cells during an isolated cardiac cycle and cor-responding ECG pattern
Figure 1.27: The four heart sounds in relation to various hemodynamic events and the ECG. [6].
Another method to evaluate cardiac function is through heart sounds: Phonocardiogram (PCG). Normally, there are 2 to 4 heart sounds, called S1-S4, shown in Fig. 1.27. The first sound (S1) occurs during the closing of the atrioventricular valves, corresponding to QRS complex in ECG but with a slight delay. The second sound (S2) occurs at the time of the closing of the aortic and pulmonary valves, corresponding to the end of T wave or just after it in ECG. The interval between S1 and S2 corresponds to the systole period, and similarly, the interval between S2 and S1 corresponds to the diastole period. S3 and S4 are both related to the diastolic filling period [6]. S3 and S4 cannot always be recorded (depending on subjects and recording system) and give less information, so they are less
discussed than S1 and S2.
The interval from one heart beat to another is not fixed, this variation is called heart rate variation (HRV). This explains why cardiac rhythm is always calculated as an average over a period of time (e.g. 30 seconds). But the HRV is an important reflex to both sympathetic and parasympathetic activity during sleep. Thanks to this reflex, some researchers use the HRV to illustrate sleep stages, but it’s influenced by age [30]. The HRV is processed by calculating the interval R-R in ECG.
1.4.4
Other measurements
Snoring measurement
Snoring measurements are usually carried out either by one or two microphones positioned in the room, or by microphones glued on the patient.
Measurements of oxygen saturation
The oxygen desaturation of hemoglobin falls within the definition of certain hypopnoeas. The measurement is performed by means of an oximeter (an infrared type sensor). It emits two different lights that will be absorbed by hemoglobins and oxymoglobins with different rates. A receiver then receives the unabsorbed light to calculate the oxygen saturation (SaO2). The oximeter can also give the heart rate because the oxygen saturation
/ desaturation cycle corresponds to the contraction of the heart muscle.
The time window used for averaging heart rate is important for choosing an oximeter. A long time window can over-smooth the signal, making difficult to see the influence of desaturation on the calculation of the index of hypnoea. So, to obtain a good classification result, it is advisable to choose oximeters that have a high sampling frequency (> 1 Hz) adapted to an averaging window of a maximum duration of 3 s to 5 s. But the respiratory detection result with oximeter only is still not accurate, especially for prolonged/long-time apnoea, because the sensors are often placed at the fingers extremities, but blood flows towards the vitals organism when lack of oxygen.
gaseous exchange measurements
Capnography is a graphical representation of the changes in CO2 concentration in respiratory gases. It is useful for monitoring CO2 production, pulmonary perfusion and alveolar ventilation of the patient. The measurements are made by an arterial catheter or an infrared sensor that measures CO2 concentration in the expired air. In some cases, the O2 pressure and the transcutaneous CO pressure are also measured.
1.4.5
Polysomnography and polygraphy
The PSG is a measurement applied on sleep, respiration, cardiovascular signals and movements. In general, it requires the acquisition of 3 main signals: the electroencephalog-raphy (EEG), electro-oculogelectroencephalog-raphy (EOG) and the electromyogelectroencephalog-raphy (EMG).
In France, the primary Health Insurance Fund: Caisse primaire d’assurance maladie (CPAM), gives the definition of PSG as: The polysomnography includes simultaneous
EEG on one or two leads, EOG on one lead, and one of the following recordings: • EEG on at least eight leads (10-20 international electrod placement);
• EMG on at least two leads for the tone of mentails and submentails muscles; • Cardiorespiratory physiological parameters: noises, flow and respiratory effort, oxygen
saturation (SaO2) and heart rate.
The PSG is considered as the "gold standard" for the scoring of sleep and associated events[26], but the operation of PSG is complicated. In this case, respiratory polygraphy is introduced as a role of a simplified version of polysomnography, it does not perform neurophysiological measurements. Its definition given by the CPAM is as follows: "The nocturnal respiratory polygraphy includes the simultaneous realization of the following examinations: measurement of the SaO2 by oximetry and nasobuccal air flow, and/or
quantification of the snoring with recording of the tracheal noises, and/or evaluation of respiratory efforts, and/or analysis of the body position, over a nocturnal period of at least 6 hours. "
1.4.6
Examples of characterizations of abnormal respiratory events
Two examples of sleep apnoea adopted from [26] are presented. Figures shown below correspond to recorded signals from PSG. The signals correspond to: THOR RES – thoracic respiratory band; ABDO RES – abdominal respiratory band; F – front; B – back; L – left side; R – right side.
CSA
Fig. 1.28 presents 10-min recordings from PSG. It shows the presences of CSA because when there was no nasal pressure (marked in rectangles), the THOR RES and the ABDO RES are also absents (no respiratory effort).
OSA
Fig. 1.29 presents 5-min recording from PSG. Not like in 1.4.6, when nasal airflow is absent, there were still thoracic and abdominal movements (marked in rectangles). It indicates some OSA.
Figure 1.28: Example of PSG signals showing some CSA.
1.5
Respiratory detection from TS
1.5.1
Method selection
In the future, NEURORESP company intends to develop a portable respiratory polygraphy device which would play an important role in diagnostic assistance and home respiratory recording. As mentioned before (§1.3.1), for a customer to be reimbursed, a device has to be registered at HAS. This is a key point for patients to buy a medical device. The first condition to register in HAS is that the design of the device corresponds to the definition given by CPAM (definitions presented in §1.4.5).
In this thesis, the primary aim is to detect apnoea either to provide an alarm in case of apnoea while phrenic nerve stimulation is supposed to pace the diaphragm or to register automatically apnoea events during sleep apnoea. The secondary aim is to get a quantitative evaluation of the quality of the inspiration or to further investigate the type of apnoea (central of obstructive). As described in §1.4.5, the designed system is not intended to perform any neurophysiological measurement, but needs to be able to evaluate respiratory effort in order to identify central and obstructive apnoea, it is about a polygraph. According to the CPAM definition of polygraph (see §1.4.5), several sensor combinations could be acceptable. One ideal composition for diagnostic aid would be the use of an oximeter plus an airflow sensor and a respiratory effort sensor. However, the system should be usable without an extra surgery or with existing devices so that the monitoring device needs to be non-invasive and as invisible as possible. The existing measurement methods presented above (§1.4) are either too sensible to movements (e.g. plethysmography, ECG), or cumbersome with equipment placed on the patient face (e.g. nasal cannula, thermistor), or not portable (e.g. pneumotachograph, esophageal pressure). In order to counteract the drawback of existing solutions, we propose a respiratory monitoring method using tracheal sounds (TS). We believe that this could be a good choice as this method is easy to apply and could be non-invasive. The use of TS has been recommended in ambulatory sleep apnoea diagnostic devices in 2004 [31]. Furthermore, TS contains respiratory sounds (to detect the presence of airflow) and cardiac sounds (like PCG). One interesting aspect is that the amplitude of cardiac sounds (S1/S2 peaks) varies regularly following the thoracic volume changes, which means the respiratory effort could be derived from this variation.
In summary, in following the definition given by CPAM, an ideal respiratory detection device should be ambulatory and non-invasive, should be suitable for long term and real-time recordings, and has to give a robust results. We also believe it would be interesting
to monitor other vital signals like cardiac rhythm, which could be possible to evaluate respiratory effort. So the chosen design of device would be microphones (TS) plus an oximeter (SaO2).
1.5.2
Respiratory sounds
A sound is generated by a vibrating object and propagates under the form of waves. In the case of TS, the vibrating object is the air passing through airways - the turbulent airflow, and causing pressure vibrations that are transmitted to the body surface (e.g. the neck) throughout the tracheal wall and the surrounding tissues. Indeed, the recorded sounds directly from body surface are tracheal wall vibrations, not regular acoustic sounds. Thanks to this characteristic, the suprasternal pressure (SSP) can be extracted to evaluate the respiratory effort by some surface sensor [32], e.g. an accelerometer.
The tracheal wall vibrations (body surface tissue vibrations) also induce atmosphere pressure changes in the surrounding area as the sounds propagate in the air, so that we can "hear" the TS. This means that TS can be recorded indirectly by a microphone placed in the air close to the neck. As proposed in [33], some specific designs of the microphone support can be used to improve the quality of TS taking advantage of the resonance inside the concave support. We have used a similar approach as presented in §2.1.1.
Compared to lungs’ sounds, tracheal sounds are more sensitive to airflow changes and are often considered to be purer and less filtered breath sounds [34]. With different airways structure (dimension), the characteristics of TS could vary because resonance of the airflow changes. One example is that children had significantly louder and higher frequency components TS than adults [35]. This phenomenon is also useful in studying abnormalities of the upper airway, as OSA screening tool in wakefulness [36].
1.5.3
The historical context of TS processing
The respiratory detection using tracheal sounds had been widely studied in the past.
• In 1980, Krumpe et al. first showed that an apnoea could be identified by the interruption of laryngeal sounds recorded at the neck [37][34].
• In 1982, Cummiskey et al. [38] demonstrated that using TS sensor to detect apnoea and hypopnea could have similar results compared to reference sensors such as the nasal pressure cannula.
• In 1988, Penzel et al. [39] developed a new product to differentiate obstructive apnoeas and hyperventilation occurrence in real time through the recording of snoring sounds from one laryngeal microphone.
• In 1989, Meslier et al. [40] were the firsts to show a good correlation in the detection of the number of apnoeas and their duration obtained from TS and synchronized pneumotachograph signals. This was performed on healthy participants.
• In 1990, also on healthy subjects, Soufflet et al. [41] showed a correlation between the TS and the respiratory flow and concluded that TS could be used to calculate the flow rate.
• In 2001, Chuah et al. [42] calculated the power spectrum in specific frequency bands for both the chest sounds and the tracheal sounds. Using peak picking technique, the former was used to detect respiratory phases and the latter was used to detect breathing onsets. On 17 sets of data (from 11 healthy subjects, aged 4-35), this method reached 93% of phase detection accuracy and 100% of breath onset detection accuracy.
• In 2004, Hult et al. [43] improved their detection method from 2000 [44]. They calculated the frequency content of tracheal sounds between 300 Hz and 1100 Hz in real-time, and applied a threshold detection approach to identify the presence of airflow. Finally, they could differentiate inspiration/expiration phases by verifying the pause duration, the respiratory events order and the frequency content in specific frequency bands. This improved method showed more than 90% of detection rate on two groups (heart decease and intensive care unit) of 10 patients.
• In 2008, Corbishley et al. [33] demonstrated that the suprasternal notch was the best place to record tracheal sounds. They also analysed the influence of inter-body noises and artifacts noises on respiratory sounds recordings. unfortunately, this influence (noises frequency band, amplitude, etc) may change according to different recording systems because recorded sounds characteristics highly depend on the used hardware [34]. This study finally proposed an algorithm that could be implemented into a miniature and low-powered sensing device. The algorithm was based on the temporal envelope detection with several user dependent threshold. This method was tested on 5 healthy participants in different situations (presence of surrounding noises, moving, falling, etc), the results reported in detected breathing time (91.3%), but apnoea events detection were specified.
• In 2009, Kulkas et al. [45] proposed to detect apnoea events based on the ratio of the power density between 0-50 Hz (heart beat) and between 0-600 Hz (heart beat and respiration). The processing was realized on a period of data, the longer
this period of data, the more accurate the detection results. When the data period was less than 5 seconds, the separability was less than 75%. In the same year, the same group developed another breathing detection method based on envelope extraction automatic patient-specific amplitude threshold determination [46]. On 6 patients with sleep apnoea, they obtained 100% of positive prediction values on 1434 respiratory cycles.
• In 2010, A.Yadollahi and Z.Moussavi [47] recorded both snoring sounds (a microphone hanging above patient’s face) and tracheal sounds to detect apnoea. The recorded sounds were classified automatically based on their energy, zero crossing rate and formants. These 3 features (dimensions) were set to 1-dimensional space by using Fischer Linear Discriminant, then classified with Bayesian threshold. An overall accuracy of 90% was found. In the same year, A.Ydollahi et al. [48] had also proposed another detection method by combining tracheal sounds and SaO2 signal recordings.
They used the logarithm of the tracheal sounds variance in place of the energy of respiratory sounds [41][49] to estimate the respiratory relative respiratory flow. And some features (sounds energy, event duration, amplitude, etc.) were extracted based on this estimated flow signal. All these features were weighted and added together to determine apnoea with threshold detection. Finally, this method demonstrated a high correlation (0.96, p<0.0001) with PSG. Also in 2010, Mlynczak et al. [50] developed the first wireless TS sensor using a smartphone application. They studied the accuracy of a new method in differentiating between normal breathing sounds and snoring episodes.
• In 2014, Kalkbrenner et al. [51] developed a system to analyze sleep by tracheal sounds and movements recordings. A real-time method has been proposed to detect cardiac peaks. They compared detected cardiac peaks’ amplitudes, intervals and frequency contents to estimate the next cardiac cycle. And respiratory phases were classified by using a threshold detection in the spectral power between 10-600 Hz. • In 2016, Y.Nam et al. [52] proposed to use a smartphone to record nasal and
tracheal sounds. They estimated breathing rate by using a Welch periodogram and an autoregressive spectrum. The result obtained from nasal sounds monitoring were excellent as the median errors were less than 1 %, but the use of tracheal sounds resulted in a poor estimation success.
• In 2017, Kalkbrenner et al. [53] improved their method by proposing an offline solution, which processed short-term and long-term envelopes of the tracheal sounds to evaluate the amplitude changes. They then combined these changes with move-ments (measured with IMUs) to detect sleep apnoea. They also introduced another algorithm to extract the hear beat with an amplitude threshold and a cardiac peak


![Figure 1.15: The TV-PNS stimulator – remed¯ e R [15].](https://thumb-eu.123doks.com/thumbv2/123doknet/7718535.248143/33.892.178.718.540.749/figure-tv-pns-stimulator-remed-e-r.webp)