Studying bright, massive stars in the era of large telescopes
II. Wind structures
Thierry MOREL
Institute for Astrophysics and Geophysics, Liège University, Allée du 6 Août, 17, 4000 Liège, Belgium
Abstract
There is strong observational evidence that the winds of massive stars are clumpy and/or exhibit large-scale spiral streams. Studying the structure of these outflows may not only provide more accurate estimates of the mass-loss rates that are critical for modelling their evolution, but also indirectly reveal the existence of pulsations and magnetic fields. After a description of the progress made in the study of these wind structures, we will briefly discuss the perspectives for the future and draw attention to the potential of spectroscopic campaigns carried out by amateur astronomers to lead to significant advances in the field.
Keywords : Magnetic fields: stellar - Oscillations: stellar - Spectroscopy: in astronomy - Stars: characteristics and properties - Stellar winds - Supergiant stars - Variable stars
1. Introduction
Massive stars lose a considerable amount of mass through a stellar wind. As an illustration, a star of 20 solar masses typically loses about 6 times the equivalent of the mass of our Sun by this sole phenomenon during its lifetime (e.g. Meynet & Maeder 2003).1 This mass loss not only affects the environment of the star and enriches the interstellar medium in metals, but also has a dramatic impact on the evolution of the star itself (see Puls et al. 2008 for a comprehensive review about mass loss and Rauw 2010 in a companion paper for more details about the properties and evolution of massive stars).
For long, the winds of OB stars have been assumed for simplicity smooth and isotropic, i.e. that there are no local inhomogeneities within the wind and that the amount of material lost is identical at all points of the surface. However, evidence has been accumulating over the years
1
On the other hand, the almost entirety of the remaining mass is eventually injected into space when the star explodes as a supernova.
that these basic assumptions need to be abandoned, and nowadays it is believed that both small- and large-scale structures may exist in the wind of a massive star (whether they can coexist is still unclear). Revealing the existence of small-scale structures in OB stars is challenging and requires world-class observing facilities, as will be shown in the following. On the contrary, relatively small telescopes equipped with moderate-resolution spectrographs are amenable to studies of the large-scale structures. For this reason, much more emphasis will be put on the latter in the following.
2. Small-scale structures
Observations of the evolved descendants of O stars, the Wolf-Rayet stars, have shown that their outflows are fragmented and made up of a hierarchy of small-scale ‘clumps’ of material that are much smaller than the stellar radius and denser than the ambient wind (Fig.1). They are believed to arise from shocks developing because of the intrinsically unstable nature of radiatively-driven winds. As the winds of OB stars are also driven by radiation pressure, the same kind of situation is expected in these objects. This issue received considerable attention, as the amount of clumping strongly impacts on the determination of the mass-loss rates and therefore on the evolution of massive stars (e.g. Puls et al. 2008).
Fig.1 : Schematic representation of clumps in the wind of a massive star (adapted from Ducci et al. 2009).
However, direct evidence for these clumps has only been found in a handful of OB stars. Small emission subpeaks moving on a characteristic wind flow time (a few hours) across the line profile from the centre to the wings are usually taken as evidence for clumps of material carried away by the wind. Such travelling subpeaks are quite subtle and difficult to confidently trace in OB stars because their wind (and therefore the strength of the lines formed in it) is much weaker than in Wolf-Rayet stars. The paucity of detections can hence be
understood by the quality of the observations required, which involves obtaining spectra with a very high spectral resolution and signal-to-noise ratio (S/N) with a cadence of a few minutes only. One of the most convincing pieces of evidence for the existence of clumps in the winds of O stars has been provided by the monitoring by Eversberg et al. (1998) over two nights of the bright O4 I(n)f supergiant ζ Puppis (V ~ 2.2 mag) using the Canada-France-Hawaii Telescope (CFHT – 3.6 m). To stress once again the difficulty of the task, the observations consisted of spectra with S/N ~ 1000 and a resolving power R ~ 80,000 per two pixel resolution taken with a time sampling of ~10 minutes (Fig.2).
Fig.2 : Residuals of He II λ4686 (the individual profiles minus the mean profile) for ζ Puppis during one night of observation. The vertical axis gives the time of observation. The scale for the residual intensities is indicated. Dashed lines trace the movement of the extra-emission components (Eversberg et al. 1998).
3. Large-scale structures
3.1. Origin and properties
Observations in the ultraviolet (UV) domain mostly carried out with the International Ultraviolet Explorer (IUE) satellite have shown that strong line-profile variations are ubiquitous in OB stars (Howarth & Prinja 1989). Two main types of recurrent phenomena can be seen in the absorption troughs of unsaturated P Cygni UV profiles: narrow absorption components slowly evolving towards the blue edge of the profile (the so-called ‘discrete absorption components’; DACs) and global intensity modulations. Figure 3 shows an example of the variations observed in the form of a gray-scale, dynamical spectrum where the spectra
are stacked as a function of time and had a reference spectrum (often the mean of the observing run) subtracted, such that bright and dark features represent relative excess and deficit of flux at a given position across the profile, respectively. This kind of representation allows one to easily follow the time evolution of even very subtle features.
A key property of the DACs is that they occur with a recurrence timescale proportional to the (projected) rotational velocity, suggesting that they are somehow linked to stellar rotation (e.g. Prinja 1988). Although several aspects of the variability are still not well understood, the broad characteristics and repetitive nature of the variations are best explained in the framework of a model where one observes the rotational modulation of a globally anisotropic wind made up of spiral arms, as sketched in Fig.4.
Fig.3 : Dynamical spectrum of the Si IV λλ1393, 1402 resonance doublet in the B0.5 Ib star HD 64760. Time increases upwards and excess absorption appears darker. The bottom panel shows the mean profile (Massa et al. 1995). The blue and red boxes delineate the DAC and modulations, respectively.
Hydrodynamical simulations show that the wind emerging from a bright ‘spot’ at the surface would be stronger and slower, as a result of the increase of the radiative force that leads to more driving (the inverse situation is encountered for a dark spot). Interestingly, such base disturbances would indeed give rise to huge corotating spiral structures that are curved because the star is rotating (Fig.4; Cranmer & Owocki 1996).2 These structures must be regarded as a wave pattern through which the wind particles move nearly radially. The high-density stream collides with the unperturbed wind at several radii and shocks are expected to
2
Animations are available from Alex Lobel’s WEB page:http://www.astro.oma.be/HOTSTAR/CIR/CIR.html..
develop at this location. In analogy with the situation for the Sun, where such wind streams also exist, these structures are called ‘corotating interaction regions’ (CIRs).
Theoretical arguments thus suggest that the development of the CIRs is the natural consequence of the mere existence of spatially localized regions at the surface with physical conditions deviating from those of the rest of the photosphere. In addition, it has been argued that relatively large spots (opening angle of ~25°), but with only a modest brightness contrast (~15%) are able to reproduce the observations of some key objects (Lobel & Blomme 2008). This would explain why large-scale structures are apparently so commonplace in the winds of massive stars. The obvious and interesting question is then what phenomenon could divide the stellar surface into regions with distinct physical conditions. Two (non-mutually exclusive) culprits naturally come to mind: pulsations and magnetic fields.
Fig.4 : Schematic representation of spiral structures in the wind of a massive star resulting from four bright, equally-spaced spots on the surface. The streams are curved because of the rotation of the star (anticlockwise in this case). Violet regions have the highest density. Note the size of these structures (several stellar radii). Courtesy S. R. Cranmer (Harvard-Smithsonian Center for Astrophysics).
3.2. Nature of the ‘seed’ perturbations
3.2.1. Pulsations
Stellar pulsations can come in two flavours: radial or non radial. In the former case, the star is expanding and contracting radially in a regular way. In the latter case, transverse motions also occur and spherical symmetry is no longer preserved during the oscillation cycle. Non-radial pulsations lead to significant variations of the physical conditions (e.g. temperature) across the photosphere. They have been detected in several OB stars and manifest themselves as bumps travelling across the photospheric lines (Fig.5).3 Non-radial pulsations of high order lead to a complex photospheric structure with the stellar surface being divided into various
3
sectors (Fig.6), whereas only a few spiral arms are believed to exist in OB-star winds. However, this difficulty might be overcome if one considers that the interference of the pulsation modes could lead to only a few spots on the stellar surface (Kaufer et al. 2006).
3.2.2. Magnetic fields
Magnetic fields can also schematically take two forms: either localized, ever-changing magnetic structures anchored at the photosphere or a persistent, large-scale field with a simple geometry, which could be a remnant of the star formation process (a ‘fossil’ field).
Fig.5 : Variations of the photospheric Si III λ4553 line in the pulsating B0.5 Ib star HD 64760. Black and white colours represent pseudo-absorption and pseudo-emission features relative to the time-averaged profile in gray, respectively. The time of observation is indicated along the y axis, while the x axis is related to the position across the absorption-line profile. Observations collected with the 2.2-m telescope at ESO with a resolving power of 48,000 (Kaufer et al. 2006).
Fig.6 : Photospheric structure of a star pulsating with high-degree, non-radial modes. Blue and red colours denote regions that are moving towards and away from the observer, respectively (courtesy C. Schrijvers & J. Telting, Astronomical Institute Anton Pannekoek and Nordic Optical Telescope).
The magnetic structures that are found in the Sun and cool stars in general (e.g. cool spots, magnetic loops) are driven by dynamo action in their thick, outer convective envelope. Massive stars are lacking such a convective zone and whether magnetic fields could be generated in situ and sustained is still hotly debated. It is suspected that even relatively weak
surface fields (B < 50 Gauss), that are below the current detection capabilities, can strongly affect the emergence of line-driven flows. If present, such magnetic structures are hence believed to have a significant impact on the wind morphology.
What has instead been detected in several OB stars is a strong, large-scale magnetic field, most often with a simple dipole geometry. The field tends in this case to deflect the wind particles towards the magnetic equator and to lead to an equatorial density enhancement (or even a disk-like structure for very strong fields; ud-Doula & Owocki 2002). Because the field is very often tilted with respect to the rotational axis, strong changes modulated by the rotational period can be observed (Fig.7).
Fig.7 : Modulations according to the rotational period (P ~ 15.4 d) of the Hα line in the young O6 Vpe star θ1
Orionis C. The top panel shows a superposition of all profiles (the strong emission feature is a nebular line), while the bottom panel shows the dynamical spectrum. Observations collected with the 50-cm telescope at ESO with a resolving power of 20,000 (Stahl et al. 1995).
3.3. Observational evidence
Because these spiral structures are carried by stellar rotation, an ever-changing wind morphology is seen by the observer. That not only implies that lines formed in the wind should be strongly variable, but also that the observed profile should be the same every rotation period or, in other words, that the variations should be periodic. Rotational modulation is ultimately what we wish to detect to reveal the existence of the CIRs. In practice, what makes this task difficult is that such large-scale structures may be unstable to the extent that a loss of coherency in the pattern of variability is observed over a few
rotational periods. This means that the detection of a periodic signal is often quite difficult and requires intensive observations.
These structures are best studied in the unsaturated lines present in the UV domain (e.g. Massa et al. 1995). With the demise of IUE, however, such studies now have to be conducted using ground-based optical observations. A few lines, such as He II λ4686 or Hα, are (at least partly) formed in the inner parts of the wind (Fig.8). The strength of the Hα recombination line is proportional to density square, implying that the emission component gets stronger as the mass loss increases. This makes OB supergiants especially attractive targets compared to dwarfs or giants where the lines are all formed in the photosphere or are at most filled in by an emission component. The Hα line is very often strongly in emission in supergiants and is a particularly good probe of the large-scale wind structures in the optical.
Fig.8 : Sketch of the different line-formation regions in the wind of an O star (de Jong et al. 2001).
First detection of Hα changes in an early-type supergiant goes back to the early days of stellar spectroscopy (ο2
CMa; Merrill 1913). Although dramatic line-profile variability has been confirmed to be a widespread phenomenon from much more recent campaigns (Figs.9 and 10), the poor temporal sampling of these observations generally hampers a detailed study of the line-profile variations on a rotational timescale (see also Kaper et al. 1997; Fig.11).
We have therefore decided to launch a more intensive campaign where time-resolved observations would be collected for 22 bright (V < 7.5) B supergiants. The stars have been monitored during 36 nights spread over 6 months in 2001-2002 at Vainu Bappu Observatory (India) using the 40-inch telescope. Strong line-profile variations are observed in almost all the targets. The two best candidates for a periodic signal are HD 14134 (B3 Ia) and HD 42087 (B2.5 Ib) with estimated periods of about 13 and 25 days, respectively. An emission-like episode lasting about one week can clearly be discerned in HD 14134 (Fig.12). What also
makes this star of particular interest is the clear phase-locked nature of the variations. Photometric data taken years apart display the same periodicity within the errors and the light variations are linked to the changes affecting Hα: maximum line emission nearly coincides with maximum light (Fig.13).
Fig.9 : Observations of the Hα line at two different epochs in the B1 Iae star HD 154090. Observations collected with the 2.13-m telescope at Kitt Peak Observatory (Rosendhal 1973).
Fig.10 : Observations of the Hα line at different epochs in the B3 Ia star ο2
CMa. Observations collected with the 2.1 and 2.7-m telescopes at McDonald Observatory with a spectral resolution of 0.2-0.4 Å (Ebbets 1982).
Among others, these two stars have recently been followed up during a 3-month campaign using the 50-cm MONS telescope at Teide Observatory. Cursory inspection of the HD 14134 data provides once again evidence for dramatic variations in Hα. A detailed analysis of the data will allow us to examine whether the periodicity previously found is also present in this dataset and whether the pattern of variability remains coherent over timescales of years.
4. Discussion and perspectives
A better knowledge of the structure of hot-star winds, both on small and large scales, is of importance for issues related to the mass-loss rates and the existence of non-radial pulsations
or surface magnetic fields. Indirect evidence for magnetic structures would be especially valuable considering that the field strengths in OB stars are often below, or at the limit, of the current instrumental capabilities and that, despite much effort from the community, direct detections through spectropolarimetric measurements are still very scarce.
Fig.11 : Variations of the Hα line in the O9.5 Ia star α Cam. The mean profile of the observing run is shown as a dashed line. Observations collected with the 1.52-m telescope at the Observatoire de Haute Provence (OHP) with a resolving power of 70,000 and 35,000 in February and October, respectively (Kaper et al. 1997).
Fig.12 : Variations of the Hα line in HD 14134 (B3 Ia). The date of the observation (HJD-2,452,000) is indicated on the right-hand side of the panel. The bottom panel shows the level of variability at a given position along the spectrum. The mean profile is shown as a dashed line. The reciprocal dispersion is 1.45 Å pixel-1 (Morel et al. 2004).
Clumping is believed to be an universal phenomenon in the winds of OB stars. Although some fundamental properties of these clumps, like their filling factor, remain unfortunately poorly known, their study requires 4-m class telescopes and is therefore difficult to conduct.
Fig.13 : Photometric (open symbols: Hipparcos data; filled symbols: own rescaled B and I observations) and equivalent width variations of the Hα line in HD 14134 (B3 Ia), as a function of phase (P = 12.823 d). From Morel et al. (2004).
On the other hand, there is also considerable evidence that the outflows of massive stars exhibit azimuthally-extended wind structures whose formation is intimately linked to processes taking place at the photosphere. However, much uncertainties about the properties and origin of these structures remain. The variations in the UV domain are quite complex and occur on various timescales that cannot in most cases be clearly linked to stellar rotation (the rotational period can only be gauged in very fast rotators by assuming that they are seen equator-on). It is also conceivable that non-radial pulsations and magnetic fields coexist in some stars, leading to an intricated pattern of variability. The variety of behaviours observed from one star to another can to some extent result from different viewing angles and rotational speeds (e.g. Prinja et al. 2002). In addition, this pattern sometimes changes on long timescales for a given star. In the B0.5 Ib star HD 64760, for instance, a change from 2 to 4 spiral streams was detected in datasets separated by less than 2 years (Fullerton et al. 1997). Estimating the characteristic lifetime of these structures would provide important clues regarding their physical origin. The fact that they are apparently quite long-lived (at least several rotation periods) is remarkable given that line-driven winds are very dynamically unstable and permeated by shocks, as discussed in Section 1.
Due to the current unavailability of UV satellites, further progress will rely on optical observations. Some extensive and remarkable observational studies of the wind variability in B stars have been carried out by members of the astrophysics group of the University of Heidelberg mainly using the 50-cm telescope at the European Southern Observatory (ESO). These impressive datasets have clearly demonstrated that strong line-profile variability is a fundamental property of both early (Schäfer 2000) and late B-type stars (Kaufer et al. 1996a,b). Variations affecting the late B stars are particularly spectacular in some cases (Fig.14). The monitoring of optical wind lines can be regarded as complementary to UV studies, as they probe the inner part of the wind (typically ~1.5 R∗) contrary to the UV features that are formed much farther out (Fig.8). Detecting a periodic pattern in these lines would therefore indicate that the structures extend over much of the wind, already exist at its base and may eventually be rooted at the photosphere. Efforts to detect a periodic behaviour in optical wind lines (usually a few days) have been successful in some instances (e.g. Rauw et al. 2001; Prinja et al. 2001), but such investigations are unfortunately becoming rare owing to the difficulty of conducting such long-term campaigns with existing facilities (see below). Ambitious, coordinated UV and optical observations have importantly revealed a link between the two types of variability and shown that they diagnose the same underlying physical mechanism (Kaper et al. 1997).
Fig.14 : Variations of the Hα line in the B8 Ia star β Ori (Rigel). The top panel shows a superposition of all profiles, while the bottom panel shows the dynamical spectrum. Notice the sudden appearance of a strong, high-velocity absorption component at about JD2449390. Observations collected with the 50-cm telescope at ESO with a resolving power of 20,000 (Kaufer et al. 1996b).
It is believed that CIRs develop because of different boundary conditions at the base of the wind. Considering the ubiquity in OB stars of both pulsations (Fullerton et al. 1996; Kaufer et
al. 1997) and CIRs, it is tempting to associate the two phenomena. However, the pulsation periods are of the order of hours, whereas the wind variations occur on significantly longer timescales of the order of days. Pulsations can still remain a plausible solution if one considers that the interference of pulsation modes can lead to a beat pattern with a period that is compatible with the wind variations (Kaufer et al. 2006; Lobel & Blomme 2008). However, the fact that the DACs recur more frequently in stars with increasing projected rotational velocity cannot be explained in the framework of this model and remains a fundamental difficulty. On the other hand, cyclical photometric variability is commonplace in B supergiants and likely caused by pulsations (e.g. Waelkens et al. 1998), but an investigation of a possible link with the CIRs is still lacking.
Ironically, this is the ease with which the CIRs can be studied in spectroscopy (bright targets, moderate resolution) that makes dedicated observing campaigns so difficult or even virtually impossible to organise with present-day professional facilities: small telescopes are being closed down at the expense of 4- to 8 m-class telescopes mainly focusing on extragalactic studies, and instrumentation is often limited to oversubscribed high-resolution spectrographs suitable for abundance studies or exoplanet searches, for instance. Another difficulty lies in the fact that the rotational periods of B supergiants are often of the order of weeks and prohibitively long runs are therefore needed to sample several rotation periods.
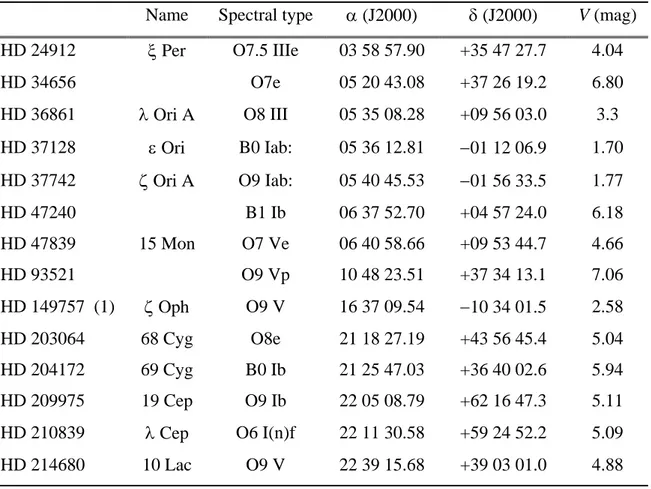
This is why amateur astronomers can make a difference. Luckily, there is no shortage of bright OB supergiants in the northern hemisphere (there are ~25 stars classified as such with V < 6 mag and δ > 0° according to the SIMBAD database4
). The most appealing targets are those with a well-documented variability pattern in the UV domain (which quite understandably also happen to be the brightest among their class). Table 1 lists some of those visible from Belgium. Several stars are unfortunately winter objects, which could make their observation difficult because of adverse weather conditions. Stars exhibiting cyclical photometric variations of the order of days are also good candidates (see Waelkens et al. 1998). Globally aspherical winds are apparently so common in massive stars that strong line-profile variability is almost guaranteed. However, the ultimate goal to make real progress remains the detection of the recurrent changes that can be associated to the CIRs.
4
Acknowledgments: I would like to thank the organizers of the biennial meeting of the Spectroscopy section of the Amateur Astronomy Association Germany (VdS) held in Recklinghausen for giving me the opportunity to attend this enjoyable meeting and for their efforts to bring together the professional and amateur communities, as well as Gregor Rauw for a careful reading of the manuscript. I am also grateful to an anonymous referee for valuable comments. This work is supported by Belspo through a PRODEX GAIA-DPAC contract.
Table 1 : List of OB stars visible from Belgium that have been extensively studied in the UV domain.
Name Spectral type α (J2000) δ (J2000) V (mag) HD 24912 ξ Per O7.5 IIIe 03 58 57.90 +35 47 27.7 4.04
HD 34656 O7e 05 20 43.08 +37 26 19.2 6.80 HD 36861 λ Ori A O8 III 05 35 08.28 +09 56 03.0 3.3 HD 37128 ε Ori B0 Iab: 05 36 12.81 −01 12 06.9 1.70 HD 37742 ζ Ori A O9 Iab: 05 40 45.53 −01 56 33.5 1.77 HD 47240 B1 Ib 06 37 52.70 +04 57 24.0 6.18 HD 47839 15 Mon O7 Ve 06 40 58.66 +09 53 44.7 4.66 HD 93521 O9 Vp 10 48 23.51 +37 34 13.1 7.06 HD 149757 (1) ζ Oph O9 V 16 37 09.54 −10 34 01.5 2.58 HD 203064 68 Cyg O8e 21 18 27.19 +43 56 45.4 5.04 HD 204172 69 Cyg B0 Ib 21 25 47.03 +36 40 02.6 5.94 HD 209975 19 Cep O9 Ib 22 05 08.79 +62 16 47.3 5.11 HD 210839 λ Cep O6 I(n)f 22 11 30.58 +59 24 52.2 5.09 HD 214680 10 Lac O9 V 22 39 15.68 +39 03 01.0 4.88
(1): Only observable at relatively high airmass.
References
• Cranmer, S. R., & Owocki, S. P., 1996, The Astrophysical Journal, 462, 469
• de Jong, J. A., Henrichs, H. F., Kaper, L., et al., 2001, Astronomy & Astrophysics, 368, 601
• Ducci, L., Sidoli, L., Mereghetti, S., Paizis, A., & Romano, P., 2009, Monthly Notices of the Royal Astronomical Society, 398, 2152
• Ebbets, D., 1982, The Astrophysical Journal Supplement Series, 48, 399
• Eversberg, T., Lépine, S., & Moffat, A. F. J., 1998, The Astrophysical Journal, 494, 799
• Fullerton, A. W., Gies, D. R., & Bolton, C. T., 1996, The Astrophysical Journal Supplement Series, 103, 475
• Fullerton, A. W., Massa, D. L., Prinja, R. K., Owocki, S. P., & Cranmer, S. R., 1997, Astronomy & Astrophysics, 327, 699
• Howarth, I. D., & Prinja, R. K., 1989, The Astrophysical Journal Supplement Series, 69, 527
• Kaper, L., Henrichs, H. F., Fullerton, A. W., Ando, H., Bjorkman, K. S., Gies, D. R., Hirata, R., Kambe, E., McDavid, D., & Nichols, J. S., 1997, Astronomy & Astrophysics, 327, 281
• Kaufer, A., Stahl, O., Wolf, B., Gäng, Th., Gummersbach, C. A., Kovács, J., Mandel, H., & Szeifert, Th., 1996a, Astronomy & Astrophysics, 305, 887
• Kaufer, A., Stahl, O., Wolf, B., Gäng, Th., Gummersbach, C. A., Jankovics, I., Kovács, J., Mandel, H., Peitz, J., Rivinius, Th., & Szeifert, Th., 1996b, Astronomy & Astrophysics, 314, 599
• Kaufer, A., Stahl, O., Wolf, B., et al., 1997, Astronomy & Astrophysics, 320, 273 • Kaufer, A., Stahl, O., Prinja, R. K., & Witherick, D., 2006, Astronomy &
Astrophysics, 447, 325
• Lobel, A., & Blomme, R., 2008, The Astrophysical Journal, 678, 408
• Massa, D., Fullerton, A. W., Nichols, J. S., et al., 1995, The Astrophysical Journal, 452, L53
• Merrill, P. W., 1913, Lick Obs. Bull., 7, 162
• Meynet, G., & Maeder, A., 2003, Astronomy & Astrophysics, 404, 975
• Morel, T., Marchenko, S. V., Pati, A. K., Kuppuswamy, K., Carini, M. T., Wood, E., & Zimmerman, R., 2004, Monthly Notices of the Royal Astronomical Society, 351, 552
53
• Prinja, R. K., Stahl, O., Kaufer, A., Colley, S. R., Crowther, P. A., & Wolf, B., 2001, Astronomy & Astrophysics, 367, 891
• Prinja, R. K., Massa, D., & Fullerton, A. W., 2002, Astronomy & Astrophysics, 388, 587
• Puls, J., Vink, J. S., & Najarro, F., 2008, Astronomy & Astrophysics Review, 16, 209 • Rauw, G., Morrison, N. D., Vreux, J.-M., Gosset, E., & Mulliss, C. L., 2001,
Astronomy & Astrophysics, 366, 585 • Rauw, G., 2010, SRSL, in press (Paper I)
• Rosendhal, J. D., 1973, The Astrophysical Journal, 182, 523
• Schäfer, D. R., 2000, Ph.D. Thesis, Ruprecht-Karls-Universität Heidelberg (in German), available at: http://www.lsw.uni-heidelberg.de/projects/hot-stars/PhD_Schaefer.pdf
• Stahl, O., Kaufer, A., Wolf, B., Gäng, Th., Gummersbach, C., Kovács, J., Mandel, H., Rivinius, Th., Szeifert, Th., & Zhao, F., 1995, The Journal of Astronomical data, 1, 3 • Stahl, O., Kaufer, A., Rivinius, Th., et al., 1996, Astronomy & Astrophysics, 312, 539 • ud-Doula, A., & Owocki, S. P., 2002, The Astrophysical Journal, 576, 413
• Waelkens, C., Aerts, C., Kestens, E., Grenon, M., & Eyer, L., 1998, Astronomy & Astrophysics, 330, 215