Detection of diverse mould species growing on building materials by gas
sensor arrays and pattern recognition
*M. Kuskea, M. Padillab, A.C. Romaina, J. Nicolasa, R. Rubiob, S. Marco b
a Département Sciences et Gestion de l'Environnement, Université de Liège, Avenue de Longwy, 185, B6700 Arlon, Belgium b Sistemes d'Instrumentació i Communicacions, Departament d'Electrònica, Universitat de Barcelona, Martí i Franquès 1, 08028
Barcelona, Spain
Abstract: This work explores the detection of moulds growing in different building materials by using a metal
oxide sensor array. Four moulds species have been considered. Pattern classification provides detection rates on the order of 80-85% for different species. Drift degrades only slightly these values subsequent test 4 months later.
Keywords: Gas sensor arrays; Moulds; Sensor arrays; Pattern recognition
1. Introduction
One of the most frequent problems in buildings is the fungal development caused by excessive humidity. Fungal contamination can produce infections, allergies, toxic effects and other symptoms documented in many studies and characteristic for the "sick building syndrome" [1-8].
Traditionally, fungal contamination in a building has been described as quantity of viable spores determined from air, settled dust, surface and building material samples and results of measures are obtained after several days. New methods involves the detection of fungal components, mycotoxins and microbial volatile organic compounds (MVOCs). This is interesting because compounds can penetrate barriers not penetrable by spores, facilitating the detection of hidden moulds. The detection of these compounds was previously carried out by sampling into carbon-based or TENAX adsorbents, and analysing by gas chromatography-mass spectrometry. However this method, very sensitive and specific, requires experience and special laboratory equipment, takes time and is relatively expensive. The electronic nose technology, in difference with gas chromatography, is simpler, cheaper, and the results can be obtained in situ.
Moulds produce a wide range of MVOCs: alcohols, ketones, terpenes, esters and sulphur compounds [9-11]. The production depends on environmental conditions, the species and the substrate on which the fungi grow [12-17]. However, no single VOC seems to be a reliable indicator of biocontamination [18]. For this reason fungal detection cannot be based on a single substance but on the coexistence of several compounds.
The authors have already addressed the detection of a single mould species, namely Aspergillus versicolor, in a previous paper [19]. In that paper a table with a detailed list of VOCs produced by moulds can be found. Here this work will be completed with more extensive measurements involving three additional mould species:
Penicillium aurantiogriseum, Penicillium chrysogenum and Cladosporium sphaerospermum.
Fungal detection using electronic noses has been previously addressed. Schiffman et al. [20] studied the ability of electronic noses to detect moulds inside buildings. An array of 15 metal oxide sensors was capable of discriminating among the fungi and it was also able to recognise selected five volatile organic compounds emitted by fungi [21] studies showed that a conducting polymer sensor array was able to distinguish the volatile patterns produced by three species of moulds growing on three types of paper, permitting the early detection of fungal contamination in library materials and archives [22] predicts the potential of electronic noses for
improving the possibility to detect individual fungal species as well as the degree of mycotoxin contamination of food and animal feeds [23]. Investigated the possibility of detecting fungal volatile metabolites as indicators of mycotoxins in cereal grain, using both an electronic nose and gas chromatography combined with mass spectrometry (GC-MS). Other studies [24-27] showed that sensor arrays and different techniques of statistical analysis allow detecting and classifying selected fungal species growing on cereals. These techniques can be used for quality classification of grain. An e-nose used by Persaud et al. [28] could discriminate between wood
infected by Serpula lacrimans and uninfected samples. And [29] compared two electronic nose systems employing conducting polymer sensor arrays for the early detection and discrimination between bacterial species, fungal spores and trace amounts of pesticides. In this paper, the capability of a metal oxide gas sensor array to detect the presence of diverse mould species growing on a variety of building materials is investigated. Section 2 presents the materials and methods used in this work. Section 3 presents the methodology for pattern analysis. Section 4 presents the obtained results and finally Section 5 draws some conclusions.
2. Materials and methods
An electronic nose instrument was designed and constructed at the Université de Liege. It consists of a sampling unit, a sensor array, and a signal processing system (Figs. 1 and 2). The gas sensor array contains 12 metal oxide sensors in two separate chambers placed in parallel. Each sensor chamber has a volume of 210 cm3. The sensors were selected in order to obtain different responses for volatile compounds produced by moulds. Six of them were manufactured by Capteur; CAP01, CAP03, CAP06, CAP07, CAP23, CAP25, and six from Figaro; TGS2620, TGS2180, TGS825, TGS822, TGS2600, TGS2602.
Four different materials typical of Belgian houses were used as substrates for mould growing: plasterboard, particleboard (or chipboard), oriented strain board and wallpaper. Some combinations of them were also analysed; plasterboard with wallpaper and glue, particleboard with wallpaper and glue and oriented strain board with wallpaper and glue. The four fungal species were separately incubated on culture medium, Malt Extract Agar, for 1 week. After this period, moulds were inoculated into the building materials. Contaminated samples were incubated in airtight glass jars (500 ml) closed with a Teflon cover. Each jar contained two pieces of the same material of dimensions 5 cm x 6 cm contaminated with one fungal species and 40 ml of demineralised water in its bottom, for keeping the high degree of humidity that moulds need to grow. The samples were placed on top of small glass vials to avoid direct contact with water. The jars were kept at room temperature in the darkness during the whole duration of the experiments.
For each fungal species, two sequential experiments were carried out, resulting in two datasets comprising the growth of the moulds during 4 months. Clean and contaminated materials (corresponding to different species) were randomly presented to the gas sensor array during this time. Contaminated samples were presented in order according to the species of moulds, in this way firsts sets of A. versicolor followed by P. chrysogenum were firstly measured, and then seconds sets of both species in the same order. After that first sets of
C. sphaerospermum followed by P. aurantiogriseum were presented to the electronic nose and finally seconds
sets of the two species were measured in the same order. The contents of all datasets are summarized in Table 1. The electronic nose has the following operation; clean dry air is fed to a mass flow controller, then to a
humidifier and then to a jar with samples to sweep the volatiles accumulated in the headspace. Two three-way valves commute clean air or the jar headspace to the gas sensors chambers (see Fig. 1). A sample cycle included a passage of clean humidified air (reference air), followed by a passage of air from the samples during 3 min (time of signal stabilisation) at 200 ml/min of constant air flow.
Fig. 2: Picture of the actual experimental setup showing the bubbler, the jar under analysis, the mass flow controller and the sensor chambers.
3. Signal and data processing
The sensor signals were preprocessed by taking the ratio of the resistance at the end of the sampling period (3 min) and the baseline resistance, just before sampling when exposed to the vapour saturated carrier gas. In this way every measurement was constructed with 12 sensors signals, assembling a 12 dimensional vector. However two sensors (CAP23 and TGS2180) were removed because of deficient behavior observed by visual inspection of the sensor patterns, therefore the formed pattern vector has 10 dimensions.
Table 1: Number of clean and contaminated samples for each substrate material and specie of mould in the two datasets
Type of mould
A. versicolor P. chrysogenum C. sphaerospermum P. aurantiogriseum
Materials Samples First set Second set First set Second set First set Second set First set Second set Clean 27 16 21 22 15 20 15 26 Oriented strain board Contaminated 27 16 11 18 16 16 12 12 Clean 27 16 21 22 18 22 15 27 Plasterboard Contaminated 27 16 11 18 16 17 15 11 Clean 27 15 21 21 16 19 14 27 Particleboard Contaminated 25 16 11 18 17 17 15 12 Clean 17 8 14 11 7 10 8 13 Wallpaper Contaminated 17 8 7 8 9 7 7 7 Clean 98 55 77 76 56 71 52 93 Total Contaminated 96 56 40 62 58 57 49 42
As already mentioned, two datasets were collected for this study for each species. First dataset was used for all the data processing algorithm development, and the second one for a posterior evaluation (including the evaluation of drift), since it was collected 4 months after the first one.
For validation of the classifier results on first dataset the following strategy has been followed. This dataset (for each mould species or all together) has been divided in two equally sized random partitions. One part has been used for classifier design and optimization while the second half is used for classifier testing. This process is repeated ten times and the average classification rate is retained. Also the standard deviation of the classification rate is estimated.
Later, the robustness of the electronic nose for mould detection was tested by including a wide variety of moulds and building materials. Classification of each specie of mould is considered, as well as the capability of a classifier to generalize to unknown mould species (not present in the training set). Finally also the classification of samples with an unknown substrate was explored.
Our primary objective was the binary classification of moulds and no-moulds disregarding the particular fungal species and the substrate material. For this purpose a Mahalanobis classifier was applied on the raw data. The obtained results are on the same order than the ones seen in the previous paper [19]. Although the same classifiers as in [19] were considered; namely k-NN, fuzzy-kNN with different initial membership functions on dimensional reduced space and on raw data (a review of Fuzzy k-NN can be found in our previous paper [19]) we found that the application of complex classifiers on our small database did not provide any advantage; the obtained classification rates were not in general better than the ones obtained using the Mahalanobis classifier. For this reason only the Mahalanobis results are reported in this paper.
4. Results
A PCA loadings plot on first two principal components (Fig. 3), for the ensemble of all moulds, shows one group of five Figaro sensors and one Capteur sensor on the left hand side and two groups of two Capteur sensors on the right. PCA loadings plots for every specie of moulds are almost the same. Signals provided by the five Figaro sensors (series TGS) are very similar and anti-correlated to Capteur sensors signals on the first principal component (except for CAP01). CAP01 signal is interesting because it varies inversely with the rest of Capteur sensors on PC1 and with all Figaro sensors on PC2. CAP03 and CAP25 are not very significant for PC2, the rest of sensors gives information to both first two principal components. This loading plot also shows that Figaro sensors are more correlated among them than Capteur sensors, at least for this application.
Fig. 3: PCA projection, loadings plot for all moulds together. Samples from first set of all moulds. PC1 and PC2 explains 82.27% and 10.88% of variance respectively. The points corresponds to the five Figaro sensors and the plus symbol represent the Capteur sensors.
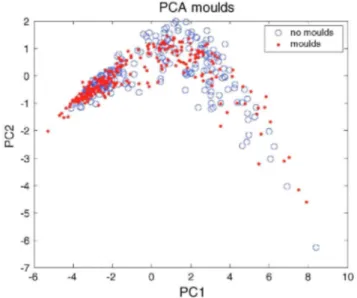
A PCA projection, a scores plot in the first and second principal components, seems to indicate that the classes (contaminated/clean) are no linearly separable, non-gaussian and multi-modal (Fig. 4). Multi-modality clearly arises from the presence of different substrate materials. In fact, visual exploration of the results shows that the influence of the substrate is much larger than the influence of the presence of moulds. Fig. 5 shows the
distribution of the four substrates on the same PCA projection than Fig. 4. The distribution of materials seems to be more separable than the contaminated and clean classes in Fig. 4. Wallpaper and particleboard are mixed between them but separated from oriented strain board and plasterboard. Due to the important background variability the detection of moulds becomes a difficult problem.
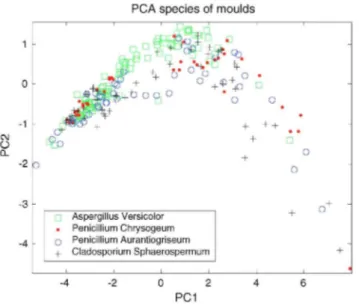
In Fig. 6 the distribution of species of moulds on the PCA projection is observed, the four types of moulds are completely mixed so we can think that the classifications rates of each specie will be similar. This can be seen in Table 2, where the obtained classification rates for every type of mould are shown. All results are on the same
order, with small differences. From these results we can also think that the detection of a specie of mould not present in the training set is possible.
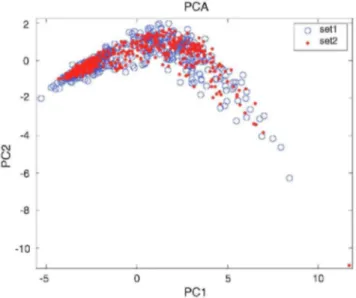
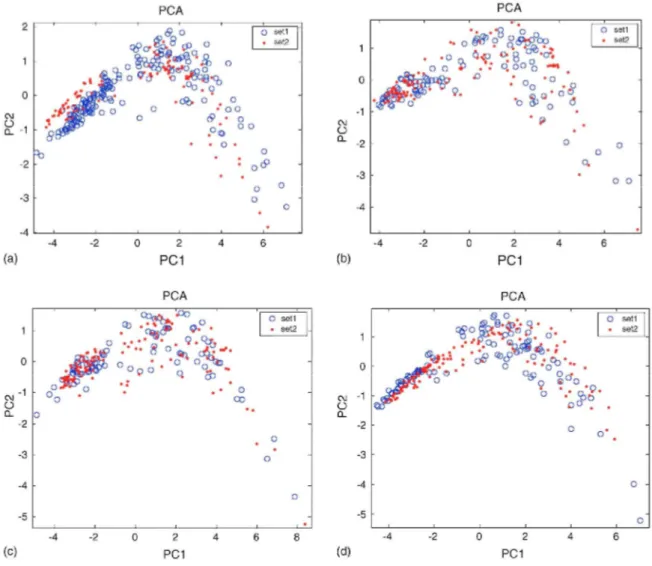
To study the stability of the classifier a second experiment for each specie of mould was performed in the same conditions as the first one resulting in a second dataset. This experiment started 4 months after the first one and was carried out during more than 3 months. The Mahalanobis classifiers built with firsts datasets were used to classify the samples from the second datasets. Table 2 shows the obtained classification rates for every type of mould and all moulds together. These results show in every case a decrease in the classification ability that can be attributed to the sensors drift. Sensors ageing or the change in the average room temperature can be the main reasons of the small changes in the sensors responses. Fig. 7 shows a PCA projection on the model made from first dataset on two first principal components, for both datasets and for all moulds. For every type of mould the structure of the second dataset is similar to the one from first experiment, but a slight drift can be observed (Fig. 8).
Fig. 4: PCA projection. Samples from first set of all moulds. PC1 and PC2 explains 82.27% and 10.88% of variance respectively.
Fig. 5: Same PCA projection as in Fig. 4. Samples from first set of all mould. Each color represents different substrate; plasterboard, particleboard, oriented strain board, wallpaper.
Fig. 6: Same PCA projection as in Fig. 4 regarding the four different species of moulds on first dataset of every mould.
Table 2: Classification rates for every specie of mould and all moulds together, on first and second datasets
Type of mould First set (%) Second set (%)
All moulds together 84 ± 1 81
P. chrysogenum 80 ± 3 76
A. versicolor 84 ± 2 77
C. sphaerospermum 80 ± 7 55
P. aurantiogriseum 83 ± 5 65
In 'first set' Mahalanobis model was built with half of the first dataset and validated with the other half of first dataset, this was repeated 10 times making random subsampling. In 'second set' the model was constructed with the completed first dataset and validated with the second dataset.
Table 3: Classification of a specie of mould not considered in the training samples
Train samples (three species of moulds) Validation samples C.R. (%)
A. versicolor + C. sphaerospermum + P. aurantiogriseum P. chrysogenum 78
C. sphaerospermum + P. aurantiogriseum + P. chrysogenum A. versicolor 86
P. aurantiogriseum + A. versicolor+P. chrysogenum C. sphaerospermum 76
A. versicolor + C. sphaerospermum + P. chrysogenum P. aurantiogriseum 73
One point to remark is that the most important decrease appears in mould C. sphaerospermum, which is the specie that presents the highest standard deviation in the classification of its first set. This mould presents a classification rate of only 55%, which means that this classifier is unable to differentiate moulds and clean materials under drift conditions. C. sphaerospermum is especially sensible to sensors drift, therefore drift depends on data.
The classifier ability to detect an unknown specie of mould is shown in Table 3. This table shows the obtained results for classification of firsts datasets of every mould. The detection of a type of mould not present in the training set is possible, but it depends on the specie of mould being classified. The algorithm is able to detect A.
versicolor a 13% better than P. aurantiogriseum, this is not a very big difference but it is desirable, for having
the best classifications results, to consider as many different species of moulds as possible in the design of the classifier.
Fig. 7: PCA projection from first set of all moulds. Points are samples from second set of all moulds, circles are samples from first set of all mould. PC1 and PC2 explains 82.27% and 10.88% of variance respectively.
Table 4: Classification of moulds growing on substrates not considered in the training samples
Train samples (three species of material) Validation samples C.R. (%)
osb + cb + pb Wallpaper (wp) 67
osb + cb + wp Plasterboard (pb) 69
osb + wp + pb Chipboard (cb) 86
wp + cb + pb Oriented strain board (osb) 78
The larger influence of the substrate materials on the detection of moulds can be seen in Table 4. This table shows the classification of samples from first sets containing building materials not present in the training set. Classification rate of wallpaper samples is 67% whereas the one for chipboard is a 19% bigger. This difference between the best and the worst classified samples is bigger in the case of detection of substrate materials than in the case of detection of different species of moulds. Therefore, to design a good classifier is more important to have a training set that contains many growing substrates than many types of moulds.
Table 5 shows how the substrate materials influence the detection of moulds. A big difference between the classification rates of samples containing only wallpaper (74%) and only chipboard (89%) can be appreciated, while differences in classification rate for the various types of fungi are very small (4%). Drift also affects the classification results obtained 4 months after depending on the building material.
Although we expect that the classification rates would be improved in case of considering only one specie of mould and one type of substrate, due to the lack of samples in our small database this cannot be demonstrated. Having only a few samples in each case causes problems with the 'course of dimensionality'.
Table 5: Classification of moulds according to growing substrates
Type of material First set (%) Second set (%)
Wallpaper 74 ± 6 72
Plasterboard 83 ± 4 71
Chipboard 89 ± 3 82
Oriented strain board 85 ± 4 72
Fig. 8: Effect of sensors drift on a PCA projection of the two datasets on first set PCA model for every specie of mould, (a) A. versicolor PCI 81.16%, PC2 11.98% variance explained, (b) C. sphaerospermum PC1 86.19%, PC2 8.66%. (c) P. aurantiogriseum PC1 86.11%, PC2 8.32%. (d) P. chrysogenum PC1 81.61%, PC2 11.51%.
5. Conclusions
In this work an electronic nose has been able to detect four species of moulds growing on several building materials with a Mahalanobis classifier, obtaining an accuracy between 80 and 85%. The use of other more complexes classifiers gave no much better results, possibly this is due to the small size of our database.
The system is able to detect unknown species of mould with accuracy between 73% and 86%, depending on the specie of mould. It can also detect contaminated samples of unknown building materials, depending also on the type of material. The obtained minimum accuracy was 67% for wallpaper samples and the maximum was 86% for chipboard. This accuracy is worse than the one for the detection of unknown moulds because, as seen in Fig. 5, the influence of the substrate materials is bigger than the influence of the different species of moulds.
The stability of the designed classifier was tested with an experiment made in the same conditions but 4 months later, in which a second set of data was collected. The observed drift effect on the sensors depends on the specie of mould that is being classified; A. versicolor has a classification rate of 77% while C. sphaerospermum has 55%. However the obtained result for the set made from all moulds was 81%, so, in general, the sensors drift causes a small degradation without any further recalibration of the system.
However, due to the modest values of classification rate we consider that such a system could only be used for screening purposes followed for a more detailed analysis using alternative analytical techniques.
Acknowledgements
Spanish team has been funded by Cycit DPI2001-3213-C02-01 and Generalitat de Catalunya ACI2003-13. Belgian team has been funded by Region Wallone. One of the authors R.R. also acknowledges a PhD grant from the Spanish Ministry of Science and Technology. The assistance of CERTECH is also acknowledged.
References
[1] B. Brunekreff, A.P. Verhoeff, R.T. van Strien, J.H. Wijnen, Home dampness and childhood respiratory symptoms: the role of sensitization to dust mites and moulds, in: Samson, et al. (Eds.), Health Implications of Fungi in Indoor Environments, 1994, pp. 189-199. [2] E. Johanning, R. Biagini, D. Hull, P. Morey, B. Jarvis, P. Landsber-gis, Health and immunology study following exposure to toxigenic fungi (Stachybotrys chartarum) in a water-damaged office environment, Int. Arch. Occup. Environ. Health 68 (1996) 207-218.
[3] K. Klanova, The concentrations of mixed populations of fungi in indoor air: rooms with and without mould problems; rooms with and without health complaints, Central Eur. J. Public Health 8 (2000) 59-61.
[4] O. Koskinen, T. Husman, A. Hyvärinen, T. Reponen, A. Nevalainen, Two moldy day-care centers: a follow-up study of respiratory symptoms and infections, Indoor Air 7 (1997) 67-76.
[5] D. Norback, G. Wieslander, K. Nordstrom, R. Walinder, Asthma symptoms in relation to measured building dampness in upper concrete floor construction, and 2-ethyl- 1-hexanol in indoor air, Int. J. Tuberculosis Lung Dis. 4 (2000) 1016-1025.
[6] R. Walinder, D. Norback, G. Johanson, Pulmonary reactions after exposure to 3-methylfuran vapour, afungal metabolite, Int. J. Tuberculosis Lung Dis. 2(1998) 1037-1039.
[7] G.H. Wang, C.S. Li, Indoor endotoxin and glucanin association with airway inflammation and systemic symptoms, Arch. Environ. Health 54 (1999) 172-179.
[8] C.E. Wilson, Sudden infant death syndrome and Canadian aboriginals: bacteria and infections, FEMS Immunol. Med. Microbiol. 25 (1999) 221-226.
[9] G. Fischer, T. Muller, R. Schwalbe, R. Ostrowski, W. Dott, Exposure to airborne fungi, MVOC and mycotoxins in biowaste-handling facilities, Int. J. Hygiene Environ. Health 203 (2000) 97-104.
[10] H. Kiviranta, A. Tuomainen, M. Reiman, S. Laitinen, J. Liesivuori, A. Nevalainen, Qualitative identification of volatile metabolites from two fungi and three bacteria species cultivated on two media, Central Eur. J. Public Health 6 (1998) 296-299.
[11] A.L. Sunesson, C.A. Nilsson, B. Andersson, G. Blomquist, Volatile metabolites produced by two fungal species cultivated on building materials, Ann. Occup. Hygiene 40 (1996) 397-410.
[12] J. Bjurman, J. Kristensson, Volatile production by Aspergillus versicolor as a possible cause of odor in houses affected by fungi, Mycopathologia 118(1992) 173-178.
[13] T. Borjesson, U. Stollman, J. Schnurer, Volatile metabolites and other indicators of Penicillium aurantiogriseum growth on different substrates, Appl. Environ. Microbiol. 56 (1990) 3705-3710.
[14] K. Fiedler, E. Schutz, S. Geh, Detection of microbial volatile organic compounds (MVOCs) produced by moulds on various materials, Int. J. Hygiene Environ. Health 204 (2001) 2-3.
[15] W. Horner, A. Worthan, B. Epstein, M. Black, MVOC emission patterns of indoor fungi: strain and culture differences, 1999, Online http://www.aiha.org/abs99/9pos3.html.
[16] A. Korpi, A.-L. Pasanen, H. Viitanen, Volatile metabolites of Serpula lacry-mans, Coniophora puteana, Poria placenta, Stachybotrys chartarum and Chaetomium globosum, Build. Environ. 34 (1999) 205-211.
[17] L.J. Rose, R.B. Simmons, S.A. Crow, D.G. Ahearn, Volatile organic compounds associated with microbial growth in automobile air conditioning systems, Curr. Microbiol. 41 (2000) 206-209.
[18] A. Korpi, A.-L. Pasanen, P. Pasanen, Volatile compounds originating from mixed microbial cultures on building materials under various humidity conditions, Appl. Environ. Microbiol. 64 (1998) 2914-2919.
[19] M. Kuske, R. Rubio, A.C. Romain, J. Nicolas, S. Marco, Fuzzy k-NN applied to moulds detection, Sens. Actuators B: Chem. 106 (1) (2005) 52-60.
[20] S.S. Schiffman, D.W. Wyrick, G.A. Payne, G. O'Brian, H.T. Nagle, Effectiveness of an electronic nose for monitoring bacterial and fungal growth, in: Proceedings of the ISOEN, Brighton, July 20-24, 2000, pp. 173-180.
[21] O. Canhoto, F. Pinzari, C. Fanelli, N. Magan, Application of electronic nose technology for the detection of fungal contamination in library paper, Int. Biodeterior. Biodegrad. 54 (4) (2004) 303-309.
[22] J. Schnurer, J. Olsson, T. Borjesson, Fungal volatiles as indicators of food and feeds spoilage, Fungal Genet. Biol. 27 (2/3) (1999) 209-217.
[23] J. Olsson, T. Borjesson, T. Lundstedt, J. Schnurer, Detection and quantification of ochratoxin A and deoxynivalenol in barley grains by GC-MS and electronic nose, Int. J. Food Microbiol. 72 (3/5) (2002) 203-214.
[24] J. Olsson, T. Borjesson, T. Lundstedt, J. Schnurer, Volatiles for myco-logical quality grading of barley grains: determinations using gas chromatography-mass spectrometry and electronic nose, Int. J. Food Microbiol. 59 (2000) 167-178.
[25] A. Jonnson, F. Winquist, J. Schnurer, H. Sundgren, I. Lundstrom, Electronic nose for microbial quality classification of grains, Int. J. Food Microbiol. 35 (1997) 187-193.
[26] G. Keshri, N. Magan, P. Voysey, Use of an electronic nose for the early detection and differentiation between spoilage fungi, Lett. Appl. Microbiol. 27 (1998) 261-264.
[27] G. Keshri, N. Magan, Detection and differentiation between mycotoxi-genic and non-mycotoxigenic strains of two Fusarium spp. using volatile production profiles and hydrolytic enzymes, J. Appl. Microbiol. 89 (2000) 825-833.
[28] K.C. Persaud, P.D. Wareham, P.A. Payne, H. Chueh, J.V. Hatfield, A portable electronic nose for dry rot detection, in: Actes des conferences La métrologie des odeurs et les nez électroniques, Eurodeur-Airodeur, Paris, 2001.
[29] N. Canhoto, Magan, Electronic nose technology for the detection of microbial and chemical contamination of potable water, Sens. Actuators B: Chem. 106 (1) (2005) 3-6.
Biographies
Martyna Kuske is Doctor of medicine from the University of Warsaw (1990). She received the master in
Environmental Sciences in 1999 and the DEA from FUL in 2000. Since 2000 she works on mould detection in the frame of a Ph.D. thesis at FUL, which is now the department "Environmental Sciences and Management" of the University of Liège. She is also involved in the diagnosis of "Indoor Air Pollution" in the frame of a contract with the official local service of intervention of the Belgian province of Luxembourg.
Marta Padilla was born in Sta. Cruz de Tenerife, Spain, on 1973. She received a degree in Physics from the
University of La Laguna in 1999 and a degree in Electronic Engineering from University of Barcelona in 2003. In the same year she joined the ISPlab as a Ph.D. student.
Anne-Claude Romain graduated in chemical sciences from the University of Liège (Ulg, Belgium) in 1992. She
received the master in Environmental Sciences from the Fondation Universitaire Luxembourgeoise of Arlon (FUL, Belgium) in 1993. Since 1995, she is a searcher at FUL, which became in 2004 the department "Environmental Sciences and Management" of the University of Liège. She has been working on the
development of a malodour detector. Currently, she finishes a Ph.D. thesis on the application of the electronic nose concept to the monitoring of odours in the environment.
Jacques Nicolas is Engineer in Physics. He received his Ph.D. degree in 1977 in Surface Physics in University
of Louvain, Belgium. He joined Fondation Universitaire Luxembourgeoise (FUL, Arlon, Belgium) in 1979, where he worked first on Solar Energy. He is currently the leader of the research group "Environmental
Monitoring" in the department "Environmental Sciences and Management" of the University of Liège. He gives lectures in the field of environmental parameter measurement. His main research interest is the development of odour and indoor air pollution detectors usable in the field.
Rafael Rubio was born in Madrid, Spain, on 1978. He received his B.S. and degree in physics from the
University of Barcelona in 2001. In 2002 he joined the ISPlab as a Ph.D. student. His areas of interest are the signal processing applied to gas sensors, MEMS and IR gas detection.
Santiago Marco Colas was born in Berga in 1965. Degree (1988) and Doctor in Physics (1993) at the
University of Barcelona doing research on pressure sensors for biomedical uses which took place at the Centre Nacional de Microelectrònica. In 1994 he was post-doc at the University of Rome "Tor Vergata" working on intelligent signal processing. Since 1995 he's an Associate Professor at the UB. His experience is centered in microsystem modelisation, and in signal processing-based intelligent instrumentation.