Study of Molecular Interactions and Surface Alignment
Control of Liquid Crystals
Thèse
Amalya Minasyan
Doctorat en physique
Philosophiae doctor (Ph.D.)
Québec, Canada
© Amalya Minasyan, 2015
Résumé
Le contrôle de l’alignement des molécules de cristaux liquides (CL) est d’une importance majeure pour la plupart des applications électro-optique comme les afficheurs, les modulateurs et les atténuateurs variables. Ce contrôle est réalisé plus spécifiquement par les interactions entre les molécules de CL et la surface adjacente. L’alignement par la surface est ainsi un des facteurs clés pour l’amélioration des performances des systèmes basés sur les CL. Cette thèse rapporte une étude expérimentale sur le contrôle de l’alignement des molécules de CL par la surface, et explore des avenues pratiques.
Dans un premier temps, des CL nématiques à double fréquence (DF-NLC) et des films minces de mésogènes réactifs (MR) déposés sur la surface intérieure d’une cellule, ont été utilisés pour produire des structures polymères stabilisées en surface. Pour former ces structures, une interpénétration partielle entre les molécules de CL et de MR a été réalisée pendant l’application d’un couple diélectrique (positif ou négatif) sur le système de matériau. Après une courte période d’interpénétration entre la couche de MR et les CL, une exposition UV a été appliquée pour polymériser totalement le système de matériau. Ces systèmes ont démontré un fort potentiel pour le contrôle de l’alignement des CL par la surface. Ils permettent la « programmation » de cellule de CL présentant une diffusion de la lumière électriquement contrôlable, pouvant être utilisé dans des applications telles que des fenêtres intimités et l’éclairage intelligent. Des analyses électro-optiques et microscopiques ont été faites pour caractériser ces structures. Nous avons montré que les modulations de contraste de la lumière diffusée, ainsi que la dépendance de la polarisation et les temps de réponses peuvent être améliorées de façon notable par le contrôle à double fréquence.
Dans un deuxième temps, des CL chiraux double fréquence (DF-CLC) ont été utilisé pour produire des structures stabilisées en surface, qui, en addition d’une diffusion contrôlable, ont montré des phénomènes de réflexion résonante. Des couches de MR orientées et partiellement polymérisées furent utilisées comme couche d’alignement pour les DF-CLC. Le rôle du temps de pré-polymérisation des MR sur les propriétés des cellules ont été étudiées par des analyses électro-optiques et spectroscopiques. Nos études morphologiques
ont démontré que l’interdiffusion des molécules entre la couche de MR et le volume des CL durant le procédé de programmation génère des agrégats polymères sur les surfaces internes de la cellule, qui sont à l’origine de la diffusion contrôlable de la lumière.
Abstract
The alignment control of liquid crystal (LC) molecules is of great importance for the most of LC based electro-optical applications such as displays, modulators, and variable attenuators. This control realises, particularly, by the interactions between LC molecules and the adjacent surface. This makes the surface alignment one of the key factors for the improvement of LC-based devices’ performance. This PhD thesis reports an experimental study of alignment control of LC molecules by surfaces, and explores the possibility of practical avenues.
First, dual frequency nematic LCs (DF-NLC) and thin reactive mesogen (RM) films, cast on internal surfaces of cell substrate, were used to build surface polymer stabilized structures. To form these surface-stabilized structures, a partial interpenetration between the LC and RM molecules was allowed while applying an orienting dielectric torque (positive or negative) to the material system. Then, after a short interpenetration period between the RM layer and the bulk LC, UV exposition was added to definitely cure the material system. These systems demonstrated great potential for the surface alignment control of LCs, enabling the ‘‘programming’’ of LC cells with electrically controllable light scattering, which can be used in privacy windows and smart lighting applications. Electro-optic and microscopic studies were done to characterize these surface-stabilized structures. We showed that the contrasts of light scatter modulation, polarization dependence and response times can be noticeably improved by the dual-frequency control.
Afterward, dual frequency chiral LCs (DF-CLC) were used to build surface-stabilized structures, which in addition to the controllable scattering, showed also resonant reflection phenomenon. Partially cured and oriented RM layers were used as alignment layers for DF-CLC. The role of the pre-curing duration of RM in the behavior of the cell was observed by electro-optical and spectroscopic studies. Our morphological studies showed that the molecular interdiffusion between RM layer and bulk LC during the programming process generates polymer aggregates on the cell’s internal surfaces, which are at the origin of formation of controllable light scattering.
Table of Contents
Résumé ... iii
Abstract ... v
Table of Contents ... vii
List of Figures ... ix Remerciements ... xvii Foreword ... xix Chapter 1 Introduction ... 1 1.1 Objectives ... 4 1.2 Thesis structure ... 6
Chapter 2 Introduction to Liquid Crystals ... 7
2.1 Liquid crystals ... 7
2.2 Nematic and cholesteric phases ... 12
2.3 Properties of liquid crystals ... 14
2.3.1 Optical anisotropy ... 14
2.3.2 Dielectric anisotropy ... 16
2.3.3 Elasticity ... 19
2.4 Alignment by surfaces ... 20
2.5 Field induced reorientation: Electro-optical effect ... 24
2.6 Light scattering in liquid crystals ... 28
Chapter 3 Thin Orienting Surface Layers with Azobenzen Dyes ... 31
3.1 Introduction ... 35
3.2 Material systems and samples ... 37
3.3 Photo sensitivity study in two anisotropy matrices ... 38
3.4 Photo sensitivity study in a polymer matrix ... 44
3.5 Summary and conclusions... 47
4.1 Introduction ... 55
4.2 Materials and Methods ... 56
4.3 Experimental Setup and Process... 58
4.4 Stationary Mode Characterization ... 60
4.5 Dynamic Characterization ... 65
4.6 Discussion ... 67
4.7 Conclusion ... 71
Chapter 5 Surface Polymer Stabilized Dual Frequency Chiral Liquid Crystals ... 73
5.1 Introduction ... 77
5.2 Materials and methods ... 84
5.3 Experimental setup and process ... 86
5.4 Haze measurements ... 94
5.5 Discussion ... 95
5.6 Conclusions ... 103
Chapter 6 Conclusion ... 105
List of Figures
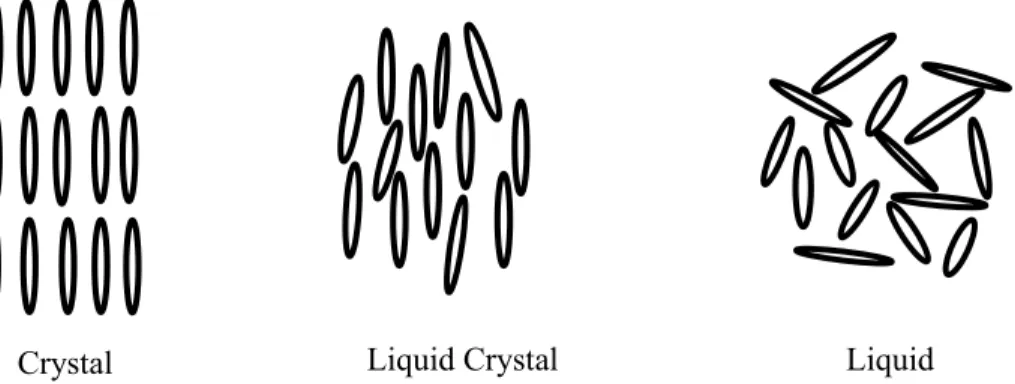
Figure 2.1 Schematic presentation of the solid, liquid crystal, and liquid phases. ... 7 Figure 2.2 Molecules in the liquid crystal phase. The director shows the direction of preferred direction. Axis of each molecule makes an angle with the director. (After Ref. [35]) ... 8 Figure 2.3 Molecular structure of a typical liquid crystal. (After Ref. [36]) ... 9 Figure 2.4 Gay-Berne potential U(r) as function of intermolecular distance r between elongated molecules. Black elipsoids mimic the pairs of interacting molecules in different geometry of interaction. Both scales are arbitrary. (After Ref. [42]) ... 11 Figure 2.5 Schematical representation of nematic a) and cholesteric b) phases ... 12 Figure 2.6 Example of chiral molecule: Bromochlorofluoromethane enantiomers (After ref. [48] ) ... 13 Figure 2.7 The refractive index ellipsoid of a uniaxial liquid crystal with the optic axis parallel to the z axis. The refractive index no of the ordinary ray is independent of
propagation. The refractive index ne of the extraordinary ray is larger than no for a liquid
crystalline material of positive birefringence (After Ref. [5]). ... 15 Figure 2.8 Orientation of a LC molecule by an electric field. In (a) the molecule has positive dielectric anisotropy, while in (b) it has a negative dielectric anisotropy. (After Ref. [35]) ... 16 Figure 2.9 Frequency dependence of dielectric constants for the dual frequency LC: MLC2048. (After Ref. [53]) ... 19 Figure 2.10 The three basic types of deformation in liquid crystals: a) splay deformation b) twist deformation and c) bend deformation ... 20 Figure 2.11 Alignment by surfaces: a) planar alignment b) homeotropic alignment and c) tilted alignment ... 21 Figure 2.12 Schematic representation of rubbing process (After Ref. [61]) ... 23 Figure 2.13 A nematic liquid crystal cell with a liquid crystal molecule oriented an angle θ measured from the xy-plane. An electric field E is applied along the z-axis. The molecule experience a torque that tend to reorient the molecule in a direction of applied field. (After Ref. [44]) ... 25
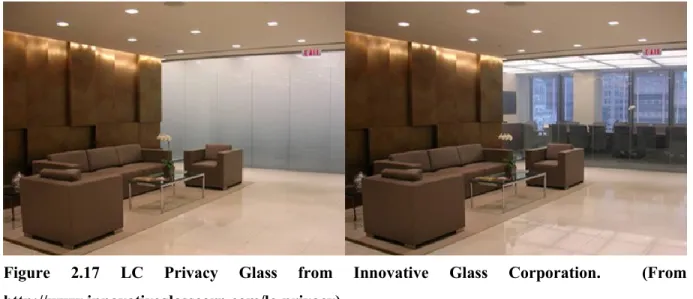
Figure 2.14 A planar nematic liquid crystal cell with strong surface anchoring: a) external field off, b) external field on ... 26 Figure 2.15 The structures of cholesteric textures. (After Ref. [68]) ... 27 Figure 2.16 Scattering of light depending on particle size: from smaller to larger particles ... 29 Figure 2.17 LC Privacy Glass from Innovative Glass Corporation. (From http://www.innovativeglasscorp.com/lc-privacy) ... 30
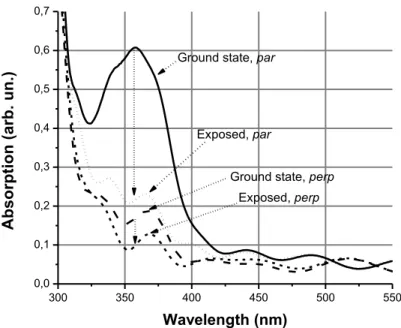
Figure 3.1 Schematic representation of the mesogenic azobenzene dye (Beam 5721) molecular structure used in our study. It is a mixture of 4 components: n-butyl-4’-ethoxyazobezene, n-butyl-4’-pentyloxyazobezene n-butyl-4’-heptyloxyazobezene and 4-n-butyl-4’-decyloxyazobezene. ... 32 Figure 3.2 Azobenzene molecule can convert betwwen trans and cis isomers upon absorption of light. (After Ref. [71]) ... 32 Figure 3.3 Statistical photo-orientation of azo molecules. The molecules aligned along the polarization direction of the incident light absorb, isomerize, and re-orient. The final state of molecules is perpendicular to the light polarization. Those molecules cannot absorb and remain fixed. (After Ref. [71]) ... 33 Figure 3.4 Polarization selective absorption spectra of the thin layer of RM doped by MAD. “par” and “perp” are cases when the polarization of the probe beam was, respectively, parallel and perpendicular to the director of the RM. The excitation of the material was done by an LED operating at 375 nm and polarized along the direction of the RM’s director. ... 39 Figure 3.5 Absorption spectra of the MAD doped bulk NLC for probe polarizations, parallel (« par ») and perpendicular (« perp ») to the director. Ground state, excited state by LED, natural (a) relaxation (excitation by Argon ion laser ) and forced (b) relaxation cases are presented for both polarizations. Intensity of LED excitation was 2,6mW/cm2.
Power of the argon ion laser was 60 μW (I=0,71mW/cm2). ... 41
Figure 3.6 The natural and forced relaxation of MAD doped NLC absorption observed at 450 nm (mainly cis absorption) without and with an argon ion laser of 0,71 mW/cm2
Figure 3.7 Ground state and excited, by a linearly polarized (vertical) UV LED of 2.6 mW/cm2 power (operating at 375 nm) absorption spectra observed with a probe beam polarized parallel and perpendicular to the polarization of the LED. ... 44 Figure 3.8 Dynamics of the photo induced birefringence of the MAD doped PMMA film induced by using an excitation at =488nm and detected at =632 nm. The excitation beam is switched on at t ≈ 5 sec and switched off at t ≈ 55 sec. ... 45 Figure 3.9 Demonstration of the PID in the MAD doped PMMA for excitation intensity of 2,4W/cm2 at 514 nm. ... 47
Figure 4.1 Photopolymerization of reactive mesogens: at left we have monomers (free molecules), and at right we have polymer with interconnected monomers. (After Ref. [100]) ... 49 Figure 4.2 Method for the spatial control of the pretilt angle: (a) Planar cell filled with LC-RM mixture; (b) LC-LC-RMs mixture separation in the external electric field (pre-cure voltage); (c) formation of the polymer layer in the vicinity of the LC cell substrates by local UV lightinduced polymerization (UV curing); (d) cell with spatially varied pretilt after curing. (After Ref. [101]) ... 50 Figure 4.3 Schematic illustration of the fabrication of PSLCs. a) Photoreactive monomers dissolved in a LC before polymerization. b) Polymer network stabilizing the LC orientation after polymerization by UV irradiation (After Ref. [102]) ... 51 Figure 4.4 Schematic presentation of major steps of the fabrication of S-PS-DF-NLC cell (see text for details). ... 58 Figure 4.5 Schematics of the general experimental setup used for the “programming” and for the electro-optic study of the haze and angular dependence of light scattering of S-PS-DF-NLC cells. The half-wave plate λ∕2 and the diaphragm were used later for electro-optic tests only (see hereafter). ... 59 Figure 4.6 Qualitative demonstration of (a) cell’s scattering in its ground state (left picture, U _ 0 V), when subjected to U = 110 V at 1 kHz (central picture) and when subjected to U = 80 V at 80 kHz (right picture). (b) The comparative histograms for three key cases (vertical arrows show the scanned zones). The cell was programmed with 110 V at 1 kHz. ... 61
Figure 4.7 Normalized (ground state; U = 0 V) angular distribution of scattered light power for the S-PS-DF-NLC cells programmed in the presence of an electric field of 110 V at 1 kHz (dashed curve) and at 70 kHz (solid curve). ... 62 Figure 4.8 Stationary dependence of ballistic light transmission upon the voltage applied to the S-PS-DF-NLC cell with frequency (a) 1 kHz and (b) 70 kHz. The cell was programmed with U = 110 V at 70 kHz. ... 63 Figure 4.9 Angular dependence of the probe beam’s transmission of the S-PS-DF-NLC cell that was programmed with U = 110 V at 70 kHz. Squares, circles, and triangles represent, respectively, ground state (U = 0 V) as well as excited homeotropic (110 V at 1 kHz) and excited planar (60 V at 70 kHz) states. ... 64 Figure 4.10 Transmission versus time for different transitions for two perpendicular polarizations (solid line, vertical; dashed line, horizontal). Excitation switching is performed (at t ≈ 5.6 s) from 110 V at 1 kHz to 0 Vand then (at t ≈ 12.4 s) from zero to 110 V at 1 kHz. The S-PS-DF-NLC cell was programmed with 110 V at 70 kHz. ... 65 Figure 4.11 Transmission versus time during the natural relaxation process for two perpendicular polarizations (solid line, vertical; dashed line, horizontal). The S-PS-DF-NLC cell was programmed with 110 V at 70 kHz. ... 66 Figure 4.12 Transmission versus time for an S-PS-DF-NLC cell that was programmed at 70 kHz. Switching is performed at t ≈ 4.4 s from 1 kHz (110 V) to 80 kHz (80 V) and back to 1 kHz (110 V) at t ≈ 11.2 s. Curves for two polarizations (solid line, vertical; dashed line, horizontal) are practically coinciding. ... 68 Figure 4.13 Ground-state microphotography (by using Zeiss polarization microscope) of the S-PS-DF-NLC cell that was programmed at 70 kHz. ... 69 Figure 4.14 Schematic demonstration of the possible mechanism of slowing of the S-PS-DF-NLC’s reaction due to the difference between (a) free relaxation and (b) forced back reorientation. The polymer aggregate (solid curve 1) is bent (dashed curve 2) toward the surface AB by the negative torque. ... 70
Figure 5.1 Schematic presentation of a PDLC cell and its operation principle. Dotted horizontal lines (at distance d0) show transparent electrodes (e.g., ITO). Two circles (of diameter dd) show the LC droplets (filled vertical ellipses showing the LC molecules; when
voltage V0 is applied to the ITOs) dispersed within the polymer matrix. A and B represent incident rays at normal and tilted angles, while A’ and B’ show the transmitted and scattered rays, respectively. ... 78 Figure 5.2 Schematic presentation of a PSLC cell and its operation principle. Dotted horizontal lines (at a distance d0) show transparent electrodes. Short horizontal lines (a) show the monomer molecules (not necessarily aligned along the LC molecules, shown by horizontal filled ellipses). Large curved lines (b) show the polymer walls and bundles. The application of voltage V0 initiates nonuniform LC reorientation (c) and corresponding light scatter. ... 80 Figure 5.3 Schematic presentation of fabrication of a nonuniform PSLC cell. The original mixture is exposed from one side of the cell (a) and the diffusion of monomers creates higher polymer network density from that side of the cell (b). ... 81 Figure 5.4 Schematic presentation of the fabrication of a S-PSLC. The partially cured RM layer is cast and aligned on the internal surface of the cell (a). Partial interpenetration between the RM and LC molecules is allowed before the photo polymerization of the RM (b). ... 82 Figure 5.5 Schematic presentation of the fabrication of an oriented (programmed) S-PSLC cell. The partially cured RM layers are cast and aligned on the internal surface of the cell (a). Partial interpenetration between the RM and LC molecules is allowed under an applied electric field (b) before the photo polymerization of RM layers (c). ... 83 Figure 5.6 Transmission spectra of the S-PS-CLC cell that was programmed with U=60V voltage at 1kHz. A single frequency CLC was used as LC. The RM wasn’t cured before applying the programming voltage (tpp = 0 min.). Curves 1 – before programming and 2 – after programming (in ground state, U=0V); 3 – after programming (excited by U=75V at 1kHz). ... 87 Figure 5.7 Transmission spectra of the S-PS-DF-CLC cell programmed with U=40V at 1kHz. The RM was not cured before applying the programming voltage (tpp = 0 min). Curves 1 - 0V; 2 – 120V at 1kHz; 3 – 120V at 90kHz. ... 88 Figure 5.8 Transmission spectra of the S-PS-DF-CLC cell (programmed with U=40V voltage at 1kHz with the RM cured for tpp = 30 minutes). Curves 1 - 0V; 2 – 90V at 1kHz; 3 – 90V at 90kHz. ... 89
Figure 5.9 Schematic representation of the experimental setup used for the measurement of the reflection spectra. WLS - Supercontinuum White Light Laser, S-sample, F - neutral density filter, BS – beam splitter cube, IS - integrating sphere. ... 90 Figure 5.10 Reflection spectra of the S-PS-DF-CLC cell (programmed at U=40V at 1kHz with RM cured for tpp = 30 minutes) during the natural relaxation from homeotropic (U=80V at 1kHz) to ground state (U=0V). Curves 1 – 0 sec; 2 –60 sec; 3 – 180 sec; 4 – 1260 sec. ... 91 Figure 5.11 Reflection spectra of the S-PS-DF-CLC cell (programmed at U=40V at 1kHz with RM cured for tpp = 30 minutes) during forced relaxation (from 80V at 1kHz to 80V at 80kHz). Curves 1 – 0 sec; 2 –0.2 sec; 3 – 0.8 sec; 4 – 20 sec. ... 91 Figure 5.12 Transmission spectra of the S-PS-DF-CLC cell (programmed at U=40V at 1 kHz, with the RM precured for tpp = 1.5 minutes) in stationary states. 1 - 0V; 2 – 160V at 1kHz; 3 – 160V at 90kHz. The vertical dashed arrow shows the wavelength (632.8nm) used for haze measurements. ... 92 Figure 5.13 Transmission spectra of the S-PS-DF-CLC cell (programmed at U=40V at 1kHz, with the RM pre-cured for tpp = 1.5 minutes) during the natural relaxation after the
switch off of the voltage from the state with 160V at 1kHz. Curves 1 – 160V at 1kHz; 2 – relax 30 sec; 3 – relax 120 sec; 4 – relax 1800 sec; 5 – 0V. ... 92 Figure 5.14 Transmission spectra of the S-PS-DF-CLC cell (programmed at U=40V at 1 kHz, with the RM pre-cured for tpp = 1.5 minutes) during the forced relaxation after the switching the voltage from the state 160V at 1kHz to 160V at 90kHz. 1 – 160V at 1kHz; 2 – relax 0.5 sec; 3 – relax 0.7 sec; 4 – relax 2.1 sec; 5 – 160V at 90kHz. ... 93 Figure 5.15 Schematics of the experimental setup used for the electro-optical haze measurements of S-PS-DF-CLC cells. ... 94 Figure 5.16 The angular dependence of the probe beam’s transmission (haze) of the S-PS-DF-CLC cell (programmed with U=40V at 1kHz with RM procured for tpp = 1.5 minutes). Squares, circles and triangles represent respectively ground state (U=0V), excited homeotropic (160V at 1kHz) and excited “helicoidal” (160V at 90kHz) states. Inverted triangles (top curve) correspond to the reference glass plate. ... 95
Figure 5.17 Micro photography of the S-PS-DF-CLC cell (in transmission) with RM cured for tpp = 1.5 minutes, recorded by using polarizing microscope (crossed polarizers). The corresponding driving conditions are shown on the right top corners of images. ... 98 Figure 5.18 Digital zoom on the Figure 5.17 images (recorded in transmission by the polarizing microscope) to demonstrate the defect structures a-in the homeotropic and b-in the planar excited states. The outlined zones are linear defects (1 and 2), polymer rich region (3 and 4) and planar cholesteric structures with different numbers of half periods (5 and 6). ... 99 Figure 5.19 Transmission spectra of the S-PS-DF-CLC cell (programmed at U=40V at 1 kHz, with the RM precured for tpp = 1.5 minutes) for various stationary voltages applied
at 1kHz. ... 100 Figure 5.20 AFM scan of the substrate with RM pre-cured for tpp = 1.5 minutes. (a) – Surface morphology in 3D and (b) – surface presented in 2D (left) and amplitude profiles (right) in two perpendicular directions (top and bottom). ... 102
Remerciements
Ces travaux de recherche ont été réalisés dans le laboratoire du COPL à l’université Laval sous la direction de professeur Tigran Galstian. Mes premiers remerciements lui sont adressés, pour m’avoir permis de faire ma thèse dans son groupe de recherche, pour son accueil et son aide tout au long de mes travaux de recherches.
Je tiens aussi à remercier l’ensemble du personnel du laboratoire pour toute leur aide au quotidien, notamment Patrick Larochelle, Hugues Auger et Souleymane Toubou Bah, ainsi que le Dr. Amir Tork de la compagnie TLCL pour son aide en chimie.
Je voudrais remercier également mes collègues Karen Allahverdyan et Jean-Philippe Bédard Arcand pour m’avoir accompagné dans mon travail au laboratoire en m’initiant aux expériences et aux montages de caractérisation dans le laboratoire, ainsi que pour les nombreuses discussions enrichissante sur mon sujet.
Je voudrais remercier ensuite mon superviseur lors de mon master à Erevan, le professeur Rafik Hakobyan pour l’aide qui m’a apporté durant mes études.
Mon attraie pour la science et en particulier la physique n’aurait pas été le même sans Arthur Davtyan qui a été mon enseignant en secondaire. Je tiens donc à la remercier à travers ce manuscrit.
Je remercie tous mes amis et proches qui m’ont permis indirectement de pouvoir réaliser ce travail, plus particulièrement Kristine, Karen et Margarit. Mais aussi, Yannick, Elina, Ani et Vahe, et tous ceux que j’oublie mais sans qui ces années de thèse à Québec n’aurait pas été les mêmes.
Je remercie également Matthieu Chazot, pour son aide et son support pendant l’écriture et la réalisation de ma thèse. Il a su trouver les mots pour m’aider à persévérer dans toutes les circonstances.
Enfin, je dédie ce mémoire à mes parents, ma sœur et mon frère, pour leur soutien et leur affection tout au long de mon travail.
Foreword
This thesis includes three peer-reviewed manuscripts published in scientific journals during my PHD project. I am the principle author of all of them. You shall find the information about each author and their contribution to the published works below.
A. Minasyan, A. Tork, and T. Galstian, "Study of photo isomerization and photoinduced anisotropy of a mesogenic azobenzen dye mixture in various solid and liquid matrices," Proc. SPIE 9288, Photonics North 2014, 92880N, 2014. Center for Optics, Photonics and Laser, Department of Physics, Engineering Physics and Optics, Laval University, Pav. d’Optique-Photonique, 2375 Rue de la Terrasse, Québec, Canada G1V 0A6
Conributions: For this pubication, I realized the entire experimental part, participated in conference Photonics North 2014 as a poster presenter and writed the first version of manuscript after having a discution with Professor Tigran Galstian about the content. Amir Tork was participated in subject discutions. The manuscript then was revised and completed by Tigran Galstain.
A. Minasyan and T. Galstian, "Surface-polymer stabilized liquid crystals with dual-frequency control," Appl Opt. , vol. 52, no. 22, pp. E60–E67, 2013.
A. Minasyan and T. Galstian, "Surface polymer-stabilized dual frequency chiral liquid crystals," Liquid Crystals Reviews, vol. 2, no. 1, pp. 60-71, 2014.
Center for Optics, Photonics and Laser, Department of Physics, Engineering Physics and Optics, Laval University, Pav. d’Optique-Photonique, 2375 Rue de la Terrasse, Québec, Canada G1V 0A6
Conributions: For these pubications, I realized the entire experimental part and writed the first version of manuscripts after having a discution with Professor Tigran Galstian about the content. The manuscripts then were revised and completed by Tigran Galstain.
Chapter 1
Introduction
Liquid crystals (LCs) were discovered over a century ago [1]. They were considered as a ‘‘new’’ state of matter that exhibits intermediate phases where they flow like liquids, yet possess some physical properties of crystals. Since this discovery many LCs were synthesized and studied [2] [3] [4]. They attracted the interest of scientists of various fields and engineers due to their exceptional anisotropic (optical and dielectric) properties and the easy control of their orientation by external fields. Due to the high degree of long scale orientational correlation and the anisotropic shape of the molecules of LC, they exhibit a high degree of macroscopic anisotropy. Dielectric anisotropy of LCs [5] [1] combined with the fact that it is orientationally flexible leads to a reorientation of the molecules of LC under the influence of a low voltage electric field (1V). This renders the LCs of such importance to electro-optic devices. They have found wide commercial applications over the latest decades in electro-optical liquid crystal display (LCD) devices such as watches, calculators, mobile telephones, computer monitors, notebooks. They are also used in many non-display applications such as spatial light modulators, fast light shutters, thermometers, tunable filters, tunable lenses, etc.
The operation of above mentioned LC based electro-optic devices is based on the electrically variable orientation of their director (average orientation of the long molecular axis). The alignment control of LC molecules is of great importance in almost all LC device applications. This control is made by applying an external field (magnetic, electric), as well as by the surface interactions between LC molecules and the internal surface of substrate. Since the LC flows, in order to be studied in laboratory or used practically in devices, the thin layer of LC (typically of few micrometres) is usually enclosed between two glass substrates in so called sandwich-like cell geometry. The interactions between LC molecules and adjacent surface influence the LC alignment, and determine the ordering of molecules in the bulk of LC cell in the absence of the external fields (ground-state
alignment). These interactions are complex and highly dependent on the LC and the substrate in question. The ground-state alignment of LC molecules is very important in LC-based devices (in majority of LC applications) where ground-state alignment is used as a default state that is retrieved once the excitation is switched off. The speed of that (relaxation) transition also is defined by those surface interactions. Thus the study and control of surface/LC interactions is of vital importance for the performance of LC based electro-optical devices.
Various methods were developed to obtain a predetermined ground-state alignment of the LC. This was mainly obtained via the surface-mediated interactions between the “pure” LC layer and the solid “discrete” interfaces. The most widely used method is the mechanical rubbing of polymer layers with a cloth. That creates reorientation of molecular chains and nanometric grooves on the surface of the polymer and thus induces a preferred alignment direction for the LC. This process, however, has several drawbacks (generating static charge, attracting dust, etc.) which come from the contact type of the method. Alternative methods, such as vacuum deposition and photo alignment, exist today, but they are complex, expensive or/and not available commercially [6] [7]. In addition, those surfaces (except the photo aligned ones) are efficient for the uniform alignment of LCs. Their market acceptance remains rather limited both for in-plane patterning [7] and for out-of-plane pretilt control [8] [9]. These limitations motivate the search for alternative methods of alignment of LCs enabling more functionalities and better performance of LC-based devices.
The major drawbacks of LC-based devices are their slow response times and the request to use polarizers for their operation. This increases the cost, decreases the light efficiency and reliability of those devices. These characteristics were significantly improved by a new family of materials, anisotropic composites, consisting of LCs and polymers, developed for light scattering electro-optical applications [10] [11] [12] [13] [14] [15]. Polymer Dispersed LC (PDLC) and Polymer Stabilized LC (PSLC) have shown useful electro-optical performance.
PDLCs are composite materials where a small amount of LC (≈ 30% ) is incorporated in a polymer matrix, forming LC droplets with a micrometers sized diameter [16] [17] [18] [19]. The operation principle of this device is very simple: in its ground state (field – off state), the director’s orientation of the LC is not the same in different droplets, the effective refractive index of those LC droplets is different from the refractive index of the polymer matrix, and the device strongly scatters light. Upon application of an electric field LC molecules are reoriented in each droplet in such way that the LC molecules are now aligned parallel to the electric field. If the ordinary refractive index of LC is matched with that of the polymer, the device appears transparent in the field – on state.
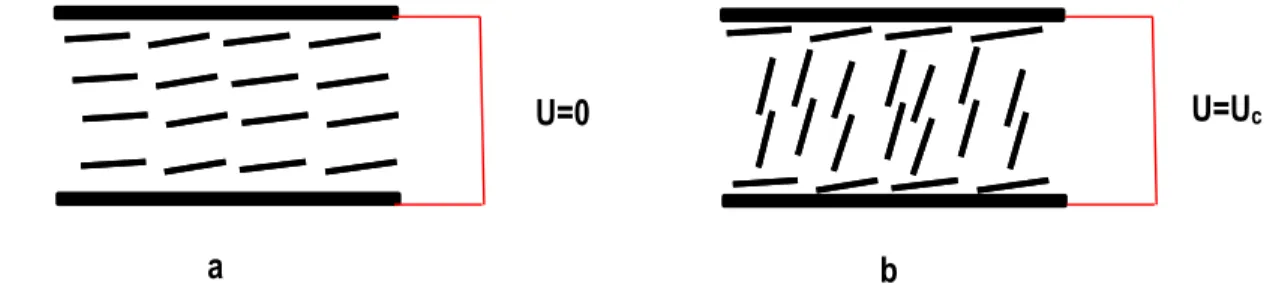
In bulk PSLC a small amount of the polymer (≈ 5% ) is dispersed in a LC anisotropic matrix [20] [21]. The aim is to ‘‘stabilize’’ the LC alignment by elastic interactions between the polymer network and LC. The texture of the LC is not significantly influenced by the formation of the polymer network, so in the field – off state the device is transparent. Application of the electric field causes light scattering due to the appearance of orientation defects because of the polymer network keeping LC molecules in their initial orientation near the polymer walls while the bulk LC molecules reorient under the field application. This electrically controllable light scattering has an attractive potential for the electro-optical applications such as light shutters, privacy and smart windows, projective displays, variable illumination LED systems and paper-like reflective displays.
Despite the fact that such material systems have certain advantages versus ‘‘pure’’ LC layers, they have significant drawbacks, which are of rather fundamental character. One of them is the haze: the presence of scattering in the ‘‘transparent’’ state for the tilted incident light. The second drawback of those material systems is the high driving voltages required when compared to ‘‘pure’’ LC layers.
It was recently shown that very limited degree of interpenetration between the LC molecules and the surface polyimide alignment layer may be obtained in the presence of external fields [22]. The use of the “soft” polymer interfaces (instead of using polyimide) can provide a more efficient interpenetration and more flexibility for the configuration of the ground-state LC alignment, which then may affect the performance of the LC cell in the
excited state. In the scope of this thesis we are exploring the possibility of using thin reactive mesogen (RM) layers, cast on the internal surfaces of the LC cell substrates as “soft” polymer interfaces, with the aim to control both the in-plane organization of LC molecules and their out-of-plane alignment, and also add several functionalities such as shorter response times and polarization independence.
1.1 Objectives
LC alignment is the key technology needed to improve the performance of LC-based electro-optic devices. The uniform and well-defined alignment is requested in most LCDs. To achieve this alignment certain substrate surface treatment is needed. The mechanical rubbing of polymer surfaces is the most used method to obtain a single domain uniform alignment of LC’s in the LCD industry [6]. Despite the several advantages of this method (relative simplicity, technological robustness), there are serious drawbacks coming from the contact type of this method, which are mechanical damage, generation of fine dust particles and accumulation of static charges. In addition, this method cannot be used to produce the multi-domain alignment or to align the LC in closed volumes. Therefore the study of the alternative methods, which could replace the rubbing technology, attracts the interest of the many scientists of LC research field and ours also.
The main objective of this thesis is the investigation of new strategies of production of surface alignment layers for LC’s in-plane and out-of-plane alignment control and improvement of LC based electro-optical devices’ performance. We concentrated our works in two more specific objectives.
The first one is to obtain a controllable pretilt angle for a uniform alignment control of LCs. The motivation comes from the demand for intermediate pre-tilt angle, which can improve the LCD’s performance and characteristics (faster response times, lower voltages). This demand has been increased after than new LCD mode, no-bias-bend (NBB) pi cell, operating in the no-bias optically compensated bend (OCB) mode, was reported as a candidate to fasten the response times [23]. Nowadays, most LCDs use planar alignment
layer with low degree of pretilt angle of 0° - 10° by using rubbing technique or vertical alignment layer with pretilt angle of 85° - 90° by using UV exposure technique. There are several approaches to obtain intermediate pretilt angles such as oblique deposition of SiOx [24], amorphous fluorinated carbon thin film via an ion-beam [25], mixture of planar and vertical polyimides [26], stacked alignment layers [27]. However, these approaches have problems of stability and reproducibility. Moreover, they are not suitable for mass production due to complexity of process.
We think that a non-contact method such as photo alignment is the most promising for a liquid crystal alignment [7]. Among the photo alignment materials the azobenzens are interesting because they can be reoriented with a light beam in visible or UV and it is possible to dope them in the different polymer matrixes for fixing their orientation [28]. Therefore, we attempted to use a layer of reactive mesogen (RM) doped with mesogenic azo dye to create an out-of plane alignment (pretilt angle) of LC molecules via the appropriate reorientation of azobenzene molecules in a host RM thin “command layer” by irradiating the layer with a polarized light.
The second specific objective is to create (‘program’) the controllable surface polymer stabilized structures for the non-uniform alignment control of LCs. Recently, the surface polymer stabilized LCs (S-PSLCs) systems using RM thin layers cast on an internal surface of LC cell substrates were reported [29] [30] [31]. They showed great potential for the control of the ground state LC alignment, enabling the fabrication of cells with electrically controllable light scattering, which can be used in various ‘‘smart lighting’’ applications such as privacy/smart windows and variable (Flash, LED) illumination systems. Among the important advantages of S-PSLCs systems (comparing for example with bulk PDLCs) is the fact that the alignment defects are formed mainly at the LC interface. Thus the viewing angle can be significantly improved and also the operation voltages can be significantly reduced (compared to PDLC and PSLC systems).
While the response times of S-PSLCs are noticeably faster compared to pure NLCs [29] [30] [31], we were looking for to further improve their performance by using dual frequency LCs (DF-LCs) in the S-PSLC geometry. DF-LCs are interesting for improving the switching speeds [32] because an external field of low frequency can align the director
along the field, while an external field of higher frequency aligns the director perpendicular to the field. So, changing frequency of the field one can switch the director very fast because the director always suffers a torque from a field. Thus, DF-LCs may enable not only obtaining of the different ‘programming’ regimes (with low or high frequencies), but also having more possibilities of control during the post-programming operations. The more specific goals of this part of work are to improve the modulation contrast, response times and obtain a polarization independent performance of S-PSLS cells.
1.2 Thesis structure
This thesis focuses on study of the interactions of liquid crystals with the interfaces, from both scientific and practical points of view. At first, a general introduction to the liquid crystals, concerning their properties and alignment techniques is done in Chapter 2. Three following chapters are based on the published articles and represent two different approaches employed for the LC surface alignment control. Each of these chapters includes complementary literature review own to the method employed. In Chapter 3 we present the experiments and results of the first approach based on the use of the light for the LC alignment control. In Chapter 4 we present the second approach of LC alignment control by using ‘‘soft’’ RM/LC interface ‘‘programmed’’ and controlled by the electric field, using a dual-frequency nematic liquid crystals. Further, the same approach employed to dual frequency chiral liquid crystals is presented in Chapter 5. A general conclusion to the entire study is finally done in Chapter 6.
Chapter 2
Introduction to Liquid Crystals
2.1 Liquid crystals
We know from basic physics that many substances can exist in different state of matter or so-called phases. We classify them to solids, liquids and gases. But this classification in not complete: many organic substances do not possess a single change of state (or phase transition) between the crystal and the liquid (Figure 2.1). It's Reinitzer [33] that in 1888 discovered a phase of matter between solid and liquid states, while observing the melting behavior of organic substance related to cholesterol. He noticed that at 145.5C the substance becomes cloudy liquid and at 178.5C it turns to a clear liquid. This substance was then characterized by Lehmann [34] , who had developed a series of optical polarization microscopes. Lehmann recognized that he was looking at a different state of matter than that of classical solids, liquids, and gases. He named the new phase of a matter existing between solid and liquid states ‘‘liquid crystal’’, basing on physical properties that this phase possess. This state are also known as mesomorphic (from greek: intermediate form) or mesophase.
𝐧
Crystal Liquid Crystal Liquid
Figure 2.1 Schematic presentation of the solid, liquid crystal, and liquid phases.
As we know the solid phase possesses the positional order, (the molecules occupy certain positions) and also it possesses orientational order. When solid melts to a liquid, both types of order are lost. When solid melts to a liquid crystal, the positional order can be lost, but some of orientational order remains [35]. The molecules in liquid crystals are free to move like in liquids, but at the same time they tend to remain pointing along the certain direction called director (Figure 2.2). The orientational order in liquid crystals is described quantitatively by an average function called the order parameter
𝑆 =<32𝑐𝑜𝑠2𝜃 −1
2 > , (2.1)
where 𝜃 is the angle between the director and the axe of the molecule (Figure 2.2). The order parameter decreases when temperature in liquid crystals increases, and above the liquid phase transition temperature Tc becomes 0. Typical values for the order parameter in
liquid crystals are between 0.3 and 0.9.
Figure 2.2 Molecules in the liquid crystal phase. The director shows the direction of preferred direction. Axis of each molecule makes an angle with the director. (After Ref. [35])
The physical and optical properties of liquid crystals are depending on their constituent molecules [3] . The Figure 2.3 shows the chemical structure of the most common occurring liquid crystals [36].
In general, to form the liquid crystal phase the molecules must be first of all elongated, and must have a rigid core which will often contain an aromatic element. Also there will be a polarizable group, e.g. CL, CN, CN2, and in addition to a long flexible chain attached to the
core. The flexible chain will usually be an alkyl(CnH2n+1) or alkoxy(CnH2n+1O) group [37].
The molecules such as those shown in Figure 2.3 comprise the two or more aromatic rings connected by a linkage group X, and at the end connected to the side-chain R and terminal group R’.
Figure 2.3 Molecular structure of a typical liquid crystal. (After Ref. [36])
There are variety of theoretical models [1] which try to describe the formation of the liquid crystalline phase. The general points of these theories about main factors influencing in the formation of the liquid crystalline phase are
the molecules should contain the rigid core plus the flexible element which allows some degree of disorder to avoid the formation of the crystalline phase
the length of the molecule respect to the width of latter should be of order of 6:1 and
the molecule should contain an element capable of the long-range dipolar interactions.
One of the most successful theories was introduced by Maier and Saupe [38]. The so called Maier-Saupe theory (also called mean field theory) assumes that the most important force to form the liquid crystalline phase is the dispersion force between molecules. The dispersion forces (also known as London forces) are a type of the Van der Waals attractive forces that occurs between two induced electric dipoles [39]. The origin of these forces is in random fluctuations in the electronic structure of the molecules. These fluctuations lead to inducing the temporary dipoles in molecules interacting with each other. The molecules stay close to each other and continue to fluctuate in synchrony in order to maintain their dipoles and stay interacted with each other. To calculate the force field, it is usually considered an average of six nearest neighbours, so the mean field approximation of the potential field is assumed. Since a molecule in nematic phase has a higher rotational freedom about its long axis than in a crystal, it is reasonable to assume that this approximation is appropriate in this situation. Also the liquid crystalline materials contain significant dipole or anisotropic electronic polarizability, which lead to long-range interactions and high ordered molecular organisation along the preferred direction. The molecule of liquid crystal will so experience the force to point along that preferred direction, and so that force will be proportional to the order parameter S [37]. The interaction energy of the liquid crystal molecule with its surroundings is then shown to be
𝑊𝑖𝑛𝑡 = −𝑉𝐴2𝑆 ( 3
2𝑐𝑜𝑠
2𝜃 − 1), (2.2)
where V is the molar volume, 𝑆 is the order parameter, and A is a constant determined by the transition moments of molecules.
The nature of intermolecular interactions in liquid crystals can be quite different including Coulomb interactions, dipole- dipole (Keesom interaction), dipole- induced dipole (Debye interaction), induced dipole- induced dipole (dispersion or London interaction), steric interactions, and hydrogen bonds. One consequence of the shape anisotropy of liquid crystal molecules is that the dispersion forces became dependent on their mutual
orientation. These anisotropic attractive forces are the important factor in driving molecules into a favorable mutual orientations and ordering in liquid. Moreover, for anisotropic shape molecules, the repulsive steric forces are also orientation-dependent, and this is usually a determinant factor of mutual alignment of molecules. For spherical molecules, the Lennard-Jones (or 6–12) potential is often used [39] [40] to describe the intermolecular interactions of the molecules. For elongated molecules consisting of several atoms, the Gay–Berne potential [41], taking into account a mutual orientation of elongated molecules is considered. This is basically an appropriately scaled Lennard–Jones potential that allows two particles to approach each other closer parallel to the short axis compared with approaches along the long axis. From Figure 2.4 one may see how the equilibrium distance and the depth of the energy minimum differ for differently oriented molecules [42].
Figure 2.4 Gay-Berne potential U(r) as function of intermolecular distance r between elongated molecules. Black elipsoids mimic the pairs of interacting molecules in different geometry of interaction. Both scales are arbitrary. (After Ref. [42])
The most widely studied and used in liquid crystals are thermotropic liquid crystals, whose physical and optical properties are function of temperature. Thermotropic liquid crystals are classified in three main classes depending on their molecular structure: nematic, cholesteric and smectic. In this work we have used only two types of these classes: nematic liquid crystals (NLC) and cholesteric liquid crystals (CLC), so we will present them in more details.
2.2 Nematic and cholesteric phases
Nematic liquid crystals (NLCs) are among the most explored and studied anisotropic fluid [1] [43] [19] materials. They are used in a diverse applications including different types of displays [44], modulators [45], tunable lenses [46] , filters and beam/image processing devices [47] Operation of these devices is mainly based on the electrically variable orientation of the liquid crystal director.
The nematic liquid crystal phase is the closest to the liquid. The interactions between the molecules tend to arrange, on average, parallel to each other, thereby defining a preferred direction of their axes of symmetry. This preferential alignment axis defines the axis of symmetry of the phase, the nematic axis, indicated by a unit vector 𝒏 called the director. The schematic representation of the rodlike liquid crystal molecules in nematic phase is shown in (Figure 2.5a). The molecular arrangement is positionally random and similar as in a liquid, which gives to this phase high fluidity. However, there is some order of directional correlation, which is the cause of the anisotropic properties of this phase. The nematic phase molecules are centrosymetrique, their physical properties are the same for the +n and –n directions. If the molecules carry the permanent electric dipole, they will be organized in such a way that the collective dipole moment of the system is zero.
𝐧
a
b
Many organic compounds are chiral (their mirror image is not superimposable on them) because they contain at least one asymmetric carbon (Figure 2.6, after ref. [48]). If we dissolve a chiral molecule in a nematic liquid crystal, the chiral nematic phase forms. A main result of this phase is in the occurrence of a helical structure. This type of chiral nematic phase is called cholesteric phase. Like a nematic phase, this phase has a long-range orientational order, but no-long range positional order. The difference is that director is not fixed in the space as in the nematic phase. The intermolecular forces between molecules favor alignment between molecules at a slight angle to one another. Locally, the molecules are still oriented in the average along a director n, but macroscopically the direction of n varies spatially describing a helix about a coil axis perpendicular to n (Figure 2.5b). This helical structure is characterized by two parameters: its pitch (P) and its direction of rotation. The pitch is the distance that the director makes by rotating one full turn. Because of the equivalence of -n and n, the spatial period L (Figure 2.5b) is equal to one-half of the pitch.
The repeated helical structure of the director gives rise to a Bragg reflection for the normally incident light [1]. This phenomenon takes place for the wavelengths near the resonance wavelength 𝜆𝑅 = 𝑛𝑎𝑣∗ 𝑃, where 𝑛𝑎𝑣 = 2∗𝑛⊥+𝑛∥
3 is the average refractive index
of the LC, n⊥ and 𝑛∥ being the local ordinary and extraordinary refractive indexes of the
LC, respectively. The spectral width of the resonance band is proportional to the pitch of the helix and the local birefringence ∆𝑛 = 𝑛∥− 𝑛⊥ of the liquid crystal, ∆𝜆𝑅 = ∆𝑛𝑃.
Circularly polarized light of the same circularity to the helical structure is reflected because of the constructive interference of the light reflected from the different layers, while
Figure 2.6 Example of chiral molecule: Bromochlorofluoromethane enantiomers (After ref. [48] )
circularly polarized light of the opposite circularity to the helical structure is not reflected because of the destructive interference. So, if the normally incident light is unpolarised, then the 50% of the light will be reflected. It is possible to achieve a more than a 50% of reflection by introducing a polymerizable monomer into a cholesteric medium exhibiting thermally induced helicity [49] [50].
2.3 Properties of liquid crystals
All the special properties of LCs come from their strong anisotropy [1] (optical, dielectric, magnetic, mechanical, etc.). This anisotropic property of the LC molecules is due to their rodlike shape of the molecules (anisotropy shape). Most of the NLC are uniaxial; the material has a single axis of symmetry. Free rotation around the long molecular axis gives an axis off symmetry which is parallel to the director. So the properties of the material along the direction perpendicular to that symmetry axis are same, whereas they are different along the axis parallel to the director.
2.3.1 Optical anisotropy
The aligned NLCs are uniaxial, and therefore birefringent, exhibiting different optical properties of light traveling with electric field parallel or perpendicular to the director or optical axis. The electric vector of the incident plane polarized light propagating through the NLC split into the ordinary ray (o) which propagates in the plane perpendicular to the optical axis and extraordinary ray (e) propagating in the plane which include the optical axes and ray direction (Figure 2.7). The refracting index of the ordinary ray no is constant
and independent of propagation direction, whereas the refractive index of the extraordinary ray ne(θ) varies with the ray propagation angle θ with respect to the plane perpendicular to
𝑛𝑒(𝜃) = (𝑐𝑜𝑠𝑛2𝜃 𝑜2 + 𝑠𝑖𝑛2𝜃 𝑛𝑒2 ) −1/2 (2.3)
The birefringence of the medium depends on the propagation direction and is defined as
∆𝑛(𝜃) = 𝑛𝑒(𝜃) − 𝑛𝑜 (2.4)
The maximum birefringence occurs when electric field of the e-ray is parallel to the optical axis (𝜃 = 90° ). The optical anisotropy ∆𝑛 = 𝑛
𝑒− 𝑛𝑜 in LCs is generally higher than in the
crystals and is about 0.1 to 0.2.
Figure 2.7 The refractive index ellipsoid of a uniaxial liquid crystal with the optic axis parallel to the z axis. The refractive index no of the ordinary ray is
independent of propagation. The refractive index ne of the extraordinary ray is
larger than no for a liquid crystalline material of positive birefringence (After Ref. [5]).
2.3.2 Dielectric anisotropy
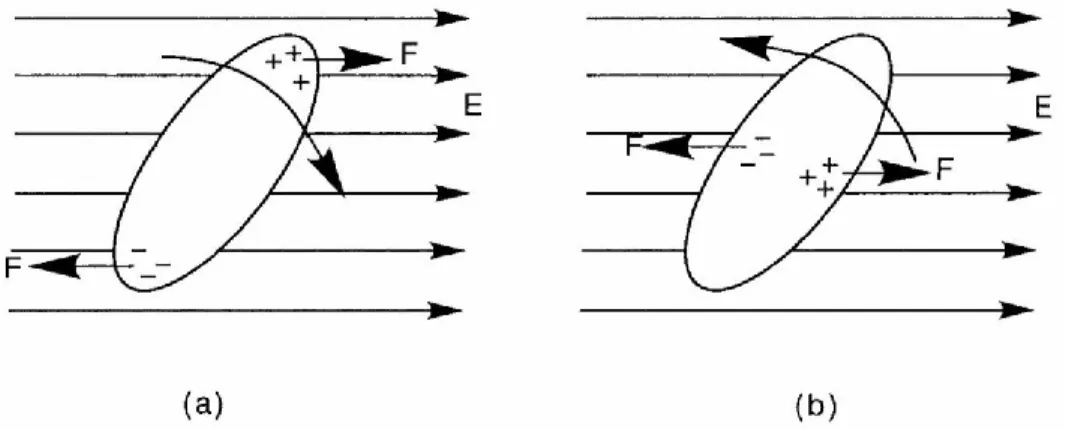
Most of LCs molecules are not charged; however, sometimes the bonding between the atoms can cause a slight separation of the positive and negative charge in molecules and so create the permanent electric dipole. In the absence of the electric field the molecules are oriented in the way that accumulative electric dipole of all molecules is zero, even if orientational order is present. The situation changes if an electric field is applied to the material. As shown in Figure 2.8 the opposite charged parts will experience the forces in opposite directions, and the electric torque will cause the molecules to rotate until the electric dipole line up with the electric field. This will tend to orient the molecule parallel or perpendicular to the electric field, depending on how the separation of charge occurs: along or across the long axis of the molecule. If each molecule carries a permanent dipole parallel (or approximately parallel) to the longitudinal axis, the dipole will be oriented (by the E field) along the long axis (𝜀∥> 𝜀⊥, dielectrically positive). And if there is a permanent dipole, which is more or less perpendicular to the long axis, the situation is reversed (𝜀∥< 𝜀⊥, dielectrically negative) [1] .
Figure 2.8 Orientation of a LC molecule by an electric field. In (a) the molecule has positive dielectric anisotropy, while in (b) it has a negative dielectric anisotropy. (After Ref. [35])
In many liquid crystal molecules the bonding of atoms does not produce any separation of charges. Those molecules respond to an electric field in another way. The electric field applied to the molecule displaces the positive charges slightly in one direction and the
negative charges in the other direction, and so induces an electric dipole. Once the dipole moment is induced the electric field acts on the molecule in the same way as in the case of the permanent dipole in any medium. In the nematic LCs the polarizability of the molecules is different for directions parallel to the long axis of the molecule and perpendicular thereto. The difference ∆𝜀 = 𝜀∥− 𝜀⊥ may be positive (e.g., E7, 5CB, TL216) or negative (MBBA), depending on the chemical structure of the constituent molecules of the NLC.
The dielectric permittivity’s in the LCs depends on the temperature and the frequency. The ∆𝜀 decreases as the temperature of the medium increases. The frequency dependence (dispersion) can be described from the physical origin of the induced polarization of the molecules. Generally there are three contributions to the induced polarization of the liquid crystal molecules: electronic, vibrational, and orientational polarization [44]. The electronic contribution is due to field-induced displacement of the electron cloud in the molecule. The magnitude of the dipole induced moment depends on the orientation of the molecule in the electric field. The vibrational contribution is due to a deformation of the nuclear skeleton of the liquid crystal molecule. Orientational polarization is arising from the partial alignment of the permanent dipoles in liquid crystal molecules. These three mechanisms of polarisation have different characteristic relaxation times. Among them, the orientational polarisation, which related to the reorientation of permanent electric dipoles of molecules, is the slowest with the time scales ranging from 10-9 to 10-2s. At relatively low frequencies
of electric field (e. g., 1kHz) all three contributions participate in the overall polarization. As the frequency increases, the orientational polarization becomes negligible because of the insufficient time to respond to the reversed electric field.
In general 𝜀∥ and 𝜀⊥ have the different dispersion regions. For the rodlike molecules of the liquid crystals orientatational contribution of permanent dipoles for 𝜀⊥ is negligible, while
for the 𝜀∥ the orientational contribution of permanent dipoles is significant. According to
Debye’s theory, the frequency dependence of the dielectric constants of polar molecules can be written as
𝜀∥= 𝜀∥𝐻+
(𝜀∥𝐿− 𝜀∥𝐻) 1 + (𝑓/𝑓𝑅)2
𝜀⊥ ≈ 𝑐𝑜𝑛𝑠𝑡𝑎𝑛𝑡 (2.5)
where 𝜀∥𝐻 is the dielectric constant at high frequencies (𝑓𝑅 ≪ 𝑓) and 𝜀∥𝐿 is the dielectric
constant at low frequencies (𝑓 ≪ 𝑓𝑅 ). The relaxation frequency 𝑓𝑅 = 1/(2𝜋𝜏) is related to the relaxation time 𝜏 of the orientational motion of the molecules. In the case, when the static value of 𝜀∥ (for low frequencies) exceeds that of 𝜀⊥, there is a possibility that 𝜀∥
becomes smaller than 𝜀⊥ in the relaxation frequency region, as a result of a low frequency dispersion in 𝜀∥(see eq. 2.5). Thus, the dielectric anisotropy will change its sign from positive to negative at a certain cross-over frequency. For some LCs it occurs at relatively low cross-over frequencies (near the 50kHz), and we call them dual frequency liquid crystals (DFLC).
One of the disadvantages in the LC based devices is that turn-off relaxation process is long. The turn-on process can be accelerated and be can made sufficiently fast by increasing of external field. The turn-off process can also be accelerated if we use DFLC. A DFLCs are the mixtures usually composed of two types of materials [51]: 1) Compounds possessing a positive dielectric anisotropy at low frequencies (positive compounds). These compounds ensure frequency dependence of the mixtures thanks to the fact that their dielectric anisotropy decreases with the increase of the frequency. 2) Compounds possessing a negative dielectric anisotropy at high frequencies (negative compounds). These compounds ensure the large negative dielectric anisotropy for the high frequency region below the megahertz for whole mixture [52].
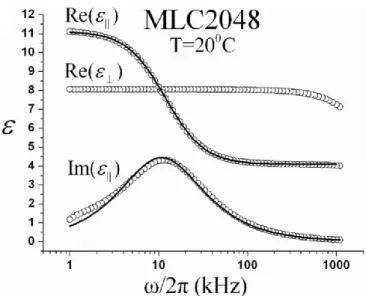
The frequency dependence of the dual frequency nematic liquid crystal (DFNLC) that we used in this work is presented in Figure 2.9. The crossover frequency of MLC2048, the frequency at which the dielectric anisotropy changes sign is around of the 30kHz [53]. This frequency is generally determined by the relaxation frequency of the positive compound. There are various factors that determine relaxation frequency, such as molecular length [54] [55], viscosity and order parameter [56].
The DFLCs are very interesting for improving the switching speed [32] because an external field of low frequency can align the director along the field, while at the higher frequency the director aligns perpendicular to the field. So, changing frequency of the field one can switch the director very fast because the director always suffers a torque from a strong field. Since the field is never switched off, the slow free relaxation process of the director is excluded.
2.3.3 Elasticity
The existence of a long-range orientational order in liquid crystal is at the root of its elastic properties. At rest, all the molecules of a nematic liquid crystal are aligned parallel to a fixed n direction. This configuration corresponds to the equilibrium configuration and minimum free energy state. Any deviation from this perfect order increases the free energy of the system. Upon application of a distorting force, such as electric field or surface forces, a liquid crystal will undergo a deformation. The balance between the distorting force’s torque and the elastic torque will then determine the static deformation pattern of the liquid
Figure 2.9 Frequency dependence of dielectric constants for the dual frequency LC: MLC2048. (After Ref. [53])
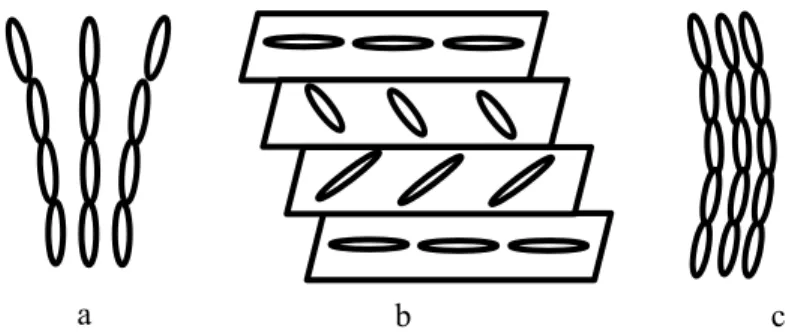
crystal. Any static deformation of liquid crystals can be presented as a combination of a three basic deformations. These are splay, twist, and bend deformations, as shown in Figure 2.10. Following the notation of the Oseen-Frank theory [1], the elastic energy density of the deformed nematic liquid crystal that can be given by
𝐹𝑑 =12𝐾11(𝑑𝑖𝑣𝐧)𝟐+1
2𝐾22(𝐧 ∙ 𝑟𝑜𝑡𝐧)2+ 1
2𝐾33(𝐧 × 𝑟𝑜𝑡𝐧)2 (2.6)
where 𝐾11, 𝐾22 and 𝐾33 are the elastic constants (Frank constants), associated to splay,
twist and bend deformations, respectively. The elastic constants determine the spatial and temporal response of the liquid crystal director to applied external fields.
2.4 Alignment by surfaces
There are two types of alignment forces which act in different ways on the liquid crystals: the volume forces (such as electric fields, magnetic fields), and the surface forces. The surfaces are very important for understanding and controlling the behavior of LC. Without any physical or chemical treatments of surfaces, the liquid crystal will have many domains and many discontinuities in orientations, which will cause a light scattering and liquid crystal will appear cloudy.
a b c
Figure 2.10 The three basic types of deformation in liquid crystals: a) splay deformation b) twist deformation and c) bend deformation
The surface interactions between substrate and LC are complex and highly dependent on the material and the substrate in question. These interactions are fundamental for understanding the phenomena of alignment in the liquid crystals. The most important factors determining the LC alignment near the surfaces include dipolar interactions, Van der Waals forces, steric interactions, hydrogen bonding, surface topography and elastic properties of liquid crystals.
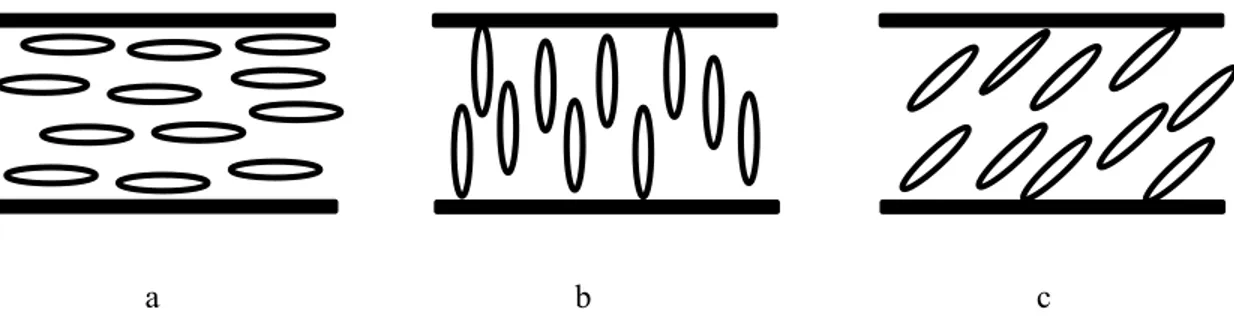
The chemical interaction between the surface and the LC is one of the factors that can influence the orientation of the molecules. Surfaces, by their chemical nature, can generate a planar, homeotropic, tilted alignment of the molecules (Figure 2.11). The liquid crystal molecules align parallel to the substrates in the planar alignment, perpendicular to the surfaces in the hoemeotropic alignment, and tilted to the substrates with a certain polar angle, called pretilt angle, in the tilted alignment. Actually, the tilted alignment with the pretilt angle less than 10o is usually called planar alignment. In order to obtain planar
alignment substrates with rubbed polyimide films are used. Homeotropic alignment is generally obtained by using substrates with hydrophobic films such as silane compounds [57]. The SiO evaporation method can give any of the planar, homeotropic and tilted alignments by changing evaporation angle [24].
In the volume of the liquid crystal, all directions are equivalent for the director. This is no longer true when in contact with a surface, where the symmetry of the mesogenic phase is
n
n
a b c
Figure 2.11 Alignment by surfaces: a) planar alignment b) homeotropic alignment and c) tilted alignment
broken by the presence of the other phase than the liquid crystal. In the vicinity of an interface, in the absence of external fields, the liquid crystal is aligned with the surface director ns parallel to a privileged nf called easy axis direction. This axis corresponds to the
orientation that minimizes the energy of the interface, the anisotropic part of which is called anchoring energy. Any deviation of ns from nf increases the energy of the system and
creates a anchoring torque which tends to bring ns parallel to nf. The anchoring energy
depends on an interaction between aligning layer and liquid crystal molecules near the surface. In most cases, the alignment of the liquid crystal molecules near the substrate is hardly changed by the applied external fields (electric or magnetic). Such interaction between the aligning layer and liquid crystals is called strong anchoring. In the case of strong anchoring, the alignment of the liquid crystal molecules (in bulk) gets back to the initial orientation after removing the external field. In the case of a so called weak anchoring, the orientation of the liquid crystal molecules near the surface can be changed upon application of external fields. In this case the orientation of the liquid crystal molecules (in bulk) is different from the initial orientation.
The LC alignment in bulk is determined by the orientational ordering of the first LC monolayer adsorbed on the substrate [58] [59]. Then through LC molecule-molecule interactions this orientation propagate in volume by the effect of the elasticity of the medium [1]. It is therefore very important to be able to properly orient liquid crystals near the surfaces.
The rubbing method is the dominant alignment process since it was reported by Mauguin eighty years ago [60]. It consists of rubbing a spin-coated polymer (usually polyimide) surface using a rotating drum covered by a cloth with short fibers (Figure 2.12, after ref. [61]). This process orients the polymer film by printing a micro-relief and orienting the polymer chains of the surface in the direction of rubbing. The orientation of the film is then transmitted to the liquid crystal molecules by short-distance interactions (Van der Waals forces and hydrogen bonds). The orientational distribution of the first LC monolayer absorbed on the rubbed polyimide substrate can be determined from the optical second-harmonic generation (SHG) measurement of surface [62]. The alignment film thus provides to the liquid crystal molecules an azimuthal orientation in the rubbing direction and also
![Figure 2.12 Schematic representation of rubbing process (After Ref. [61])](https://thumb-eu.123doks.com/thumbv2/123doknet/6524662.175250/43.918.201.766.573.772/figure-schematic-representation-rubbing-process-ref.webp)