HAL Id: hal-01634370
https://hal.inria.fr/hal-01634370
Submitted on 14 Nov 2017
HAL is a multi-disciplinary open access
archive for the deposit and dissemination of
sci-entific research documents, whether they are
pub-lished or not. The documents may come from
teaching and research institutions in France or
abroad, or from public or private research centers.
L’archive ouverte pluridisciplinaire HAL, est
destinée au dépôt et à la diffusion de documents
scientifiques de niveau recherche, publiés ou non,
émanant des établissements d’enseignement et de
recherche français ou étrangers, des laboratoires
publics ou privés.
Non-Neutrality of Search Engines and its Impact on
Innovation
Pierre l’Ecuyer, Patrick Maillé, Nicolás Stier-Moses, Bruno Tuffin
To cite this version:
Pierre l’Ecuyer, Patrick Maillé, Nicolás Stier-Moses, Bruno Tuffin. Non-Neutrality of Search Engines
and its Impact on Innovation. Internet Technology Letters, Wiley, 2017, �10.1002/itl2.10�.
�hal-01634370�
Non-Neutrality of Search Engines and its Impact on
Innovation
Pierre L’Ecuyer,
1Patrick Maillé,
2Nicolás E. Stier-Moses,
3and Bruno Tuffin
41
Université de Montréal, Canada 2
IMT Atlantique, France 3
Universidad Torcuato Di Tella, Argentina 4
Inria, France
Correspondence: Bruno Tuffin, Inria, Campus Universitaire de Beaulieu, 35042 Rennes Cedex, France. Email: bruno.tuffin@inria.fr
Abstract
The search neutrality debate is about whether search engines should or should not be allowed to uprank certain results among the organic content matching a query. This debate is related to that of network neutrality, which focuses on whether all bytes being transmitted through the Internet should be treated equally. In a recent paper, we have formulated a model that formalizes this question and characterized an optimal ranking policy for a search engine. The model relies on the trade-off between short-term revenues, captured by the benefits of highly-paying results, and long-term revenues which can increase by providing users with more relevant results to minimize churn. In this article, we apply that model to investigate the relations between search neutrality and innovation. We illustrate through a simple setting and computer simulations that a revenue-maximizing search engine may indeed deter innovation at the content level. Our simple setting obviously simplifies reality, but this has the advantage of providing better insights on how optimization by some actors impacts other actors.
Keywords: Search engine, revenue maximization, neutrality, innovation
1
Introduction
There is an ongoing public debate about search neutrality for the Internet. Recently, some search engines (SEs) have been under scrutiny by individuals, organizations that oversee the Internet, and regulators in various countries because the organic search ranking is not only based on measures of relevance, but is also influenced by revenue considerations (3). For example, Google could favor YouTube and other content of its own because of the extra
2 L’Ecuyer et al
revenue generated from keeping users within their ecosystem of pages and services. Extra revenue relates mainly to additional ads that users are more likely to click. Bias in organic search ranking has been observed in experiments (5, 7, 12). In (12), for example, it was reported that Microsoft-owned content was 26 times more likely to be displayed on the first page of Bing (owned by Microsoft) than with any other SE, and that Google content was 17 times more likely to appear in a Google Search first page than with other SEs. These issues are of interest to governments and regulators, such as the US Federal Trade Commission (1), the US Senate (10), and the European Union. For instance, in June 2017, European antitrust officials fined Google 2.7 billion dollars in a lawsuit about search neutrality (8).
The crucial question is whether a SE should only base its ranking on link relevance, and whether a non-neutral SE could hurt the Internet economy by hampering competition and innovation by favoring content providers that can afford higher fees. The consequence may be that new applications/content may have a harder time reaching the top positions of search rankings, which would limit their distribution and their chances of being successful. The underlying question relates to other policy debates about whether and how to regulate the Internet, the most prominent example being the net neutrality debate (7, 9).
In (6), we studied a model for a SE that wants to balance the long-term revenues arising from the additional visits generated by showing more relevant content vs. the short-term revenues generated by prioritizing highly-paying content. For this model, we have characterized a simple, optimal ranking policy for the SE and showed how to compute it. The goal in the present paper is to use this model to illustrate how allowing rankings based on other features than just relevance could potentially hurt content innovation and investment incentives. A different aspect of non-neutrality of SEs was also investigated in (2), namely the impact of an SE ranking policy on the strategy of content providers earning money from ads; the key assumption being that more advertisement leads to a lower quality perceived by users and therefore a potentially lower ranking by a neutral engine.
Section 2 summarizes the model and main results of (6). In Section 3, we construct and study a simple setting that captures and illustrates the impact of a non-neutral SE on content innovation and investment. This provides insights on how an SE that implements a revenue-maximizing ranking policy can have a negative impact.
2
An Optimization Model for Search Rankings
We start by summarizing the model and results of (6), which will be used to study content innovation in the next section. In this model, a SE receives search queries at random. A query is abstracted out as a random vector Y = (M, R1, G1, . . . , RM, GM), in which M is the number of pages (or organic links) that match the query (it can be
random), and for i ∈ {1, . . . , M }, Ri is the estimated relevance factor for Page i and Gi is the expected SE revenue
conditional on the link to Page i being clicked. This revenue may include direct sales, revenue made from ads placed in the associated page, etc. The values of Ri and Giare typically estimated by the SE using its internal methodology
and data. The probability that the link to Page i is clicked (called click-through rate or CTR) when placed at position k is assumed to be the product θkψ(Ri) of a relevance effect through some non-decreasing function ψ and
a position effect through a (fixed) factor θk, with θ1 ≥ θ2≥ · · · ≥ · · · ≥ 0. The different requests Y are assumed to
be independent with some known distribution (in practice, this distribution will be learned from data).
The SE uses a ranking rule π to select a permutation π(Y ) = (π1(Y ), . . . , πM(Y )) of the M links for each request
Y , to produce an ordered list of the organic links. The link to Page i is placed in position πi(Y ), for each i. A
“neutral” ranking always orders the links in decreasing order of Ri, i.e., based on (estimated) relevance only. A greedy
SE that only cares about short-term profits may rank links by decreasing order of ψ(Ri)Gi, but this strategy ignores
that users may churn after being disappointed by the quality of the results. A smart SE should optimize the tradeoff between immediate revenue generated by highly-paying results, and increased relevance which attracts more users. In (6), we show how to do this under the following setting.
Let ˜Ri := ψ(Ri)Ri and ˜Gi := ψ(Ri)Gi be the relevance and expected revenue of link i weighted by the
quality-related factor ψ(Ri) in the CTR. Let
r := EY "M X i=1 θπi(Y )R˜i # and g := EY "M X i=1 θπi(Y )G˜i #
be the average relevance and average revenue per request, for a given ranking rule π. The average number of arriving requests per unit of time is assumed to be λ(r) for some non-negative increasing function λ. We let β be the average SE revenue per query arising from the sponsored content shown in the search results page. The SE wants to maximize its average revenue per unit of time in the long run, which is
λ(r)(g + β).
To mimic a neutral SE, one can just set all Gi to 0. The main assumptions of this model are standard (11) and are
further discussed in (6).
One of the main results of (6) is to characterize an optimal ranking policy π explicitly, under mild technical assumptions, when Y has a continuous distribution. We show that an optimal policy must be an LO-ρ policy (linear ordering policy with weight ρ), which means that it must rank the links by decreasing order of ˜Ri+ ρ ˜Gi for some
optimal value of the real coefficient ρ ≥ 0, say ρ∗. This ρ∗ can be found easily via a stochastic optimization procedure such as fixed-point iteration combined with simulation, assuming that Y can be simulated. The parameter ρ has an economic interpretation: it encodes the tradeoff between short-term revenues (the case of large ρ), and the long-term revenues arising from additional visits (the case of ρ = 0). In real life, the distribution of Y may change slowly over
4 L’Ecuyer et al
time, but it can be re-estimated continuously and ρ∗can be updated dynamically. Given ρ∗, using the policy is very simple and fast.
3
Impact of Non-Neutrality on Innovation and Investment
This section illustrates the potential impact of using non-neutral instead of neutral ranking policies, under the model put forward in (6) which we summarized in Section 2. To provide insights, we use a simplified setting and show how non-neutrality may harm competition and innovation.
We consider a first content provider (CP) that is vertically integrated with the SE, a second CP that invests in innovation, and a fringe of other CPs that compete with them. More specifically, we suppose that among the M pages corresponding to any request Y , Page 1 is served directly by the SE while the others are served by third-party CPs. Page 2 is served by a CP that invests in content quality, as described below. The other pages are from the rest of the CPs and they are all homogeneous. For our illustration, we assume that M = 10 for all Y . The revenue G1and
the relevance Ri are assumed to be uniformly distributed over [0, 1], except for R2, which is uniformly distributed
over [0, 1 + z] for an investment effort z > 0 selected by CP 2. This captures the idea that CP 2 invests in quality to improve its relevance. We assume that the relevance Ri for all i and the revenue G1 are all mutually independent.
Since the revenue generated by Pages 2 to 10 does not go to the SE, we set Gi = 0 for those pages. We assume
that the revenues made by the corresponding CPs with their pages are also uniform over [0, 1], and are independent across CPs. In addition to its revenue generated as CP 1, the SE receives an expected revenue of β = 1 per query, from sponsored search. The other model parameters are selected as follows: We take λ(r) = r, ψ(r) ≡ 1, and the click-through rates CTR(i) = θi are set as measured in (4); see Table 1.
Table 1: CTR values used in the simulations, taken from (4)
θ1 θ2 θ3 θ4 θ5 θ6 θ7 θ8 θ9 θ10
0.364 0.125 0.095 0.079 0.061 0.041 0.038 0.035 0.03 0.022
To see what happens when the SE is non-neutral, we perform simulations in which we compute ρ∗ for the SE and look at the behavior of the expected revenue for the SE, the CPs, and the users, as a function of ρ. We also compute the optimal z for CP 2 and see how this optimal z changes when the SE policy goes from neutral to non-neutral. In these experiments, we assume (as a simplification) that the distribution of Y is always immediately available to the SE. (In real life there will be a delay to learn and dynamically update the estimate when the distribution changes, but this would not cause problems if the distribution changes slowly.)
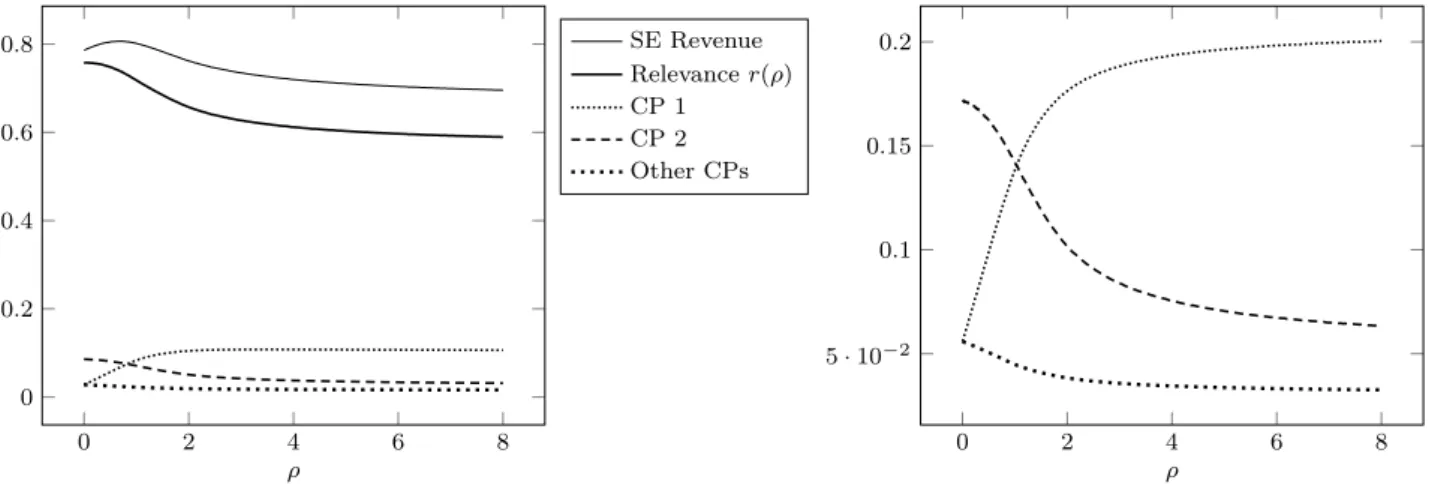
Figure 1 shows the results of the numerical analysis when the SE ranks the links according to ˜Ri+ ρ ˜Gi, for varying
values of ρ, with z = 1. Recall that we assumed that each CP makes some revenue when its page is clicked, which is uniformly distributed on [0, 1] and independent of all other variables; hence, for i ≥ 2 the revenue of CP i is simply half its visit rate. For a neutral ranking (ρ = 0), CP 2 makes more revenue than the other CPs, as expected, because it regularly obtains a higher ranking (note that we do not include innovation costs here). However, when ρ increases above approximately 0.8, CP 1 becomes the one with the highest revenue, despite its (stochastically) lower relevance. The optimal ranking rule for the SE is an LO-ρ∗ policy in which ρ∗ depends on z. For z = 1, we find ρ∗≈ 0.7.
0 2 4 6 8 0 0.2 0.4 0.6 0.8 ρ SE Revenue Relevance r(ρ) CP 1 CP 2 Other CPs 0 2 4 6 8 5 · 10−2 0.1 0.15 0.2 ρ
Figure 1: Relevance and revenues (left) and visit rates (right) per unit of time for the setting with vertical integration of CP 1 and investment of CP 2. On the left, the upper line gives the total revenue for the SE, λ(r)(g + β), the second upper line gives the global relevance r, which can be seen as a global measure of user satisfaction, and the lower lines are the revenues to the CPs.
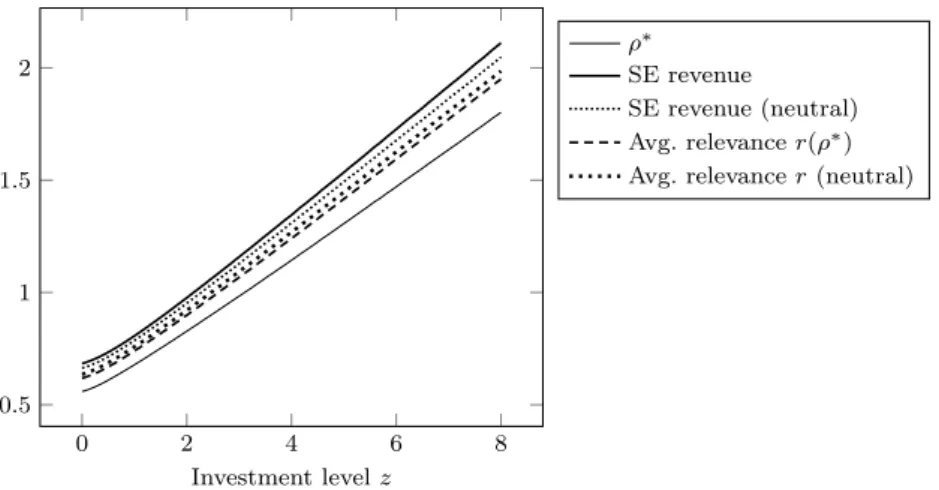
We now take the perspective of CP 2, and compute its optimal investment level z, anticipating that the SE is going to compute the optimal LO-ρ∗policy for that choice of z and will rank content accordingly. The profit for CP 2 is the revenue generated by the search market–i.e., half its visit rate–minus z times the unit investment cost. To maximize profits in this Stackelberg setting, we simulated the outcomes and computed ρ∗= ρ∗(z) over a fine grid of values of z. In Figure 2, we see that ρ∗increases as a function of z. However, this is not a general property: if λ is convex then the SE may tend to be “more neutral” (choose a lower ρ∗) when the average relevance of CP 2 increases because there would be more to gain from improving the average relevance than from improving the average revenues.
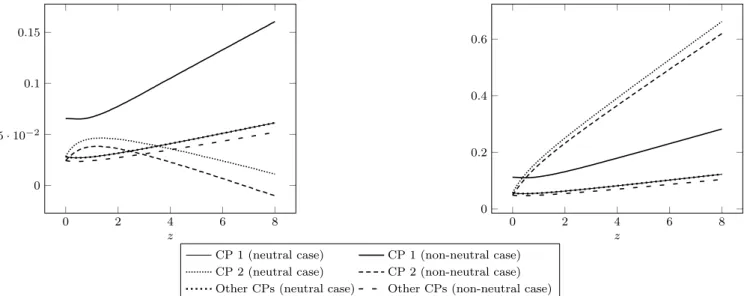
Figure 3 shows the curves for the CP profits (left) and visit rates (right) as functions of ρ, for both the neutral and non-neutral situations, assuming a unit investment cost of 0.4 for CP 2. For CP 1, both the neutral and non-neutral revenues (and visit rates) increase with z, thanks to the increased relevance, and the difference between them is quite large and it increases with z. The latter occurs because ρ∗ increases with z and the average relevance also improves, attracting more visits. For CP 2, this difference between neutral and non-neutral also increases with the investment
6 L’Ecuyer et al 0 2 4 6 8 0.5 1 1.5 2 Investment level z ρ∗ SE revenue SE revenue (neutral) Avg. relevance r(ρ∗) Avg. relevance r (neutral)
Figure 2: The optimal weight ρ∗that the SE would use in the (non-neutral) ranking, and the corresponding relevance, as functions of CP 2 effort.
in quality, for two reasons: (a) increasing z increases ρ∗, which increases the non-neutrality, to the detriment of CP 2 whose page is pushed behind that of CP 1 more often, and (b) even for a fixed ρ, with a larger z, one has R2> R1
more often, and then the situation in which these two pages are placed in reverse order of relevance occurs more frequently, hurting CP 2. For the other CPs, increasing z also increases revenue by increasing the arrival rate, but at the same time it may decrease revenue because these other CPs will have their pages ranked lower on average, in both the neutral and non-neutral situations.
The fact that CP 2 is hurt more by non-neutrality when it invests more has the consequence that non-neutrality reduces its optimal level of investment. In the present example, the optimal investment levels are as follows:
• In a neutral regime, CP 2 would select z = 1.25, and obtain a net profit of 0.046 per unit of time. • In a non-neutral regime, CP 2 would select z = 1.05, and obtain a net profit of 0.038 per unit of time. That is, with a neutral policy, CP 2 invests 16% less and its profit decreases by 26% in the long run. A non-neutral policy with these optimal values of z and ρ also decreases the global relevance r (which measures the users satisfaction) by 4%, from 0.773 to 0.7395.
4
Conclusion
We have considered a search market where an SE focuses on ranking algorithms that maximize its long-term revenue and we have compared it with results arising from a neutral ranking algorithm based only on relevance. To investigate the impact on content innovation between non-neutral and neutral ranking policies, we considered several CPs: one integrated by the SE (hence often favored in the rankings), one investing to improve its quality and revenues, and
0 2 4 6 8 0 5 · 10−2 0.1 0.15 z 0 2 4 6 8 0 0.2 0.4 0.6 z CP 1 (neutral case) CP 1 (non-neutral case)
CP 2 (neutral case) CP 2 (non-neutral case) Other CPs (neutral case) Other CPs (non-neutral case)
Figure 3: CP profits (including quality investment, at unit cost 0.4) (left) and visit rates to various CPs (right) as a function of the investment z from CP 2.
a fringe of several independent and ex-ante identical CPs. One conclusion from our case study is that under non-neutral search policies, CPs can under-invest and therefore this could curb innovation. This would of course depend on the setting and parameter values of the model, but our example provides insight on how this could happen.
The framework we have used here can be directly applied to real-life situations, provided that data is available to estimate the relevant distributions and parameters of the model to capture the real-world SE marketplace.
References
1. Brill J. Statement of the Commission regarding Google’s search practices. http://www.ftc.gov/public-statements/2013/01/ statement-commission-regarding-googles-search-practices . Last accessed Oct 2014.; 2013
2. Coucheney P., D’Acquisto G., Maillé P., Naldi M., Tuffin B. Influence of search neutrality on the economics of advertisement-financed content. ACM Transactions on Internet Technology. 2014;14(2-3):Article 10.
3. Crowcroft J. Net neutrality: The technical side of the debate: A white paper. ACM SIGCOMM Computer Communication Review. 2007January;7(1).
4. Dejarnette R. Click-through rate of top 10 search results in Google. http://www.internetmarketingninjas.com/blog/ search-engine-optimization/click-through-rate, last accessed June 68, 2017; 2012
5. Edelman B., Lockwood B. Measuring bias in “organic” web search. http://www.benedelman.org/searchbias, last accessed June 8, 2017; 2011
6. L’Ecuyer P., Maillé P., Stier-Moses N., Tuffin B. Revenue-maximizing rankings for online platforms with quality-sensitive consumers. Operations Research. 2017;65(2):408–423.
8 REFERENCES
8. New York Times. Google fined record $2.7 billion in e.u. antitrust ruling. Jun 27, https://www.nytimes.com/2017/06/27/technology/ eu-google-fine.html . Last accessed June 2017.; 2017
9. Odlyzko A. Network neutrality, search neutrality, and the never-ending conflict between efficiency and fairness in markets. Review of Network Economics. 2009;8(1):40–60.
10. Rushe D. Eric Schmidt Google senate hearing – as it happened. http://www.guardian.co.uk/technology/blog/2011/sep/21/ eric-schmidt-google-senate-hearing . Last accessed Oct 2014; 2012
11. Varian H.R. Position auctions. International Journal of Industrial Organization. 2007;25(6):1163–1178.