HAL Id: hal-00725505
https://hal.archives-ouvertes.fr/hal-00725505
Submitted on 27 Aug 2012
HAL is a multi-disciplinary open access
archive for the deposit and dissemination of
sci-entific research documents, whether they are
pub-lished or not. The documents may come from
teaching and research institutions in France or
abroad, or from public or private research centers.
L’archive ouverte pluridisciplinaire HAL, est
destinée au dépôt et à la diffusion de documents
scientifiques de niveau recherche, publiés ou non,
émanant des établissements d’enseignement et de
recherche français ou étrangers, des laboratoires
publics ou privés.
On the use of spectral peak parameters in voice
conversion
Elizabeth Godoy, Olivier Rosec, Thierry Chonavel
To cite this version:
Elizabeth Godoy, Olivier Rosec, Thierry Chonavel. On the use of spectral peak parameters in voice
conversion. Interspeech 2010, Sep 2010, Makuhari, Japan. �hal-00725505�
On the use of Spectral Peak Parameters in Voice Conversion
Elizabeth Godoy
1, Olivier Rosec
1, Thierry Chonavel
2 1Orange Labs R&D TECH/ASAP/VOICE, Lannion, France
2
Télécom Bretagne, Signal & Communications Department, Brest, France
{elizabeth.godoy,olivier.rosec}@orange-ftgroup.com, thierry.chonavel@telecom-bretagne.eu
Abstract
This paper addresses the problem of low transformed data variance, or "over-smoothing," in spectral transformation for Voice Conversion. In examining a classic GMM-based transformation with cepstral coefficients, we show that this problem lies, not only in the transformation model (as commonly assumed), but also in the choice of spectral parameterization. Consequently, we propose an alternative method for spectral transformation using spectral peaks and an HMM with Gaussian state distributions. The spectral peaks are shown to offer higher inter-speaker feature correlation and yield higher transformed data variance than their cepstral coefficient counterparts. Additionally, the accuracy of the transformed envelopes is examined.
Index Terms: voice conversion, spectral transformation,
spectral peaks
1.
Introduction
Spectral transformation plays a crucial role in voice conversion (VC), both in identifying speakers' voices and ensuring high quality synthesis. The goal of spectral transformation is to transform the spectral envelope of a (source) speaker into that of a different (target) speaker. The transformation methodology can be described in three stages: first, analysis of the speech signal in order to extract spectral envelope parameters; second, training through learning a mapping between the source and target parameters; third, transformation of the source parameters to estimate those of the target. Based on this methodology, the performance of a VC system depends on two key factors: i) the choice of spectral parameters and ii) the choice of model for learning and transformation.
Traditional approaches to spectral transformation typically use Gaussian Mixture Models (GMM) [1] on cepstral coefficients or Line Spectral Frequencies (LSF). These approaches generally succeed in capturing and reproducing certain characteristic traits of the target speaker. However, the transformed data in these cases exhibits little variance, a problem often called "over-smoothing," [2], [3]. Chen et al. showed in [2] that this lack of variance in the transformed data results from a weak correlation between the source and target parameters. In addressing this problem, Chen et al. assume that the target variance is the same as that of the source and suggest a MAP adaptation algorithm to adjust the transformation function. Alternatively, in [3], Toda et al address this problem by also modifying the transformation function, but with the introduction of a "global variance" parameter to ensure that the transformed data variance mimics the target variance. In both of these cases, the "over-smoothing" problem is attributed to the transformation model and heuristics are introduced in order to increase the transformed data variance.
Fundamentally, the small transformed data variance is a result of low correlation between the source and target spectral features, as captured in the transformation model. There exist two possible explanations for this low inter-speaker correlation. First, this problem could be attributed to the transformation model, as in the previously mentioned works. Explicitly, the "mixing" of the data may destroy inherent inter-speaker correlation. This erroneous mixing translates into a source-to-target mapping problem, commonly referred to as the "one-to-many" problem, [4]. The second possible explanation for the low inter-speaker correlation could be that the chosen spectral parameters are not capturing a meaningful link between the source and target speech. While the first hypothesis has often been assumed in related works, this paper seeks to address the second. Specifically, we can alleviate the "one-to-many" mapping problem by following the work in [4] and introducing context-dependent parameters into the GMM modeling, creating a "Phonetic GMM." In using a Phonetic-GMM, we then effectively reduce the problems resulting from the transformation model choice and can consequently focus our problem analysis on the transformation parameter choice.
In this paper, we will show that, even when ensuring correct mappings between the source and target features (on a phoneme-level), there still remains a low inter-speaker feature correlation in a classic transformation approach. Explicitly, these results indicate that the problem of low-correlation between the source and target features is due to the parameter choice (in this particular case, the cepstral coefficients) rather than the choice of transformation model. Consequently, we seek an alternative spectral parameterization that can better capture a meaningful link between the source and target speech. Specifically, we examine the use of spectral peaks as an alternate parameterization for voice conversion.
The structure of this paper is as follows. Section 2 begins by defining some general notation and metrics for transformation evaluation. These metrics are then applied to a classic approach to voice conversion using discrete cepstral coefficients (DCC) in a Phonetic GMM, "DCC-GMMP." This evaluation shows that the chosen parameters, as expressed in the model, exhibit low inter-speaker correlation and are thus inadequate for conversion. In section 3, an alternative parameterization for the spectral envelope, along with an adapted model for transformation, is presented. Specifically, we consider spectral peaks and their transformation using a Hidden Markov Model (HMM) with Gaussian-state distributions, the "Peak-HMM." In section 4, the two different approaches, DCC-GMMP and Peak-HMM, are compared using a common reference for the spectral envelope. Finally, in section 5, we conclude our evaluation and discuss avenues for future work.
2.
Spectral Transformation Evaluation
Before considering the metrics for evaluating spectral transformation, we begin by introducing some general
notation. Let's consider N aligned source and target frames parameterized respectively by vectors x and y, of dimension P. The feature vectors are classified into Q model classes, to be defined. For each class q, we consider the sample mean µq( p) , variance (σq(p))2 and cross-covariance
2 )) (
(σqxy p of the pth parameter component. We consider
each parameter component independently, corresponding to a constraint that all covariance matrices be diagonal. Assuming a Gaussian distribution for each component of the source and target feature vectors, the transformation function for the pth
parameter component is the Maximum Likelihood (ML) Estimator, yˆ p( ), given by
(
( ) ( ))
) ( ) ( ) ( ) ( ˆ 2 p p x p p p p y x qx q xy q y q µ σ σ µ − + = (1)where x( p) belongs to class q. All of the transformation functions considered in this work follow (1). With the notation defined above, we can now consider formalizing evaluation metrics.
2.1.Metrics for Evaluation
In this paper, we will consider three criteria for the evaluation of spectral transformation. First is the strength of the link between the source and target parameters in the model. Formally, this is expressed in the correlation. Specifically, we consider the average correlation between source and target parameters in the model
(
)
. ) ( ) ( ) ( 1 1 1 1 2∑ ∑
= = = Q q P p y q x q xy q XY p p p P Q σ σ σ ρ (2)This criterion is critical in determining the capacity of the parameters in the model for transformation, as the source-target feature correlation scales the factor in (1) that is dependent on the source data to be transformed. Similarly, the variance of the transformed data will depend on this factor and, thus, the correlation. Generally, the variance of the transformed data captures the influence of the correlation in the transformation results. Accordingly, the second criterion that we consider compares the transformed variances for each class to those of the target. Specifically, we consider the average ratio of the variances, VR,
, ) ( ) ( 1 1 2 ˆ 1 =
∑
∑
= = P p y q y q Q q q p p P N N VR σ σ (3)where σqyˆ(p) represents the sample variance of the transformed data and N frames are considered in class q. q
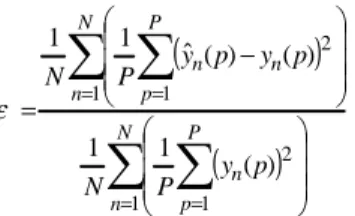
Finally, for an indicator of the transformation quality, we consider the absolute error between the transformed and target frame envelopes; specifically, the Mean Squared Error (MSE) normalized by the target parameter energy:
(
)
(
)
∑ ∑
∑ ∑
= = = = − = N n P p n N n P p n n p y P N p y p y P N 1 1 2 1 1 2 ) ( 1 1 ) ( ) ( ˆ 1 1 ε (4)Together, these three criteria (2)-(4) form a complete evaluation of spectral transformation, both of the approach and the results.
2.2.Speech Data
Our speech data is taken from corpora used in France Télécom's speech synthesis system Baratinoo, which contains speech sampled at 16kHz whose phonetic labeling and segmentation is manually verified. Currently, we consider transforming only vowels, as these are among the most important phonemes in speaker identification. In this work, a parallel corpus consisting of a female (source) and male (target) speaker is used. The source and target speech frames are analyzed pitch synchronously. The three center ("stable") frames of each source and target phoneme are automatically aligned. The remaining frames are aligned uniformly in time, within each phoneme. The training and test data sets each consist of 100 distinct phrases (roughly 30,000 aligned frames per set).
2.3.Evaluating "Classic" Spectral Transformation
Given the evaluation criteria described in section 2.1, we can now re-visit a classic approach to spectral transformation. In particular, we consider DCCs, as described in [1], with no cutoff frequency and no frequency-scale warping. In order to avoid erroneous source-to-target mappings, we model each phoneme with a Gaussian distribution, as in [4]. Table 1 summarizes the evaluation results. We consider the correlation for different model orders in parentheses; since higher order coefficients capture more detail, we can expect less correlation as we increase the cepstral order. Additionally, we have included the MSE,εmean, for "transformed" data calculated using only the target mean in (1), corresponding to a VQ-type conversion scheme.
Table 1. Evaluation Results: Classic Transformation
XY ρ order 40 (20, 10) 0.08 (0.12, 0.16) VR 0.02 ε -8.46 dB mean ε -8.19 dB
The results in Table 1 show weak links between the source and target parameters, as evident by the low average correlation (for all cepstral orders). Accordingly, the low ratio of variances shows that there is very little variation in the transformed data. What's more, the difference between the MSE using the entire transformation function versus only the mean is a fraction of a dB. Hence, the estimated target parameters are essentially the target means. These results verify those in [2] and [3]. However, in this case, one-to-one mappings between the source and target frames, within a phoneme, are ensured. Based on these observations, we hypothesize that the lack of inter-speaker feature correlation is
primarily due to the parameter choice. Consequently, we seek an alternative spectral parameterization for transformation, namely spectral peaks.
3.
Transforming Spectral Peaks
3.1.Peak Modeling & Analysis
Similarly to [5]-[6], we model the spectral envelope for frame n as a sum of Gaussian peaks
∑
= − − = n M m m n m n m n n v f f a f S 1 2 2 ) ( exp ) ( , (5)where f indicates frequency and M is the number of peaks in n
frame n. The number of peaks for each frame is not fixed but is limited to 20. The parameters xnm=
[
fnm,anm,vnm]
T represent the frequency, amplitude and variance of the mth peak in frame n (of the source speaker in this case). As discussed in [5] and [6], this representation offers an intuitive and flexible representation for the spectral envelope in a conversion context.For the peak analysis, as in [6], the Gaussian peak parameters are selected from peak-picking directly on the Discrete Fourier Transform (DFT), using a frequency mask to avoid modeling harmonic peaks and to increase resolution in regions more sensitive to human hearing. The peak variance is then calculated to fill-in the envelope in-between peak amplitudes. We note here that, given this parameter estimation, the spectral peak variance does not carry a physical meaning. Consequently, later in learning, this parameter is not considered in determining model classes. Finally, for the current work, we do not use the inter-frame alignment described in [6], as we do not currently consider the evolution of spectral parameters in time.
3.2.Learning
The number of peaks determined from the analysis described above can vary for each source and target frame. Thus, there is no inherent intra or inter-speaker alignment between peaks and the Phonetic GMM described in section 2.2 cannot be directly applied. In order to model the source and target speaker spaces with this peak representation, we consider the spectral envelope as a sequence of peaks in frequency. Explicitly, for frame n of the source speaker, we have the following sequence = Mnx
n m n n n x x x X 1,..., ,..., of
spectral peak parameters. The ensemble of source (or target) peak sequences, for a particular phoneme, can then be modeled by an HMM, as in [7]. Unlike [7], we do not currently consider the time dimension. Letting the states in this HMM follow a Gaussian distribution, we can then use an ML estimator (1) to transform the spectral peaks. This transformation process will be described in section 3.3. We refer to this modeling of spectral peaks using a single HMM per phoneme as a Peak-HMM. The learning procedure is summarized as follows.
Peak-HMM Learning: (For Phoneme k)
Data: xmn, m=1:Mnx; ynm, m=1:Mny, n=1:Nk
For each source & target speaker (independently): i. Data clustering: Generate Gaussian Classes (States) ii. Generate HMM from Gaussian States
Joint Source-Target Space
iii. Inter-Speaker State Alignment iv. Calculate Cross-Covariance
First, all of the source (or target) peaks (frequency & amplitude) are grouped using a simplified GMM with 20 classes. The simplification consists in using a MAP constraint on the EM algorithm so that each peak is associated with a single class. Statistically insignificant classes are then removed. These Gaussian classes then form the states in the phoneme HMM. In the second step (ii), the transition probabilities and initial probability distribution for the speaker HMMs are calculated. The third step (iii), determines an alignment between the source and target HMM states in a phoneme. Considering only the HMM statistics, we estimate the most-likely state sequence for the target and source speaker. Each of the most-likely target states is aligned to the most-likely source state closest in frequency. Each remaining un-aligned source state (most likely or not) is then aligned to the target state (most likely or not) nearest in frequency. In the final step (iv), the cross-covariance for each source-target state pair is calculated by considering the source and target peaks corresponding to the same frame in time, that belong to the states (classes) satisfying the respective aligned pair.
3.3.Transformation
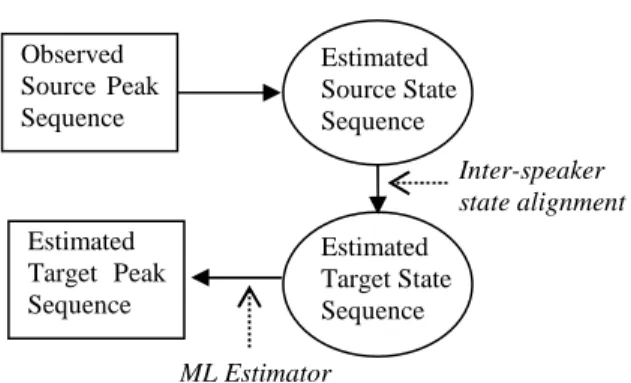
Given the model variables and source-to-target alignment determined in the Peak-HMM learning, the following diagram in Figure 1 describes the transformation process, namely how to transform an observed source peak sequence into an estimated target peak sequence.
Figure 1: Peak-HMM Transformation
The first step in this transformation is to find the most likely source state sequence given the observed source peak sequence. This problem can be solved using a Viterbi algorithm, as described in [8]. Each state in this sequence corresponds to a target state, according to the inter-speaker state alignment determined in the Peak-HMM learning. Given these estimated target states, we find the most probable target state sequence, allowing the addition of target states, if necessary. In the final estimation step, for each target state related to an observed source peak, the ML estimator (1) is used to estimate the corresponding target peak. The estimated target peaks from the remaining target states in the sequence, if
Observed Source Peak Sequence Estimated Target Peak Sequence Estimated Source State Sequence Estimated Target State Sequence Inter-speaker state alignment ML Estimator
any, are taken as the target state mean. Finally, given the estimated target peak sequence, the estimated target envelope is generated from (5).
4.
Evaluation Results
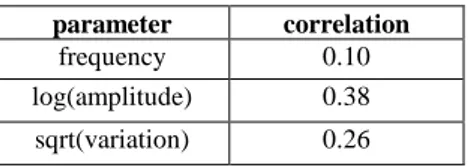
As in the case evaluating a classic spectral transformation in section 2.2, the capability of a chosen model to transform the chosen spectral parameters is indicated by the average correlation (2). Examining this correlation for the peak parameters, we have the following results shown in Table 2. Of the three parameters in Table 2, the peak log-amplitude is the most relevant. Considering the peak frequency, transformation of this parameter is essentially carried out in selecting the state sequence. Significant variations in frequency will not exist within the model states, as this would correspond to a change in state. Considering the peak variance, as previously discussed in section 3.1, this is a less important parameter in transformation. Consequently, the most significant indication of the Peak-HMM's capability for transformation is given by the average correlation of the peak amplitude (log amplitude). Comparing this value with those for the classic transformation approach in Table 1, we find a significant increase in correlation using spectral peaks rather than DCCs. In other words, the link between the source and target parameters, as expressed in the model, is stronger in the Peak-HMM.
Table 2. Peak-HMM Parameter Correlation
parameter correlation
frequency 0.10
log(amplitude) 0.38
sqrt(variation) 0.26
In order to examine the accuracy of the Peak-HMM in estimating the target parameters, we need to consider the remaining evaluation metrics in (3), (4). Additionally, we seek to compare the Peak-HMM results with those of the classical approach to transformation described in section 2. Consequently, a common reference for both approaches must be considered. We select the peak envelope calculated from the DFT, given by (5), as the reference envelope for the source and target speakers. For the phonetic GMM, the DCCs (order 40) are calculated from this reference envelope and the corresponding model and results are examined. Note that the reference envelopes are not the same as in section 2.2, thus, the results could change from Table 1. However, we state here that parameter correlation for cepstral order 40 remained the same as in Table 1, 0.08. In the case of the Peak-HMM, learning and transformation are carried out as described in section 3 in the spectral peak domain. The resulting transformed envelopes are then parameterized with DCCs (order 40). Applying the metrics (3) and (4) to both transformation results, considering the averaged DCC statistics for each phoneme, we have the following results in Table 3.
Table 3. Evaluation Results: DCC-GMMP vs Peak-HMM
DCC-GMMP (peak reference)
Peak-HMM
VR 0.01 0.32
MSE: ε -7.86 -4.34
In Table 3, there is significantly larger similarity between the transformed and target data variance for the Peak-HMM. Note that, unlike the work in [2] and [3], this variance is not a result of heuristic constraints introduced in the transformation function, but rather a result of the differences in the transformation domain; notably, a difference in parameter choice and, consequently transformation model. Considering the MSE, we see that the DCC-GMMP gives higher accuracy in a frame-by-frame transformed-target comparison. This result can be expected as GMM-based transformation is intended to minimize the mean squared error, while the Peak-HMM does not globally consider error in transformation. Nonetheless, the frame-by-frame envelope comparison indicates that the Peak-HMM is currently lacking in estimation accuracy. However, the stronger source and target links for the Peak-HMM and the ability to better capture the variation in the target spectral envelope show that this approach holds promise for spectral transformation.
5.
Conclusions & Future Work
This work has shown that the "over-smoothing" problem in spectral transformation can be reduced by choosing an adequate spectral parameterization. Spectral peaks have been shown to better capture the correlation between source and target speech, as compared to cepstral coefficients. While the transformation accuracy needs to be improved, the increased inter-speaker feature correlation and, consequently, the increase in transformed data variance, demonstrate promise in using spectral peaks for voice conversion.
Future work will incorporate the time-evolution of spectral peaks in analysis, as in [6], and in the transformation model, as in [7]. Evaluation of transformation performance with time-evolution of the spectral peaks can first be examined with the goal of improving transformation accuracy and can then be compared to more classic transformation using dynamic features of the cepstral coefficients.
6.
References
[1] Stylianou, Y. "Harmonic plus noise models for speech, combined with statistical methods, for speech and speaker modification," Ph.D. diss., ENST, Paris, France, Jan. 1996. [2] Chen, Y., Chu, M., Chang, E., and Liu, J., "Voice conversion
with smoothed GMM and MAP adaptation", in Proc. of EUROSPEECH 2003, pp 2413-2416.
[3] Toda, T., Black, A., and Tokuda, K., "Spectral conversion based on maximum likelihood estimation considering global variance of converted parameter," in Proc. of ICASSP '04, Vol. 1. pp. 9-12.
[4] Godoy, E., Rosec, O., and Chonavel, T., "Alleviating the one-to-many mapping problem in voice conversion with context-dependent modeling", in Proc. of Interspeech '09, pp. 1627-1630.
[5] Nguyen, B. and Akagi, M., "Spectral modification for voice gender conversion using temporal decomposition," Journal of Signal Processing, Vol. 11, No. 4, pp. 333-336, July 2007. [6] Godoy, E., Rosec, O., and Chonavel, T., "Speech spectral
envelope estimation through explicit control of peak evolution in time", in Proc. of ISSPA '10, to appear.
[7] Rentzos, D., Vaseghi, S., Yan, Q., and Ching-Hsiang, H., "Voice conversion through transformation of spectral and intonation features," in Proc. of ICASSP '04, Vol 1, pp. 21-24. [8] Rabiner, L.R., "A tutorial on hidden markov models and
selected applications in speech recognition," in Proc. of the IEEE, Vol. 77, No 2, February 1989, pp. 257-286.