HAL Id: hal-01008105
https://hal.archives-ouvertes.fr/hal-01008105
Submitted on 8 Jul 2018HAL is a multi-disciplinary open access
archive for the deposit and dissemination of sci-entific research documents, whether they are pub-lished or not. The documents may come from teaching and research institutions in France or abroad, or from public or private research centers.
L’archive ouverte pluridisciplinaire HAL, est destinée au dépôt et à la diffusion de documents scientifiques de niveau recherche, publiés ou non, émanant des établissements d’enseignement et de recherche français ou étrangers, des laboratoires publics ou privés.
Effect on Risk Based Inspection of spatio-temporal
dependence of ROC curves: Study of the corrosion of
steel harbour structures
Jérôme Boéro, Franck Schoefs, Bruno Capra
To cite this version:
Jérôme Boéro, Franck Schoefs, Bruno Capra. Effect on Risk Based Inspection of spatio-temporal dependence of ROC curves: Study of the corrosion of steel harbour structures. NDTCE 09, 2009, Nantes, France. �hal-01008105�
Effect on Risk Based Inspection of spatio-temporal dependence of
ROC curves: Study of the corrosion of steel harbour structures
Jérôme BOERO1, Franck SCHOEFS2, Bruno CAPRA1 1 OXAND S.A., Avon, France
2 GeM, Nantes Atlantic University, Nantes, France, franck.schoefs@univ-nantes.fr
Abstract
Owners of civil infrastructures base their maintenance decisions schemes mainly both on structural integrity assessment and consequence analysis. Some inputs come from information collected by non-destructive or destructive tools. Uncertainties and noise of measurements can lead to bad decisions but are rarely integrated into the process of decision. Nowadays, Risk Based Inspection (RBI) provides the basic concepts for optimizing the maintenance plans of existing structures while insuring a good safety and availability conditions during service life of structures. In this paper, concepts are applied on a steel sheet pile seawall submitted to uniform corrosion where spatio-temporal dependence of performance of ROC (Receiver Operating Characteristic) curves is studied.
Résumé
Les gestionnaires d’infrastructures de génie civil basent leurs schémas décisionnels de maintenance essentiellement à partir de l’évaluation de l’intégrité structurale des ouvrages et de l’analyse des conséquences en cas de défaillance. Certaines données d’entrée proviennent de contrôles destructifs ou non destructifs. Les incertitudes et le bruit sur les mesures peuvent conduire à de mauvaises décisions mais sont rarement pris en compte dans les processus de décision. Actuellement, les méthodes RBI (Risk Based Inspection) donnent les fondamentaux pour aboutir à des plans de maintenance optimisés tout en garantissant la sécurité et la disponibilité des ouvrages en service. Dans cet article, ces concepts sont appliqués à un quai constitué par un rideau de palplanches soumis à la corrosion uniforme et la dépendance spatio-temporelle de la performance des courbes ROC (Caractéristique Opérationnelle du Récepteur) est étudiée.
Keywords
Decision process, detection theory, probabilistic modeling of inspection, Maintenance plans, Non-Destructive Testing (NDT) tools.
1 Introduction
Reassessment of existing structures generates a need for up-dated materials properties. Non Destructive Testing (NDT) tools are often required for the inspection of coastal and marine structures where conditions of inspection are harsh. In these fields, the cost of inspection can be prohibitive and an accurate description of the on-site performance of NDT tools must be provided. Inspection of existing structures by a NDT tool is not perfect and it has become a common practice to model their reliability in terms of probability of detection (PoD), probability of false alarms (PFA) and Receiver Operating Characteristic (ROC) curves [1]. These quantities are generally the main inputs needed by owners of structures in view to achieve Inspection, Maintenance and Repair plans (IMR) [2] through Risk Based Inspections methods (RBI). The assessment of PoD and PFA is even deduced from inter-calibration of NDT tools or from the modeling of the noise and the signal [3]. In this last case when the
NDTCE’09, Non-Destructive Testing in Civil Engineering Nantes, France, June 30th – July 3rd, 2009
noise and the signal depend of the time and the location on the structure PoD and PFA are spatio-temporally dependent.
This aspect is highlighted for a steel sheet pile seawall submitted to uniform corrosion. In a first part, the probabilistic modeling of residual thickness measurements obtained by Non-Destructive Testing (NDT) tool is illustrated based on detection theory. Second part is devoted to the introduction of inspection results in decision process. Finally, results of cost analysis are compared with results obtained by the αδ method.
2 Corrosion of steel sheet pile seawalls in marine environment
Corrosion of steel structures is classically assessed by ultrasonic non destructive testing. In France, a protocol is given by the CETMEF (French Center for Maritime and Fluvial Technical Studies). This protocol consists in performing residual thickness measurements for several depths of the structure. By using this technique and considering the harsh conditions for marine inspections, the noise on the measurements at a given point on the structure cannot be neglected. Error comes both from the physical measurement (around 0.1 mm) and from the protocol (grinding, link diver-operator, etc.). Thus three measurements are performed on a given location: every 120° in a circle, with diameter of about 5 cm. The average of these three readings is considered as the “true” measurement of residual thickness. We assume that the variance between each of the three readings and their average corresponds to the noise.
In this paper, we use results given by two campaigns of corrosion measurements realised by ultrasonic non destructive testing at two times (T1 = 22 and T2 = 38 years) during the life of a wharf. Corrosion measurements are studied at two different depths (D1, D2). D1 is located in the zone of low seawater level and D2 in the immersion zone near the mud zone. In each case, characteristics of noise η and loss of thickness dˆ (signal+noise) are illustrated on Fig. 1 and Fig.2.
-2 0 2 4 6 8 10 0 0.5 1 1.5 2
Loss of thickness and Noise (mm)
PD
F
Loss of thickness Noise
Fit Loss of thickness Fit Noise T1-D1 -2 0 2 4 6 8 10 0 0.5 1 1.5 2
Loss of thickness and Noise (mm)
PD
F
Loss of thickness Noise
Fit Loss of thickness Fit Noise T1-D1 -2 0 2 4 6 8 10 0 0.5 1 1.5 2
Loss of thickness and Noise (mm)
PD
F
Loss of thickness Noise
Fit Loss of thickness Fit Noise T2-D1 -2 0 2 4 6 8 10 0 0.5 1 1.5 2
Loss of thickness and Noise (mm)
PD
F
Loss of thickness Noise
Fit Loss of thickness Fit Noise T2-D1 -2 0 2 4 6 8 10 0 0.5 1 1.5 2
Loss of thickness and Noise (mm)
PD
F
Loss of thickness Noise
Fit Loss of thickness Fit Noise T1-D2 -2 0 2 4 6 8 10 0 0.5 1 1.5 2
Loss of thickness and Noise (mm)
PD
F
Loss of thickness Noise
Fit Loss of thickness Fit Noise T1-D2 -2 0 2 4 6 8 10 0 0.5 1 1.5 2 2.5 3
Loss of thickness and Noise (mm)
PD
F
Loss of thickness Noise
Fit Loss of thickness Fit Noise T2-D2 -2 0 2 4 6 8 10 0 0.5 1 1.5 2 2.5 3
Loss of thickness and Noise (mm)
PD
F
Loss of thickness Noise
Fit Loss of thickness Fit Noise
T2-D2
Figure 1. Pdf of loss of thickness and noise
at time T1 for depths D1, D2.
Figure 2. Pdf of loss of thickness and noise
Loss of thickness due to corrosion increases logically in the time and is the most important in the zone of low seawater level (D1). Furthermore, loss of thickness decreases with depth. We also notice that the standard deviation of loss of thickness increases in the time, but decreases with depth.
Due to its definition, noise is represented by a mean equal to 0 and a standard deviation which seems to be constant for the two depths studied at a given time. We highlight the fact that standard deviation of noise is more important at time T1 that at time T2 (0.4 versus 0.3). At first, we explain this difference by an improvement of the quality of protocol in the time. However, this hypothesis must be validated through the analysis of the other corrosion measurements available within the framework of the project GEROM (Risk Management of maritime and river structures in harbours).
3 Probabilistic modeling of inspection based on detection theory
3.1 Probability of detection and probability of false alarm
Assessment of Probability of Detection (PoD) and Probability of False Alarm (PFA) from the knowledge of detection threshold can be directly deduced from inter-calibration of NDT tools [3]. Generally these projects are expensive, and consequently, sometimes it is necessary to choose another approach. This article takes place in this context where inter-calibration is not available. So calculation of PFA and PoD results from probabilistic modeling of the noise and signal+noise pdf [1].
Fig.1 and Fig. 2 illustrate the probability density functions to be computed for the evaluation of PoD and PFA in the case where signal+noise and noise are represented by discrete and continuous distributions. The choice of the theoretical distributions and then the parameters to fit the data were be found by computing the maximum likelihood estimate. In most of time, loss of thickness is fitted by Gumbel distribution and noise by normal distribution.
3.2 Receiver Operating Characteristic (ROC) curve
ROC curve links the Probability of Detection and the Probability of False Alarm. For a given detection threshold ad, the couple (PFA, PoD) allows defining NDT performance. This couple can be considered as coordinates of a point in R2 with axis PFA and PoD. Let us consider that ad takes values in the range ]–∞;+∞[, these points belong to a curve called Receiver Operating Characteristic (ROC).
ROC curves plotted on Fig. 3 and Fig. 4 are computed with the pdf presented on Fig. 1 and Fig. 2. ROC curves indicated “ ROC ” corresponding to discrete distributions and respectively “ ROC’ ” to continuous distributions.
0.0 0.1 0.2 0.3 0.4 0.5 0.6 0.7 0.8 0.9 1.0 0.0 0.1 0.2 0.3 0.4 0.5 0.6 0.7 0.8 0.9 1.0 PFA PoD ROC (T1-D1) ROC (T1-D2) ROC' (T1-D1) ROC' (T1-D2) 0.0 0.1 0.2 0.3 0.4 0.5 0.6 0.7 0.8 0.9 1.0 0.0 0.1 0.2 0.3 0.4 0.5 0.6 0.7 0.8 0.9 1.0 PFA PoD ROC (T2-D1) ROC (T2-D2) ROC' (T2-D1) ROC' (T2-D2)
Figure 3. ROC curves obtained at time
T1 for depths D1, D2.
Figure 4. ROC curves obtained at time
NDTCE’09, Non-Destructive Testing in Civil Engineering Nantes, France, June 30th – July 3rd, 2009
Looking for the best detection performances, the probability of detection should always take larger values than the probability of false alarm (low noise sensibility). We have then PoD ≥ PFA.
The probability of detection is an increasing function of the defect size. This aspect is highlighted for example by ROC (T1-D1) and ROC (T2-D1).
ROC curve is a fundamental characteristic of the NDT tool performance for a given defect size. Perfect tool is represented by a ROC curve reduced to a single point whose coordinates are: (PFA, PoD) = [0, 1]. The worst curve is the one with the lowest signal / noise ratio (ROC (T1-D2)), meaning that some noise can be easily detected, even if nothing is to be detected and finally leading to a high number of false alarms. Overall performances are poor. At the opposite, the best plotted ROC curve is the one with a high signal / noise ratio (ROC (T2-D1)). Differences with the previous curve are considerable. The probability of detection reaches very quickly values near 1, with small probabilities of false alarms for high values of PoD. Overall performances are very good.
4 Introduction of inspections results in decision process
To introduce inspections results in a RBI scheme, conditional probabilities Pi have to be defined. Then a bayesian modeling is suitable and decision theory offers the theoretical basis [1]. Note that an inspection result can be entirely characterized by a set (PoD, PFA). So, in view to perform a cost analysis, points of ROC curves can be considered for the computation of P where characterizes the scenario in the decision tree [1]. If the detection threshold is unknown, the performance of the technique is given by the whole ROC curve. Then, computation of P leads to project ROC curves on P surfaces. I
i i∈[1:4]
i i n this case, Pi are replaced in
cost analysis by the following performance indicator (e.g. Eq. 1):
∫
= ROC i ROC ROC ROC i Pdl L 1 ) ) P (( µ (1)where lROC is the curvilinear abscissa along the projected ROC curve on Pi surface,
ROC i
P value of Pi at this abscissa and the length of ROC curve in (PFA, PoD) plane. This indicator can be interpreted as the ratio of the area under the projected ROC and the length of this curve in (PFA, PoD) plane.
ROC
L
Optimization of the inspection plans lies generally on a minimization of a cost function. In case of inspections, two cost functions are considered. They are related to the cases of detection or no detection. For simplicity, we consider here the policy: a ‘detection’ leads to a repair; a ‘no detection’ leads to a failure in case of defect presence and to another inspection in case of defect absence.
In the following, we focus only on the cost overrun in case of no detection which is denoted E(C)nd (e.g. Eq. 2).
) ) P (( C ) C ( E nd = 3µ 3 ROC (2)
where: is the extra cost associated to the event “defects knowing that there are no detected defects”: 3 C failure inspection 3 C C C = +
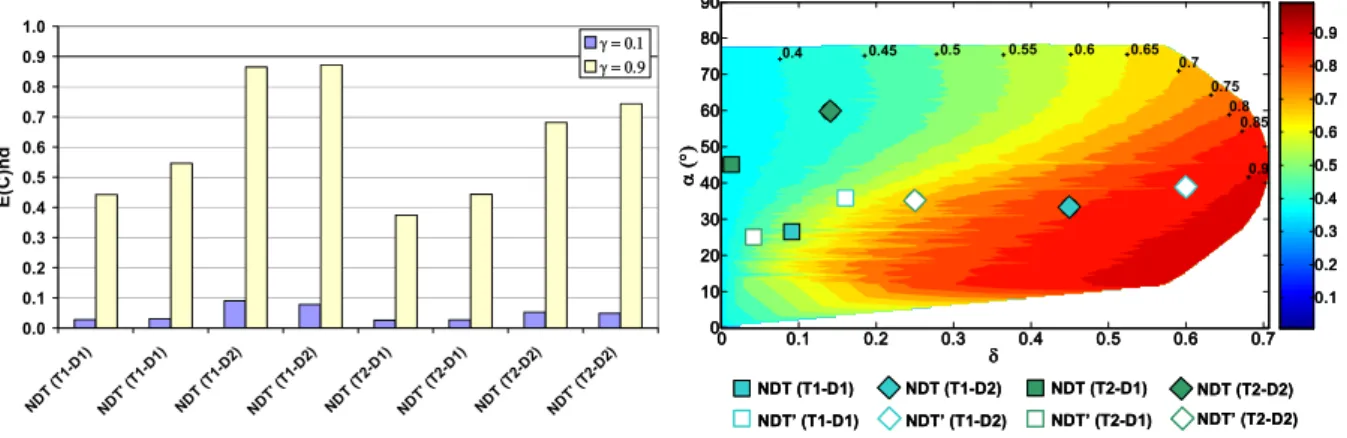
Extra cost expectation in case of no detection E(C)nd is presented on Fig. 5 for values of
γ equal to 0.1 and 0.9. γ corresponds to the probability of defect presence used in calculation of the conditional probabilities Pi [1]. Influence of γ on extra cost in case of no detection
nd ) C (
0.0 0.1 0.2 0.3 0.4 0.5 0.6 0.7 0.8 0.9 1.0 NDT (T 1-D 1) NDT' ( T1-D 1) NDT ( T1-D 2) NDT' ( T1-D 2) NDT (T 2-D 1) NDT' (T2-D 1) NDT (T2-D 2) NDT' ( T2-D 2) E( C)nd γ = 0.1 γ = 0.9 0.4 0.45 0.5 0.55 0.6 0.65 0.7 0.75 0.8 0.85 0.9 δ α (° ) 0 0.1 0.2 0.3 0.4 0.5 0.6 0.7 0 10 20 30 40 50 60 70 80 90 0.1 0.2 0.3 0.4 0.5 0.6 0.7 0.8 0.9 NDT’ (T1-D1) NDT’ (T1-D2) NDT’ (T2-D1) NDT’ (T2-D2) NDT (T1-D1) NDT (T1-D2) NDT (T2-D1) NDT (T2-D2) 0.4 0.45 0.5 0.55 0.6 0.65 0.7 0.75 0.8 0.85 0.9 δ α (° ) 0 0.1 0.2 0.3 0.4 0.5 0.6 0.7 0 10 20 30 40 50 60 70 80 90 0.1 0.2 0.3 0.4 0.5 0.6 0.7 0.8 0.9 NDT’ (T1-D1) NDT’ (T1-D2) NDT’ (T2-D1) NDT’ (T2-D2) NDT (T1-D1) NDT (T1-D2) NDT (T2-D1) NDT (T2-D2)
Figure 5. Extra cost expectation in case of no detection E(C)nd .
Figure 6. Mapping of extra cost in case of no detection E(C)nd in Polar plane for γ=0.9.
Extra costs are minimum for corrosion measurements realized in the zone of low seawater level (D1) where loss of thickness is the most important. Consequently, due to the spatial dependence of corrosion process, extra costs increase with depth, i.e. in immersion zone (D2). The worst performance detection corresponding to corrosion measurements realized at the depth D2 where the signal+noise / noise ratio is the lowest. In this case, some noise can be easily detected, even if nothing is to be detected and finally leading to a high number of false alarms.
Performance detection increases between the two times of inspection (T1, T2) due to the temporal dependence of corrosion process which leads to an increase of signal+noise / noise ratio. These results lead to say that from a point of view of the detection, it's better to wait as long as possible before realizing corrosion measurements. However, to define the optimal inspection interval for structures, the probability of failure must be also introduced into the cost analysis [2].
Finally, differences between extra costs obtained with discrete and continuous distributions are observed.
5 The αδ method: Effect of the shape of ROC curves on the decision
process
5.1 Aim and principle
The αδ method lies on the characterization of ROC curves by the Polar coordinates of the Best Performance Point of the NDT tool (NDT-BPP). This point corresponds on the ROC curve to the minimal distance between the curve and the best performance point BPP of coordinates (PFA = 0, PoD = 1) [4] NDT-BPP is defined by:
• the radius δNDT equal to the performance index (NDT-PI) (distance between the best performance point and the ROC curve).
• the angle αNDT between axis (PFA = 0) and the line (BPP, NDT-BPP).
Objective of the αδ method is to perform parametric studies lying on two parameters to analyze the effect of the shape of ROC curves on the decision process: inspection, maintenance and repair. To achieve this goal, the influence of the performance of ROC curves, represented by δNDT and αNDT, is appreciated through the expectation of the extra cost in case of detection E(C)d and the extra cost in case of non detection E(C)nd .
NDTCE’09, Non-Destructive Testing in Civil Engineering Nantes, France, June 30th – July 3rd, 2009
5.2 Influence of NDT-BPP Polar coordinates on extra costs and comparison with results obtained by cost analysis
The parameters of the αδ method (Polar coordinates of NDT-BPP) for the ROC curves plotted in Fig. 2 and Fig. 3 are indicated on mapping of extra cost in case of no detection (Fig. 6). Then a comparison between results given by mapping and cost analysis is made.
Variances exist between extra costs obtained with each of both methods when discrete distributions are used. We highlight the fact that due to the sensibility of extra costs to the Polar coordinates of NDT-BPP in the αδ method, the lack of precision on the value of αNDT when discrete distributions are used, can lead to a bad exploitation of the mapping.
On the contrary, the extra costs in case of no detection obtained with αδ method and cost analysis are coherent when continuous distributions of signal+noise and noise are used.
So, to increase the reliability during the exploitation of the previous mapping, we propose to use the projection on polynomial chaos to characterize the noise and signal+noise [5,6].
6 Conclusions
Concepts of ROC curves coming from detection theory are very useful in order to quantify the performance of Non-Destructive-Techniques. This paper reminds the main topics coming from detection theory and probabilistic modeling of inspections results in view to provide inputs in the computation of mathematical expectation of RBI cost models. These aspects are treated by an illustration of the process for the RBI of steel harbour structures submitted to uniform corrosion.
Effect of the shape of ROC curves on the extra costs is analyzed through the αδ method. The objective of these method is to assess the influence of the performance of NDT tools, characterized by Polar coordinates δNDT and αNDT in the plane (PFA , PoD), through the expectation of the extra costs in case of detection E(C)d and E(C)nd in case of non detection. In this study, a comparison of extra costs in case of no detection obtained with the cost analysis and the αδ method is made.
References
1. Rouhan, A., Schoefs, F. (2003) "Probabilistic modelling of inspections results for offshore
structures", Structural safety, vol 25, pp. 379-399, 20 pages, Elsevier Ltd.
2. Sheils, E., O’Connor, A., Breysse, D., Schoefs, F., and Yotte, S. (2008) "Development of a
two stage inspection process for the assessment of deteriorating bridge structures", Journal of Bridge Engineering (Publication of the American Society of Civil Engineers).
3. Rudlin, J.R., Dover, W.D. (1996) "The ICON database. Assisting underwater inspections",
Offshore technology, vol. 4.
4. Schoefs, F., Clément, A., Memet, J.B., and Nouy, A. (2007) "Spatial dependence of
Receiver Operating Characteristic curves for Risk Based Inspection of corroded structures: application to on-pile wharf", Proc. of 10th International Conference on Applications of Statistics and Probability in Civil Engineering, (I.C.A.S.P’07), July31-August 3 2007,
Tokyo, Japan.
5. Schoefs, F., Clément, A., Memet, J.B., Nouy, A. (2008) "Inspection of Steel structures in
Coastal Area with NDT tools: use of polynomial chaos decomposition for building Receiver Operating Curves", Proceeding of 1st International Conference on Applications Heritage and Constructions in Coastal and Marine Environment, (MEDACHS’08), 28-30
January 2008, Lisbon (LNEC), Portugal.
6. Schoefs, F., Clément, A., Nouy, A. (2009) "Assessment of spatially dependent ROC