HAL Id: hal-00539282
https://hal.archives-ouvertes.fr/hal-00539282
Submitted on 24 Nov 2010
HAL is a multi-disciplinary open access
archive for the deposit and dissemination of sci-entific research documents, whether they are pub-lished or not. The documents may come from teaching and research institutions in France or abroad, or from public or private research centers.
L’archive ouverte pluridisciplinaire HAL, est destinée au dépôt et à la diffusion de documents scientifiques de niveau recherche, publiés ou non, émanant des établissements d’enseignement et de recherche français ou étrangers, des laboratoires publics ou privés.
Contribution of image analysis to the description of
enzymatic degradation kinetics for particulate food
material
Marie-Francoise Devaux, Ina Taralova, Jacques Lévy Véhel, Estelle Bonnin,
Jean-Francois Thibault, Fabienne Guillon
To cite this version:
Marie-Francoise Devaux, Ina Taralova, Jacques Lévy Véhel, Estelle Bonnin, Jean-Francois Thibault, et al.. Contribution of image analysis to the description of enzymatic degradation kinetics for particulate food material. International Journal of Food Engineering, De Gruyter, 2006, 77 (4), pp.1096-1107. �hal-00539282�
Contribution of image analysis to the description of enzymatic degradation kinetics for
particulate food material
M.-F. Devaux1*, I. Taralova2, J. Levy-Vehel2, E. Bonnin1, J .-F. Thibault1, F. Guillon1
1 : Unité de Recherche sur les Polysaccharides, leurs Organisations et Interactions. INRA. BP
71627, 44316 Nantes Cedex 03
2 : IRCCYN, Ecole Centrale de Nantes. 1 rue de la Noë - 44321 Nantes Cedex 03
*Corresponding author: M.-F. Devaux:
Abstract
The objective of the present work was to relate the physical evolution quantified by image
analysis to the chemical transformation of beet pulp particles during enzymatic degradation. Beet
pulps were degraded into a torus reactor equipped for visualisation. Pectinolytic and cellulolytic
enzymes were used separately or in combination. Two global image analysis techniques were tested
to characterise the size distribution of overlapping particles. Granulometric curves were extracted
by mathematical morphology and a regularisation dimension was assessed by fractal analysis. Both
techniques proved efficient to follow particle size evolution during degradation. When using
cellulolytic enzymes alone, no chemical or physical evolution was observed. When using
pectinolytic enzymes, a chemical modification occurred without any physical evolution. Particles
physically disappeared when both enzymes were used. The chemical and physical evolutions of
particles during degradation were interpreted taking into account the current model of molecular
arrangement of primary cell walls.
Introduction
Plant cell wall degrading enzymes are largely exploited in agricultural and industrial processes as
processing aid in food and non-food industry. Enzymatic compared to chemical treatments offer
several advantages: they have low energy impact and are not detrimental to the environment. The
products and derived products can be regarded as “natural”(EC directive 88/388). Though largely
validated for industrial purpose, research concerning the degradation of plant cell wall through
enzymes is still active and aim at a better understanding on the chemical basis of enzymatic
degrading process and on their biochemical limits.
When enzymes interact with complex solid substrates, a complete analysis would have to
consider the physical structure in addition to the biochemical evolution. Few studies report the
effect of enzyme degradation on the microstructure of plant cell walls (Dongowski, 2001) and no
papers were found concerning the evolution at a macroscopic scale. In most applications, at the
initial stage of reaction, the plant materials are under the form of particles composed of portions of
tissues or fragmented cell walls. When submitted to enzyme action, particles may be either eroded,
or fragmented, producing a size reduction. This evolution depends on the substrate properties, i.e.
porosity, surface properties of the particles and cell walls, local chemical structure, as well as on the
enzymes individual activity and synergy. Following particle size distributions during degradation
jointly with the biochemical modifications would provide a first insight both in the substrate
structure and the enzyme mode of action.
Following reaction kinetics can be achieved by sampling at given time or by using sensor in
order to perform online measurement without external modification or interruption of the reaction.
Laser light diffraction can be used for this purpose and apparatus are proposed for industrial on-line
control (Witt & Röthele, 1988). An alternative is to use a CCD video camera to visualise the
particles and to extract size distribution by image analysis techniques. Several papers report the use
Sarker, Bertrand, Chtioui & Popineau, 1998). Observing enzymatic degradations usually performed
in stirred-tank reactor was a tricky challenge without sampling in the media. Alternative reactors
based on a torus geometry have been proposed to achieve enzymatic hydrolyses, the reactive media
circulating into the torus directed by a propeller (Nouri, Legrand, Popineau & Belleville, 1997).
Among the advantages of such reactors are pointed out their easy scale-up, their mixing behaviour
that prevents deposition of material on the wall (Belleville, Nouri & Legrand, 1992). In the present
work, an additional advantage was found in the possibility to adapt the system for visualisation. For
this purpose, a prototype has been built from a torus basis stretched to include a window from
which particles can be observed (Devaux, Rival, Sire, Papineau & Guillon, 1998). Using this
system, images could be automatically acquired on-line and were next processed for particle size
characterisation.
Size and morphology using image analysis are usually quantified after individual
segmentation of the particles, their area, length and elongation being measured. Enzymatic
hydrolyses are generally realised in concentrated media. In such conditions, particles may be
densely packed and difficult to segment and isolate individually using fully automatic procedure.
Another approach consists in performing a global characterisation of particles using image texture
description. Image texture can be defined as the spatial arrangement of grey level in images. In this
context, small particles produce more frequent grey level changes inducing a finer texture than large
particles. Several methods have been proposed for extracting textural features from images
(Haralick, 1979) among which some have been proposed to characterise particle size.
Co-occurrence features have proved efficient for correlation with the mean particle diameter and for
quantifying changes in yeast floc size during continuous fermentation (Mas et al., 2001). Constant
grey level run length has been applied for the characterisation of bulk pea powders (Bertrand,
Mathematical morphology transformations have been applied to extract granulometric
information from grey level images (Michelland, Schiborr, Coster, Mordike & Chermant, 1989,
Devaux, Melcion & Le Deschault De Monredon, 1997). All these works show that textural features
can be advantageously applied in context where particles could hardly been automatically
individualised. In addition, Novales, Guillaume, Devaux & Chaurand (1998) have found that these
techniques were at least equally efficient for size characterisation of in-flow milling product for
which individual segmentation could be performed.
In recent years, there has been an increasing interest in the field of fractal methods to
describe structures in the food-processing domain. The reported food applications of fractals mainly
dealt with the characterization of the contours of binarised particles such as agglomerated instant
coffee particles (Nuebel & Peleg, 1994) or ice crystals (Hagiwara, Wang, Suzuki & Takai, 2002).
Gels have been characterised by fractal image analysis after binarisation such as fats crystal
network (Narine & Marangoni, 1999) or particulate protein gels (Marangoni, Barbut, McGauley,
Marcone & Narine, 2000, Pugnaloni, Matia-Merino & Dickinson, 2005). Fractal analysis has also
been developed within the context of image texture analysis. Quevedo, Carlos, Aguilera & Cadoche
(2002) applied the technique to describe food surfaces. They showed that the fractal dimension
increased monotonically with increased roughness (i.e. grain size and visual texture) of sandpaper.
The objective of the present work was to relate the physical evolution during enzymatic
degradation to the chemical transformation. Beet pulps were chosen as a model substrate for
particulate plant material. They are mainly constituted of cell walls and composed of pectins and
cellulose (Thibault, Renard & Guillon, 1994). The enzymatic degradation of beet pulps through
pectinolytic and cellulolytic enzymes has been largely described to find issues with high adding
value (Micard, Renard &Thibault, 1996, Bonnin, Grangé, Lesage-Meesen, Asther &Thibault 2000).
Until now, no attention was paid to the physical evolution of the substrate during the reactions. In
their ability to describe particle size during enzymatic degradation. Mathematical morphology was
chosen for its ability to extract granulometric distribution directly interpretable as particle size
characterisation. Fractal analysis was tested as a first attempt to correlate the fractal dimension to a
particulate structure and to its evolution during enzymatic degradation.
Material and Methods
Sugar beet pulp
The reactions were studied for dry beet pulp (Lyven, France) grounded using a Retsch Gmb H
grinder (Germany). The sieve fraction between 410 and 500 µm was chosen for the analysis. The
dry matter of the ground beet pulp particles was 92%. The sugar content of the raw pulp is given in
table 1. Galacturonic acids and arabinose reveal the initial amount of pectins and glucose the
amount of cellulose. Other constituents than polysaccharides were not analysed. They are known to
be composed of ashes, proteins, and lignin (Micard et al., 1996).
Enzymatic preparations
The pectinolytic mixture SP 584 (Aspergillus niger) and the cellulolytic mixture Celluclast 1.5L
(Trichoderma reesei) were obtained from Novo NordiskA/S (Bagsvaerd, Denmark).
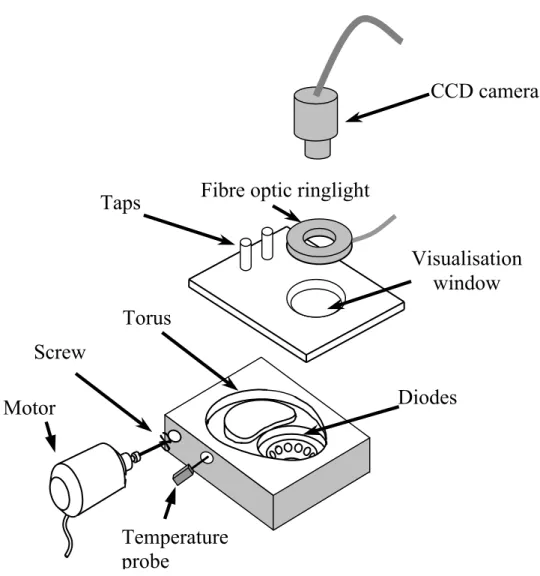
Description of the torus reactor
The reactor used was a prototype especially designed at INRA (Nantes) to visualise dietary fibre
particles during enzymatic degradation. A stirring system and a thermostatic control were necessary
to provide appropriate conditions to achieve the reactions. In addition, the reactor had to comprise a
system for lighting and visualising the particles. Figure 1 shows the experimental apparatus.
The reactor was constructed from a piece of aluminium with a torus geometry basis. The radius was
volume was 230 cm3. The torus geometry has been distorted in order to build a circular
visualisation window while preserving the section volume constant all along the torus. A
three-blade screw driven by a variable speed motor ensured the stirring. Three flat resistances have been
stuck under the aluminium basis in order to warm the solution. A regulator controlled the
temperature measured by the thermocouple probe into the reactor. The top of the reactor was made
of transparent polycarbonate and the visualisation window was a neutral video filter (r=25mm).
The lighting of the samples has been designed in order to diffuse light through the particles. Twelve
red diodes (λ=660 nm, 3000 mcd) were enclosed with an orientation of 45° into the aluminium basis to form a ringlight under the visualisation window. The background of the visualisation
window was painted in black colour. A fibre optic ringlight was positioned over the visualisation
window in order to improve the general brightness.
The reactor was linked to a command board that made it possible to control the stirring speed, the
diode intensity and the temperature. The filling was achieved after locking the top by slowly
pumping water through a tap in order to avoid air bubble formation.
Enzymatic degradation
Four kinds of reactions were compared: a reference experiment without enzyme, and three
enzymatic reactions with pectinolytic enzymes, with cellulolytic enzymes, and with both enzymatic
mixtures. SP584 contained several pectinolytic enzymes. It was chosen because it has high
polygalacturonase activities and was only slightly active on cellulose (Micard et al., 1996).
Celluclast 1.5L contained several cellulolytic enzymes and was found efficient in degrading
cellulose rich materials from sugar beet pulp (Bonnin et al., 2000).
The reference experiment and all enzymatic digestions were repeated three times and were
conducted as follows. 1.2 g of ground pulp were hydrated during one night in 30 cm3 of permuted
the volume was completed to 230 cm3. Enzymes were added in a proportion of 1% of pulp dry
matter. Temperature was set to 37 °C. The particles were stirred during all the reaction and moved
continuously in the torus. The motor speed was chosen to ensure a circulation of the particles
without settling at the bottom of the torus.
The reactions were conducted during 24 hours. Samples of 1.7 ml hydrolysates were taken at times
0, 30 min, 1h, 1h30, 2h, 3h, 4h, 6h, 8h, 10h and 24h. Equivalent volume of permuted water was
added to maintain constant the liquid volume of the reactor and avoid the generation of air bubbles
that would interfere with image analysis of particles. The hydrolysates were boiled for 10 min to
inactivate enzymes and centrifuged (800 x g, 15 min). Supernatants were analysed for uronic acid
and neutrals sugars by colorimetry. After 24 h, residues were isolated by centrifugation, washed
with water, dried by solvent exchange, and weighted. This residual material was ground in liquid
nitrogen and analysed for uronic acid and individual neutral sugars by gas liquid chromatography.
Some wet residual particles were taken at the end of the reaction to characterise their physical
structure. Particles were stained (10 min) with 0.02% acridin orange (CI46005) in 0.1 mol.L-1
phosphate buffer (pH 7). They were observed by confocal laser scanning microscopy (Zeiss LSM
410 confocal inverted microscope, Zeiss, Lepecq, France) using a 40x/1.2 water immersion
objective. An argon laser operating at 488 nm wavelength was used as the excitation source and the
fluorescent signal > 515 nm was collected.
Analytical methods
Uronic acids were assayed by an automated metahydroxybiphenyl method using galacturonic acid
as a standard (Thibault, 1979). Total neutral sugars were determined by automated orcinol
procedure (Tollier and Robin, 1979) using arabinose as standard after correction for uronic acid
(Englyst et Cummings, 1984). The pulp and residues were first prehydrolysed 1 h in 72% H2SO4 at
room temperature.
Image acquisition
Images of the particles had to be acquired during the degradation process, while the particles were
moving along the torus. For this purpose, a full frame camera SONY XC 8500 CE was used and the
shutter was set to 1/1000 s. The camera was equipped with a Nikon lens (Nikkor 50 mm 1:1.8) and
a 12 mm extension tube and the height was set to observe a 13.3 mm x 10 mm area. The resulting
images were constituted of 768 x 576 pixels, each pixel being of size 17.3 µm x 17.3 µm. The
levels of grey were coded on 256 values, starting from 0 (black) up to 255 (white). The acquisition
was driven by the software VisionStage 1.6fr (Alliance Vision, Mirmande, France).
Images were automatically recorded at times 0, 30 min, 1h, 1h30, 2h and every hour until 24h. Ten
images were acquired at each programmed time. On the course of some experiments, air bubbles
could appear caused by some water evaporation. Few images were disturbed and were eliminated
from the analysis.
Image processing
The objective of image processing was to extract quantitative information concerning the evolution
of the physical state of the particles during the reaction, and mainly the particle size. Examples of
images shown in Figure 2 show that particles largely overlapped making the segmentation of
individuals somewhat difficult. Quantification of particle size was therefore performed directly
from grey level images. Two kinds of image processing tools were used: mathematical morphology
and fractal analysis.
Mathematical Morphology is a set of procedures based on the comparison of portions of images to
elements of given size and shape called "structuring elements" (Serra, 1982). The basic
transformations are "erosion", "dilation", "opening" and "closing". Erosion causes a reduction of
white object and dilation an increase. The effect of opening (erosion followed by dilation) is to
remove white objects for which at least one dimension is smaller than the structuring element ones
while preserving the size of the remaining objects. This property makes opening comparable to a
sieving in area of the objects in the image. By applying openings of increasing size, a granulometric
characterisation of the image can be derived. The procedure, initially developed for binary images,
has also been used for determining size distributions from grey level images (Michelland et al.,
1989). The principle is briefly described.
Opening causes a decrease of the sum of the grey level in the image V depending on the amount of
white objects removed by the operation. By applying openings of increasing size, objects
progressively disappear and a curve of the sum of grey level V according to the size of the
structuring element is built. This raw curve is normalised according to the initial value and derived
to obtain a curve comparable to a size distribution:
) ( ) ( ) 1 ( ) ( ) ( final V initial V i V i V i g − + − = (Eq. 1)
where V(initial) is the volume of the original image, V(final) the volume at the last opening step, i is
one of the opening steps. The g curves are called morphological granulometric curve and measure
the proportion of grey level that are modified between two successive opening steps.
In the present work, the structuring element was the usual square with a reference pixel at the
centre. At the first step, the size of the element was 3 x 3 pixels, at step 2, 5 x 5 pixels, etc… The
size of the structuring element can be expressed in µm rather than in pixels and the granulometric
curves can be drawn relatively to the size rather than to the opening step. Thirty-five opening steps
final granulometric curves were obtained by averaging the individual curves of the images acquired
at each time.
Images were corrected for non-uniform illumination before morphological analysis. A top hat
transformation was applied using a 36 x 36 squared structuring element in order to remove
non-uniform background. A suited white reference was calculated for each image in order to give all
particles similar brightness. Each image was dilated using a 36 x 36 squared structuring element and
all values under 100 were set to the grey level value 100. Normalisation was achieved by dividing
the original image by the white reference obtained and grey levels were adjusted from zero to 255.
Granulometric curves were compared using Principal Component Analysis (Jolliffe, 1986), which
has been proved an efficient technique to compare continuous signal such as spectra (Robert,
Devaux and Bertrand, 1996).
The morphological analysis was developed using procedures from the software Aphelion 3.0E
(ADCIS, Hérouville-Saint-Clair, France). Principal component analysis was applied using the
PLS_Toolbox 2.0 (Eigenvector Research, USA) within the MATLAB environment (The
MATHWORKS, USA).
Fractal analysis: regularization Dimension
Fractional dimensions are one of the best-known parts of fractal analysis. The principle of the
fractional measure called “regularization dimension” is the following (Rouef and Levy-Vehel,
1998). Let I(x,y) denote the image (I(x,y) is the grey level intensity of pixel (x,y)). I is smoothed
(regularized) by convolution with, e.g., a gaussian kernel Kσ of variance σ. Let us denote by Iσ the
regularized image Iσ = Kσ *I. Assume that I is so irregular that the surface (x,y,I(x,y)) in has
infinite area. When images I
3
ℜ
σ are smoothed for all σ >0, their surfaces (x,y,I(x,y)) have finite areaSσ. Furthermore, when σ tends to zero, Iσ tends to I, and Sσ tends to infinity. The regularization
Formally, one sets: σ σ σ log ) log( lim 1 0− + = → S dimR (Eq. 2)
When the limit above does not exist, one considers upper and lower regularization dimensions
R
dim and dimR defined as follows :
σ σ σ log ) log( lim 1 0− + = → S dimR (Eq. 3) σ σ σ log ) log( lim 1 0− + = → S dimR (Eq. 4)
For the numerical calculation of the regularization dimension, the FRACLAB toolbox has been
used (http://www.irccyn.ec-nantes fr/irccyn/Projets/FracLab/Fraclab.html). In practice, one cannot
compute a limit. Instead, a finite range [Nmin, Nmax] has to be chosen for the amount of smoothing,
which is governed by the variance σ of the gaussian kernel Kσ.. Nmin and Nmax define the bounds
between which σ varies, expressed in pixel units. Low values of Nmin and Nmax correspond to
image processing in high frequencies since the width of the smoothing kernel is small. On the
contrary, great Nmin and Nmax values correspond to smoothing with a larger kernel and therefore
the image will be processed at low frequencies. An additional parameter selects the number of
smoothed curves computed between Nmin and Nmax. The fractional dimension is estimated through
a least square linear regression of logSσ versus σ assuming that the graph of (logσ, logSσ) is linear.
When this is not the case, a special type of regression has been applied that is able to estimate an
inferior limit Linf or a superior limit Lsup , giving dim or R dimR (Legrand & Levy-Vehel, 2004).
An example of the use of FRACLAB for calculating the regularization dimension is shown in
Figure 3. The regularization dimension is given by the slope of the graph of the regression and
therefore makes sense only for segments of the graph exhibiting linear behaviour. For the
considered example, two different parts with linear behaviour may be observed: One for low
pictured case as well as for all images considered in this study, the two slopes obtained
corresponded in fact to Linf and Lsup: the points to the left of the graph (high frequencies) line up
with a small slope, while the points to the right (high frequencies) line up with a larger (absolute)
slope.
Results and discussion
Chemical evolution
The reference reaction and the three enzymatic degradations were carried out for 24 hours, during
which samples from the reaction media were withdrawn and images were acquired. At the end of
the reactions, the residual insoluble materials were weighted, the yield of residues being
representative of the degrees of degradation (Micard et al., 1996). For the reference and the
cellulolytic experiments, 76 ± 3 % and 75 ± 4 % of the initial dry matter were recovered, respectively. The values were 31 ± 4 % after the pectinolytic enzyme action and 12 ± 1 % using pectinolytic and cellulolytic enzymes in combination. The values observed for the reference
experiments suggest that at least 20 % of dry matter were made soluble without any enzymes. This
result is in agreement with previous works that reported a spontaneous water solubilisation of 17%
of dry matter for beet fibre (Thibault & Rouau, 1990). The cellulolytic treatment did not bring
further solubilisation. Using pectinolytic enzymes, much less solid materials were recovered.
The sugar composition of the residues is given in Table 1. Glucose was the main component
of the SP584 residues. Expressed in percentage of initial sugar content, most of the glucose (94%),
mannose (90 %) and to a lesser extent xylose (40%) were recovered in the residues. In contrast,
galacturonic acid, arabinose and galactose were extensively released. When both pectinolytic and
cellulolytic activities were present, most of the glucose and to a lesser extent mannose and xylose
polysaccharides. The extent of the chemical degradation in the torus reactor was in agreement with
that reported by Micard et al. (1996).
SP584 enzymes break down beet pectins mainly into galacturonic acids and arabinose and
Cellulast 1.5L enzymes produce cellobiose and glucose from cellulose. The release of neutral
sugars and uronic acid from sugar beet was measured on the time course as tracers of the enzymatic
degradations. Results are given in percentage of sugar solubilisation according to time (Figure 4).
The solubilisation curves for cellulolytic enzymes were confused with the reference experiment
attesting that no degradation occurred. The action of pectinolytic enzymes produced an almost
complete solubilisation of galacturonic acids (around 90 %) and a partial one for neutral sugars
(around 50 %). Degradation was rapid during the first 3 hours and was completed after 6 hours. The
combined action of pectinolytic and cellulolytic increased the solubilisation values for neutral
sugars up to 70% and speeded the reaction completion, as the maximum solubilisation was obtained
after 3 hours. The difference of solubilisation when compared to pectinolytic enzyme action alone
was found significant by variance analysis and corresponded to the cellulose content of beet pulp.
Images during degradation
Figure 2 shows examples of images acquired during enzymatic degradation for the four kinds of
reaction studied. Images proved that the agitation in the reactor lead to a homogeneous distribution
of the particles under the visualisation window. At the concentration studied, images clearly
revealed the particulate nature of the material though particles overlapped and could not be all
identified individually. No evolution of the particles was visible during the reference and the
cellulolytic reactions. When using pectinolytic enzymes, particles seemed preserved while the
solution was slightly made opaque. When both kinds of enzymes were used, a physical degradation
degradation caused when pectinolytic enzymes were used alone did not come with an apparent
physical degradation.
Morphological granulometric curves
Particle size during degradation was studied by mathematical morphology. Figure 5 show examples
of granulometric curves assessed at times 0, 2h, 4h, 6h, 8h, 10h, 12 h and 24 h for the four kinds of
experiments. The curves resulted from the averaging of the individual curves calculated for the
images recorded at each time. For the reference and cellulolytic experiments, large peaks between
100 and 1000 µm were obtained showing no evolution. The maximum was found between 250 and
400 µm, lower than the original particle size of the dried pulp (400-510 µm). The discrepancy can
be explained by the fact that particles are removed from the image when their smallest dimensions
are lower than the opening size. For dried pulps, particle size was determined from sieving which
mainly depend on the largest dimensions and particles were somewhat elongated (Figure 2). In
addition, the curves were calculated from grey level images, one individual particle showing
different grey levels that generated variations for smaller opening size. Grey level variations were
also observed below 100 µm and were mainly attributed to variations both into the solution and
within the particle surface. Granulometric curves were therefore interpreted for their evolution
rather than absolute size distributions.
When using pectinolytic enzymes, the curves were quite similar to the reference experiment. Only a
slight variation was observed for time 24h with a small shift towards lower size. The particle size
evolution when both enzymes were used could be quantified. During degradation, the initial peak
clearly shifts towards lower values and disappear after 6 hours to become a truncated size
distribution.
Principal component analysis was applied on the data table made by gathering all the curves
four kinds of reaction. The objective was to visualise all the data acquired in a synthetic way and to
reveal the variations in position and shape of the granulometric peaks. In particular, slight variations
that could have occurred in the case of the pectinolytic experiments were searched for. Figure 6
show the first principal component scores according to time. Component 1 took into account 97 %
of the total variation observed among the curves and mainly described the evolution during
degradation observed when combining the two kinds of enzymes. This analysis shows that the
particle size diminution began immediately after the beginning of the reaction and was rapid during
the first 6 hours. The evolution of the physical structure was not terminated and continued until 24
hours. The three other kinds of experiment were not distinguished. The slight shift observed in
Figure 5 for the pectinolytic experiments also corresponded to a slight diminution of the scores
observed after 10 hours. The variations could not however be proved significant.
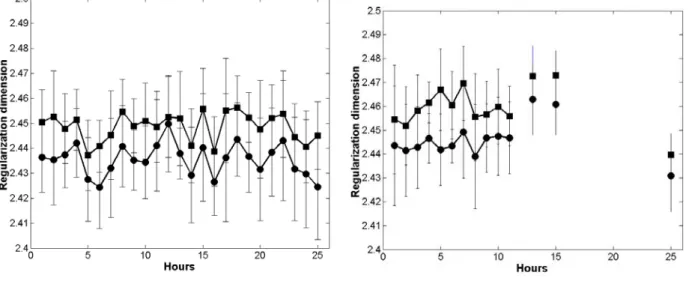
Regularization dimension
A regularization dimension has been calculated for each group of samples and for each hour of the
test. Two different fractal behaviours have been observed, for low and for high frequencies.
Therefore, upper and lower fractional dimensions have been calculated for each sample. Roughly
speaking, the lower fractional dimension measures the irregularity of the distribution since it
corresponds to the low frequencies, and the upper fractional dimension measures the irregularity of
the individual particle and in the medium surrounding particles since it corresponds to the high
frequencies.
Error bars taking into account the standard deviation have been calculated for each test hour.
As it can be seen in figure 7, the error bars had approximately similar small lengths in all
considered cases, which testified of the good representation of the data and the relevance of the
results. The reference samples of beet pulp (not subjected to enzyme action) showed essentially a
good for the upper limit Lsup that for the lower limit Linf and on the other hand, the curves
corresponding to the upper limit and the lower limit are close, which indicates fractal behaviour at
all frequencies. Similar comments could be drawn from the experiment with only cellulolytic
enzyme (Figure 7b). No effect on the enzyme decomposition was observed in terms of evolution of
the regularization dimension with time. Missing points corresponded to hours for which images
were discarded, as bubbles had appeared. In these cases, there were not 10 images per hour and the
data are not shown.
Using pectinolytic enzyme only (Figure 7c), there was a correlation between the
regularization dimension and the enzymatic decomposition but the increase in the regularization
dimension with time was small (2.5 at the end of the experiment). More precisely, one can easily
distinguish two different behaviours on the images corresponding to the first six hours and the
others. As shown from the chemical data, this enzyme acted only during the first six hours. After
the 6th hour, the particles may have become a little fragile and prone to the physical treatment,
which could explain the increase in the irregularity of the image, measured by the fractional
dimension. As in the case of Figure 7a (no enzymes), the upper limit and the lower limit were quite
close to each other (almost equal), which indicated again fractal behaviour at all frequencies.
In the case of the combination of pectinolytic and cellulolytic enzymes (Figure 7d) a strong
evolution of the regularization dimension was observed. The increase was slightly larger for high
frequencies (upper limit). At the end of the reaction, the irregularity of the particles and of the
medium surrounding particles was predominant in the roughness of the image (after hour 16). In
addition, for the last hours, the images did not exhibit a fractal structure at all frequencies, since the
Discussion
The objective of the work was to describe enzymatic degradation of solid particulate materials by
considering both the chemical and the physical evolutions. The kinetics were characterised by the
sugar released on the time course and by the changes in the particulate structure visualised through
images. A torus-based reactor has been developed for the on line image acquisition of particles
during reactions at a macroscopic scale. The system was efficient to observe a large number of
particles in a statistical way without any human intervention. The chemical evolution was measured
after manual sampling of the solution in the reactor. Further development of the machine could be
to associate an automatic sampling towards an analytical apparatus such as a chromatograph. In
addition, such reactor can be equipped with various probes such as conductimetric probes,
electrode, or pH probes (Nouri et al, 1997).
Particle size evolution was quantified by image analysis using global techniques from mathematical
morphology and fractal analysis. Both techniques proved efficient to follow size evolution during
enzymatic degradation. The alternative approach would have consisted in segmenting individual
particles and would have required a much lower concentration of particles in the solution.
Mathematical morphology openings are well adapted to study particle size as they can be compared
to a sieving of the image. The granulometric curves extracted from grey level images can be
regarded as classical granulometric distributions. The major point is that they are related to the area
rather than to the volume or mass of particles. Though the size could be under-estimated in
comparison to other methods and in particular sieving, curves are easy to interpret in relation to
particle size evolution.
The regularization dimension could be used as a successful tool to follow the particle size evolution
during enzymatic degradation. When no particle size evolution occurred, the fractional dimension
was constant. When particles were highly degraded by the two kinds of enzymes, the regularisation
was over after the first few hours, the fractal dimension significantly increased, indicating that a
physical decomposition was still going on. The technique depends on the choice of the size of the
smoothing parameter (wide or narrow kernel). It is possible to refine the study, and to select either
the high frequency properties, i.e. the irregularity of the individual particle or the surrounding
medium, or the low frequency properties, i.e. the irregularity of the particle distribution in the
image.
Both techniques were proved relevant to quantify the physical evolution of the particles during the
enzymatic degradation. Mathematical morphology provides a measure easy to interpret in terms of
granulometry. Regularisation dimensions were nicely related to particle size and made it possible to
reveal a significant evolution of the system when using pectinolytic enzymes alone.
Considering both chemical analysis and the evolution of the physical state quantified by image
analysis, conclusions could be drawn for the four kind of enzymatic reactions. The experiment with
no enzymes showed that no evolution was observed either chemical or physical. Using cellulolytic
enzymes alone, also no chemical or physical evolution occurred. When using pectinolytic enzymes,
a chemical evolution was observed which did not come with an apparent physical evolution at the
macroscopic scale. A particulate structure remained while the solution was made more opaque.
Combining both enzyme activities, pectin and cellulose constituents were made soluble together
with a particle physical degradation.
The chemical evolution of beet pulp occurred only when pectinolytic enzymes were present. The
current models proposed for molecular arrangement describe the primary cell walls as a cellulose
fibre skeleton embedded in the pectin matrix (Carpita & Gibeaut, 1993). The cellulolytic enzymes
could reach the cellulose molecules only when pectin molecules were degraded. The pectin
breakdown gives the cellulases access to their substrates thus making the degradation of cellulose
In presence of both enzymes, the physical degradation of the particles was rapid during the first
hours. This evolution went on in a slower way until the 24 hours of reaction, although the chemical
evolution was finished after 6 hours. When using pectinolytic enzymes, a slight diminution of the
particle size was observed after 10 hours. The evolutions observed after the chemical degradation
was completed, may be attributed to a mechanical stress. The stirring system of the reactor was a
three-blade propeller that produced low shear stress. This was shown by the reference experiments
during which particle size did not changed. Stirring may have however affected particles weakened
after enzymatic degradation.
The preservation of a particulate structure after pectin degradation was not expected as pectins are
described as involved in cellular adhesion. Results showed that the chemical degradation was
almost completed while particles remained. The structure of the residual particles was examined at
the microscopic scale. (Figure 8). Sugar beet root is composed of different tissues: storage
parenchyma and vascular tissue. On the micrographs are presented particles containing vessels with
lignified walls included in parenchymateous tissue. When submitted to pectinolytic enzymes, cell
aspect was modified : cell walls were less clear and cell size was reduced. The vessels remained
intact and were the only residual particles when both enzymes were used. These results showed that
the pectinolytic action modified the microscopic structure of particles but were not able to broke
completely the cell connections. This may be explained by two factors. First, other molecules than
pectin may be involved in cellular adhesion and second, cellular adhesion may have been modified
during beet root processing for sucrose extraction.
Conclusion
The present work aimed at comparing the chemical and the physical evolution of solid materials
when submitted to enzymatic degradation with an application to the enzymatic degradations of beet
a macroscopic scale, close to the process scale. Global image analysis techniques were efficient to
characterise the size evolution when particles highly overlapped. Information concerning the
physical structure at this scale is useful for a statistical approach and complement biochemistry and
microscopic studies. These information are relevant to provide a more complete interpretation of
enzymatic degradation. A deeper insight for understanding both enzyme actions and the
organisation and interaction between the polymers included in cell wall structure can be gained by
References
Belleville, P., Nouri, L. & Legrand, J. (1992). Mixing characteristics in the torus reactor. Chemical
Engineering Journal, 15, 282-289.
Bonnin, E., Grangé, H., Lesage-Meesen, L., Asther, M. & Thibault, J-F. (2000). Enzymic release of
cellobiose from sugar beet pulp, and it use to favour vanillin production in Pycnoporus cinnabarinus
from vanillic acid. Carbohydrate Polymers, 41, 143-151.
Bertrand, D., Robert, P., Melcion, J.-P. & Sire, A. (1991). Characterisation of powders by video
image analysis. Powder Technology, 66, 171-176.
Carpita, N. C. & Gibeaut, D. M. (1993). Structural models of primary cell walls in flowering
plants : consistency of molecular structure with the physical properties of the walls during growth.
The Plant Journal, 14, 875-884.
Devaux, M.-F., Melcion, J.-P. & Le Deschault De Monredon, F. (1997). Particle size analysis of
bulk powders using mathematical morphology. Powder Technology, 90, 141-147.
Devaux, M.-F., Rival, M., Sire, A., Papineau, P. & Guillon F. (1998). A reactor for the continuous
determination of particle size by image analysis during enzymatic degradation of dietary fibre. In
Proceedings of the 7th European Symposium Particle Characterization PARTEC 98. Preprints III
(pp. 1005-1014). NürnbergMesse GmbH. Nürnberg, March 10-12.
Dongowski, G. (2001). Enzymatic degradation studies of pectin and cellulose from red beets.
Nahrung/Food, 45, 324- 331.
Englyst, H.N. & Cummings, J.H. (1984). Simplified method for the measurement of total non starch
polysaccharides by GL chromatography of constituent sugars as alditol acetates. Analyst, 109,
937-942.
Hagiwara, T., Wang, H., Suzuki, T. & Takai R. (2002). Fractal analysis of ice crystals in frozen
Haraclick, R. M. (1979). Statistical and structural approaches to texture. Proceedings IEEE, 67,
786-804.
Jolliffe, I.T. (1986). Principal Component Analysis. New York: Springer-Verlag.
Legrand, P. & Levy Vehel, J. (2004). Signal and image processing with Fraclab. In Fractal 2004.
Vancouver, April 4-7.
Marangoni, A. G., Barbut, S., McGauley, S.E., Marcone, M. & Narine, S. S. (2000). On the
structure of particulate gels- the case of salt-induced cold gelation of heat-denatured whey protein
isolate. Food Hydrocolloids, 14, 61-74.
Mas, S. & Ghommidh, C. (2001). On-line measurement of yeast aggregates using image analysis.
Biotechnology and Bioengineering, 76, 91-98.
Micard, V., Renard, C. M. G. C & Thibault, J-F. (1996). Enzymic saccharification of sugar beet
pulp. Enzyme and Microbial Technology, 19, 162-170.
Michelland, S., Schiborr, B., Coster, M., Mordike, B. L. & Chermant, J. L. (1989). Size distribution
of granular material from unthresholded images. Journal of Microscopy, 156, 303-311.
Narine, S. & Marangoni, A. (1999). Microscopic and rheological studies of fat crystal networks,
Journal of Crystal Growth, 1315-1319.
Nouri, L., Legrand, J., Popineau, Y. & Belleville, P. (1997). Enzymatic hydrolysis of wheat
proteins. Part 2: comparison of performance of batch-stirred and torus reactor. Chemical
Engineering Journal, 65, 195-199.
Novales, B., Guillaume, S., Devaux, M.-F. & Chaurand, M. (1998). Particle size characterisation of
in-flow milling products by video image analysis using global features. Journal of the Science of
Food and Agriculture, 78, 187-195.
Nuebel, C. & Peleg, M. (1994). A Research Note Compressive Stress-Strain Relationships of
Pugnaloni, L. A., Matia-Merino, L. & Dickinson, E. (2005). Microstructure of acid-induced
caseinate gels containing sucrose: Quantification from confocal microscopy and image analysis.
Colloids and Surfaces B: Biointerfaces, 45, 211-217.
Quevedo, R, Carlos, L.-G., Aguilera, J. M. & Cadoche, L. (2002). Description of food surface and
microstructural changes using fractal image texture analysis. Journal of Food Engineering, 53,
361-371.
Robert, P., Devaux, M.-F., Bertrand, D. (1996). Beyond prediction: extracting relevant information
from near infrared spectra. Journal of Near Infrared Spectroscopy, 4, 75-84.
Roueff, F. & Lévy Véhel, J. (1998). A Regularization Approach to Fractional Dimension
Estimation. in Proceedings of Fractals 98, Malta.
Sarker, D. K., Bertrand, D., Chtioui, Y. & Popineau, Y. (1998). Characterisation of foam properties
using image analysis. Journal of Texture Studies, 29, 15-42.
Serra, J. (1982). Image Analysis and Mathematical Morphology. London: Academic Press.
Thibault, J.-F. (1979). Automatisation du dosage des substances pectiques par la méthode au
béta-hydroxydiphényl. Lebensmittel-Wissenschaft und Technologie, 12, 247-251
Thibault, J.-F. & Rouau, X. (1990). Studies on enzymatic hydrolysis of polysacharides in sugar beet
pulp. Carbohydrate Polymers, 13, 1-16.
Thibault, J.-F., Renard, C. M. G. C. & Guillon, F. (1994). Physical and chemical analysis of dietary
fibre in sugar beet and vegetables. In H.F. Linsken and J.-F. Jackson, Modern methods of plant
Analysis, Vegetables and Vegetables Products, vol 16 (pp. 23-55). Berlin : Springer-Verlag.
Tollier, M.T. & Robin, J.-P. (1979). Adaptation de la méthode à l'orcinol sulfurique au dosage
automatique des glucides neutres totaux : conditions d'application aux extraits d'origine végétale.
Witt, W. & Röthele, S. (1998). In-line laser diffraction with innovative sampling. In Proceedings of
the 7th European Symposium Particle Characterization PARTEC 98. Preprints II (pp. 611-624 ).
Legend of figures
Figure 1: Torus reactor prototype
Figure 2: examples of images of beet pulp during enzymatic degradation. First row: without
enzyme, second row: with cellulolytic enzymes, third row: with pectinolytic enzymes, fourth row:
with both kind of enzymes. Left, middle, right: after 0, 6 and 24 h of degradation, respectively.
Figure 3: Numerical calculation of the regularization dimension using FRACLAB
Figure 4: solubilisation percentage for neutral sugars (a) and galacturonic acid (b). Square:
reference experiment, diamond: cellulolytic enzymes, circle: pectinolytic enzymes, triangle: both
enzymes.
Figure 5: Granulometric curves assessed using mathematical morphology. a: reference experiment,
b: cellulolytic enzymes, c: pectinolytic enzymes, d: both enzymes.
Figure 6: Principal component analysis of granulometric curves. First principal scores according to
time. Square: reference experiment, diamond: cellulolytic enzymes, circle: pectinolytic enzymes,
triangle: both enzymes.
Figure 7: Evolution of the regularization dimension. a: reference experiment, b: cellulolytic
enzymes, c: pectinolytic enzymes, d: both enzymes. (circle: Linf, square: Lsup).
Figure 8: Residual particles after 24h reactions observed by confocal microscopy. Top left:
reference experiment, top right: cellulolytic enzymes, bottom left: pectinolytic enzymes, bottom
right: both enzymes. Size of images: 325 µm x 325 µm.
Legend of tables:
Table 1: Sugar compositions expressed as percentage of dry matter of the raw sugar beet pulp and
Table 1 raw sugar beet pulp Without enzyme Celluclast 1.5L SP584 SP584 Celluclast 1.5L Rhamnose 1.8 1.3 1.4 0.5 0.7 Arabinose 18.0 18.1 18.5 1.3 1.9 Xylose 1.3 1.3 1.2 1.6 2.3 Mannose 1.0 1.0 1.0 2.7 2.6 Galactose 4.7 4.8 5.3 1.3 1.6 Glucose 19.5 20.7 18.3 54.4 8.5 Galacturonic acid 18.9 18.5 18.4 2.1 4.0
Figure 1
Taps
Screw
CCD camera
Temperature
probe
Torus
Fibre optic ringlight
Diodes
Visualisation
window
Figure 2. 0 6h 24h
Figure 4a :
Figures 5 a et 5b
Figures 7a et 7b
Figure 8