HAL Id: hal-02423511
https://hal.archives-ouvertes.fr/hal-02423511
Submitted on 24 Dec 2019
HAL is a multi-disciplinary open access archive for the deposit and dissemination of sci-entific research documents, whether they are pub-lished or not. The documents may come from teaching and research institutions in France or abroad, or from public or private research centers.
L’archive ouverte pluridisciplinaire HAL, est destinée au dépôt et à la diffusion de documents scientifiques de niveau recherche, publiés ou non, émanant des établissements d’enseignement et de recherche français ou étrangers, des laboratoires publics ou privés.
StEP green paper on e-waste indicators
Cédric Gossart
To cite this version:
Cédric Gossart. StEP green paper on e-waste indicators. [Research Report] Dépt. Langues et Sciences Humaines (Institut Mines-Télécom Business School (Institut Mines-Télécom)). 2011, pp.28. �hal-02423511�
fgfgfgfgfgdfdvbvfgfgfdfdfdfdfdfg
Cédric Gossart
Telecom Business School
ISSN: 2219-6579 (Online) ISSN: 2219-6560 (In-Print)
15 September 2011
StEP Green Paper on
E-waste Indicators
Solving the E-Waste Problem (StEP) Green Paper
Cédric Gossart Telecom Business School
Disclaimer
StEP Green Paper Series
The StEP Green Paper Series is a publication tool for research findings which meet the core principles of StEP and contribute to its objectives towards solving the e-waste problem. StEP members agreed on this support of the author(s) work, but do not necessarily endorse the conclusions made. Hence, StEP Green Papers are not necessarily reflecting a common StEP standpoint.
The StEP Green Paper series is published complimentary to the StEP White Paper Series for pub-lication of findings generated within StEP which have been endorsed by its members.
United Nations University/StEP Initiative 2011
This work is licensed under the Creative Commons by-nc-nd License. To view a copy of this license, please visit http://creativecommons.org/licenses/by-nc-nd/3.0/
This publication may thus be reproduced in whole or in part and in any form for educational or non-profit purposes without special permission from the copyright holder, provided acknowledgement of the source is made. No use of this publication may be made for resale or for any other commercial purpose whatsoever without prior permission in writing from the StEP Initiative/United Nations Uni-versity.
The StEP Initiative/United Nations University would appreciate receiving a copy of any publication that uses this publication as a source.
StEP Green Paper on e-waste Indicators
Acknowledgements
We take pleasure in thanking those who have actively contributed to the development of this StEP Green Paper:
• Choi, Sunghee (United Nations University) • Crock, Wesley (United Nations University)
• Kern, Matthias (UNEP Secretariat of Basel Convention) • Kuehr, Ruediger (United Nations University)
StEP Green Paper on e-waste Indicators
StEP Green Paper on E-waste Indicators
Cédric Gossart
Telecom Business School 9 rue Charles Fourier 91011 Evry cedex France
Abstract
In this paper we present the results of a project aiming to comparatively evaluate the perfor-mance of e-waste policies in four European countries (Belgium, Netherlands, France and Switzerland). Such a comparative analysis could help identify best policy practices used by governments when trying to solve the e-waste problem. The topic of e-waste is getting more and more attention from researchers and politicians given the range of problems at stake. However, it is an under-investigated field of research in social sciences, especially in public policy analysis. EU Member States offer interesting case studies because the Union is an early mover when it comes to addressing the e-waste problem, notably thanks to the Waste Electric-al and Electronic Equipment (WEEE) Directive. Since the e-waste problem is a transnationElectric-al, partly global one, many other countries seek inspiration from European e-waste policies when trying to solve the e-waste problem.
In order to understand how the policies of countries can be improved and the extent to which they can serve as an example for other countries, these policies need to be evaluated. Further-more, to understand which instruments work best in a given context, a comparative analysis needs to be carried out. To rate the performance of their e-waste policies and report the state of the e-waste problem to the European Commission, Member States have used a wide range of indicators. We introduce in this paper a methodology allowing us to construct the e-waste pro-file of a country capable of reporting all these indicators in a comparable way. We then com-ment the results and underline the limits of the approach. Finally, we suggest an alternative to the use of indicators to identify the factors conducive to best policy practices capable of solv-ing the e-waste problem.
StEP Green Paper on e-waste Indicators
Table of content
1. Introduction ... 7
2. Indicators for environmental policy evaluation ... 8
3. Evaluating e-waste policies ... 9
3.1. The genesis of e-waste policies ... 9
3.2. Using indicators to compare e-waste policies ... 10
4. Methodology ... 15
5. Sustainability through indices ... 16
6. Conclusion ... 19
7. Bibliography ... 20
8. Appendix ... 22
StEP Green Paper on e-waste Indicators
Lists of Tables
Table 1: Overview of selected definitions of WEEE/e-waste ... 7
Table 2: Evaluation results for the comparison criteria... 12
Table 3: Indicator system to measure and compare WEEE management systems ... 12
Table 4: Evaluation of e-waste indicators ... 13
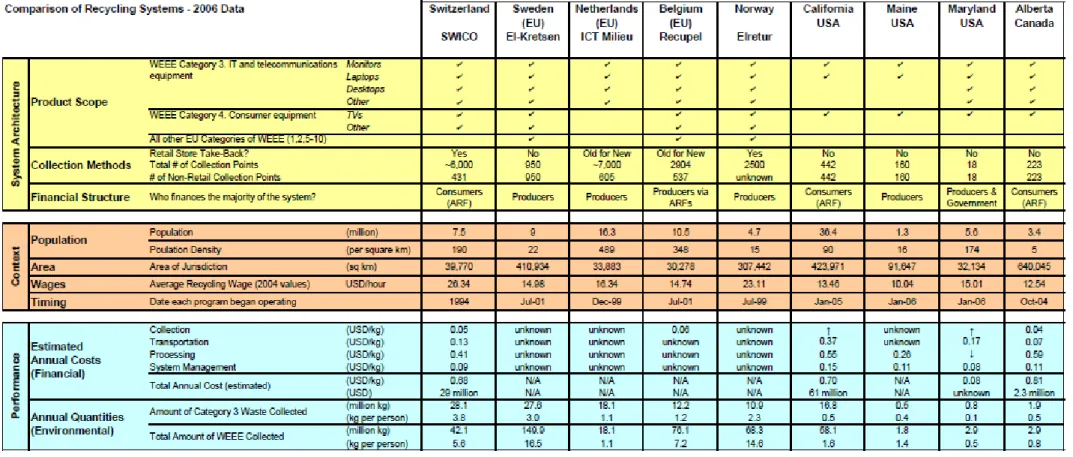
Table 5: Comparing recycling systems... 14
Lists of Figures
Figure 1: Stages of the life cycle of EEE ... 10Figure 2: Physical flows of e-waste in France ... 11
Figure 3: Financial flows in the French e-waste take-back system ... 11
1.Introduction
1.
Introduction
This paper introduces a methodology to comparatively evaluate the performance of e-waste policies. In the EU, e-waste is the fastest growing waste stream, growing at 3-5% per year, which is three times faster than average waste. Outside the EU, an important percentage of this waste is still landfilled, incinerated or recovered without any pre-treatment, which allows dangerous substances such as heavy metals and bro-minated flame retardants to leak into the environment. Some estimates suggest that 40 million tonnes of e-waste is generated each year, including more than 10 million tonnes in the EU27 only. In addition, used
electrical and electronic equipment (EEE) containing hazardous substances are often shipped as reusable EEE to developing countries, where they appear to be nothing else than waste and fail to be treated prop-erly because of the lack of proper infra-structure to do so. This is notably due to the fact that the Basel Convention regulat-ing transboundary shipments of hazardous waste lacks a robust definition of e-waste. To illustrate the variety of definitions of e-waste, the following table provides an overview of the definitions that were circu-lating in the international arena in 2005:
Table 1: Overview of selected definitions of WEEE/e-waste
Reference Definition
EU WEEE Directive (EU, 2002a) “Electrical or electronic equipment which is waste… including all components, sub-assemblies and consumables, which are part of the product at the time of discarding.” Directive 75/442/EEC, Article 1(a) defines “waste” as “any substance or object which the holder disposes of or is required to dispose of pursuant to the provisions of national law in force.”
Basel Action Network (Puckett and Smith, 2002)
“E-waste encompasses a broad and growing range of electronic devic-es ranging from large household devicdevic-es such as refrigerators, air conditioners, cell phone, personal stereos, and consumer electronics to computers which have been discarded by their users.”
OECD (2001) “Any appliance using an electric power supply that has reached its end-of-life.”
SINHA (2004) “An electrically powered appliance that no longer satisfies the current owner for its original purpose.”
StEP (2005) E-waste refers to “… the reverse supply chain which collects products no longer desired by a given consumer and refurbishes for other con-sumers, recyclers, or otherwise processes wastes.”
Source: Widmer, Oswald-Krapf et al. (2005).
This heterogeneity has not come to a halt. In October 2010, an analysis carried out by Compliance & Risks C2P knowledge-management tool and database has re-vealed that worldwide at least 75 different definitions of e-waste existed in the world.
Electronic products vary in hazardous con-tent, high-value concon-tent, and ease of recy-cling. As a result, the scope of products ac-cepted for recycling within current e-waste recycling systems also varies widely. For example, the European Union now requires the recycling of a broad group of electronic
StEP Green Paper on e-waste Indicators
products. The European WEEE Directive defines „EEE‟ (Electrical and Electronic Equipment) as “equipment which is de-pendent on electric currents or electromag-netic fields in order to work properly”. Thus, each EU Member State must handle all types of e-waste, but may choose to separate certain types of e-waste into dif-ferent streams. For example, in the Nether-lands, ICT-Milieu handles the category 3 (IT and Telecommunications Equipment), while its counterpart NVMP is responsible for all other categories of e-waste. In other countries, the scope of e-waste products handled within mandated systems is much smaller. For example, the US state of Maine only collects display devices (TVs, computer monitors, and laptop computers). Finally, the economic, environmental, so-cial and geopolitical consequences of the increasing tension around the trade of rare earths make proper e-waste recycling a must for ICT-driven economies. For exam-ple, Umicore underlines that in 2006 de-mand for metals has grown by a two digits rate for those entering the production chain of TV-LCD (+40%), laptops (+30%), digi-tal cameras (+20%), or mobile phones (+15%).1
It is therefore paramount to design e-waste policies that are efficient and properly en-forced. For this purpose, reliable indicators must be constructed and data collected; then, further improvements can derive from learning from best practices and by comparing different policies. This paper demonstrates how indicators have been used by various countries to do so and un-derlines the limits of a comparative analy-sis solely based on indicators. It suggests an alternative methodology to investigate the factors conducive to best e-waste poli-cy practices. It starts with a review of how indicators are used in environmental policy evaluation, followed by an introduction to
1 Source: Hagelüken and Buchert (2008).
e-waste policy evaluation. Then, it presents a methodology to comparatively evaluate e-waste policies, before drawing lessons for e-waste policy-making and highlighting the limits of using indicators to bring out best e-waste policies in the conclusion.
2.
Indicators for
environmental policy
evaluation
Evaluating environmental policies is key to their improvement and to justify their un-dertaking in the eye of the citizens who pay taxes to finance them and who may support their objectives. As opposed to policy ap-praisal,2 evaluation is an ex post analysis that assesses the success of a policy and what lessons can be learnt for the future. It can be complemented with policy apprais-als, in order to question the legitimacy, ac-countability and normative justification for public action and its embedded and see-mingly neutral instruments (Turnpenny, Radaelli et al. (2009).
As Lehtonen (forthcoming) puts it; “Indi-cators are employed to monitor policy per-formance and foster accountability”. How-ever, indicators are not neutral, as they can for example be used by policy makers to their own advantage. The author argues that they “have been shown or assumed to exert powerful influence on policies and societies at large, not least because they are seen to provide rigorous, quantifiable da-ta”.
Therefore, caution must prevail when using indicators to evaluate public policies. This is all the more important since they have a strong indirect influence on frameworks of
2 Process of examining ex ante the options for
meet-ing policy objectives and weighmeet-ing up their costs, benefits, risks and uncertainties.
3.Evaluating e-waste policies
thought or on how public problems are shaped.
The complex dynamics at stake in the ini-tial phase of a public policy was hig-hlighted by Gusfield (1980) in his analysis of the “Drinking-Driving” public problem. We shall examine this phase in the next section by exploring how the e-waste prob-lem has emerged, and how indicators have been used to construct this public problem.
3.
Evaluating e-waste
policies
3.1. The genesis of e-waste
policies
When the Basel Action Network (BAN), an NGO serving as a watchdog for the Ba-sel Convention, released its fist documen-tary “Exporting Harm: The High-Tech Trashing of Asia” in 2003, the European Community Directive 2002/96/EC on waste electrical and electronic equipment (WEEE) was just coming into force. When BAN released its second documentary in 2005 (“The Digital Dump: Exporting Re-Use and Abuse to Africa”), this Directive which sets collection, recycling and recov-ery targets for almost all EEE was official-ly being implemented (13 August).
But this piece of legislation came a long way. The first draft of the WEEE Directive was issued in early 1998, but was harshly criticized by industries all over the world (US, EU, Japan, Canada, Australia ...) for failing to back material bans and extension of producer responsibilities with sound scientific evidence. Its scope was said to be too broad and industry had not been con-sulted. In July 1998 a second draft circu-lated without further integration of indus-tries‟ concerns; although the electronics in-dustry did not officially oppose the principle behind the directive, it started
or-ganizing a collective counter-attack, espe-cially against the costly matter of material bans. Prepared in a similar fashion, the third draft transpired in July 1999. The subsequent versions and revisions of the directive will keep sparking industry fury, leading Huisman (2006) to call it “An old-fashioned Directive”. Indeed, the author stresses that “large parts of the EU WEEE Directive [were] written in a time (around ‟96) where the thinking was dominated by looking at ways to: „do good for the envi-ronment‟ with the Extended Producer Re-sponsibility (EPR) principle as a starter”, without looking at enforceability. Perhaps a consequence of such an outdated way of crafting European legislation, the WEEE Directive fell short of meeting its key ob-jective to provide incentives to ecodesign EEE for easier dismantling, recycling, and reuse of components (Castell, Clift et al. (2004)).
The Directive required EU Member States to transpose its provisions into national laws by 13 August 2004; only Greece and Cyprus could eventually meet this dead-line.3 In other parts of the world, govern-ments have also taken steps to solve the e-waste problem. In the USA, House repre-sentatives have introduced a bill seeking to ban e-waste exports.4 In China, the gov-ernment has banned the import of e-waste since 2001 and on 5 March 2009, the Chi-nese e-waste legislation was introduced; it came into effect in January 2011.
When looking at how e-waste policies have been constructed in Europe and other parts of the world, one can identify that the following actors can contribute to solve the e-waste problem: 3 See http://www.bis.gov.uk/files/file29925.pdf (29 July 2010). 4 See http://www.electronicstakeback.com /legislation/federal_legislation.htm (29 July 2010).
StEP Green Paper on e-waste Indicators
International non-profit & nongo-vernmental actors :
o UN agencies
o European Commission
National public actors: o Parliaments o Government bodies o Local authorities Private actors: o Firms: Producers Distributors Recyclers Refurbishers Service Providers
Figure 1: Stages of the life cycle of EEE
o Professional organizations o Final users of EEEs
(house-holds, professional users of household EEEs)
o Producer associations (lobbies, industry representatives, ...) o Consumer associations o NGOs
o Labour unions o Media
Third Party Organizations (TPOs)5
These actors can exert their influence at any of the stages demonstrated in Figure 1 of e-waste generation, starting from the de-sign of the equipment to its end-of-life:
Figure 2 depicts the actors involved in the implementation of the French e-waste take-back system (grey boxes concern activities
5 Whatever their legal status might be: NGOs,
pri-vate firms, governmental bodies...
which are subcontracted by a TPO). In this country, TPOs are non-profit organizations formed by companies manufacturing and distributing EEE; municipalities are free to contract with any of them (one being spe-cialized in energy saving light bulbs) so that they can manage their e-waste flows.6 The system is financed by the producers who charge it to the consumer in the form of a “visible fee” (éco-contribution) that is apparent on receipts. Figure 3 shows how this money is collected and how it circu-lates between all the actors of the take-back system.
3.2. Using indicators to
com-pare e-waste policies
Different methods have been used to eva-luate e-waste policies. For example, in or-der to compare take-back systems in Swit-zerland and India, Khetriwal, Kraeuchi et al. (2009) first present an overview of the two systems and then compare them on the basis of four criteria:
E-waste per capita
Employment Potential
Occupational Hazards
Emissions of Toxics
However the selection of these criteria is not robustly justified, since they were cho-sen “because they feature prominently in discussions related to e-waste”. The result of the evaluation in Table 2 gives only an initial qualitative review of the environ-mental and social aspects.
6 About the case of an early moving country like
Switzerland, see Khetriwal, Kraeuchi et al. (2009).
Distribution Production
Error! Use the Home tab to apply Überschrift 1 to the text that you want to appear here.. Error! Use the Home tab to apply Überschrift 1 to the text that you want to appear here.
3.Evaluating e-waste policies
Source: Adapted from the French Environment Agency (ADEME)
Figure 2: Physical flows of e-waste in France
Source: Adapted from the French Environment Agency (ADEME).
StEP Green Paper on e-waste Indicators
Table 2: Evaluation results for the comparison criteria
Criterion Switzerland India
Level Implication Level Implication
E-waste per capita High Negative Low Positive
Employment Potential Low Negative High Positive
Occupational Hazard Low Positive High Negative
Emissions of Toxics Low Positive High Negative
Source: Khetriwal, Kraeuchi et al. (2009).
A more detailed comparative analysis has been provided by Widmer, Oswald-Krapf et al. (2005), who are using the framework
in Table 3 to construct the e-waste profile of a country:
Table 3: Indicator system to measure and compare WEEE management systems
Aspect Criterion Indicator
Structural framework Politics and legislations Ratification of Basel Convention and Ban Amendment Status of a national waste legislation
Status of a national e-waste legislation Corruption perception index
Economy Capital cost (industrial investments) Secondary raw material market Society and culture Civil and political liberties
NGO activities Recycling culture
Environmental awareness in society
Science and technology Knowledge in WEEE recycling technologies
Research in WEEE management / recycling technologies Recycling system Material flow WEEE generation per capita
Closed loop recycling management Technologies Efficiency of material recovery
Quality of recovered material Financial flow Financial coverage
Impacts Environment Final disposal of WEEE in unsafe landfills
Emissions of hazardous substances
Human health Health and safety implementation at workplaces
Exposure of neighbouring population to hazardous substances
Labour Number of jobs generated
Income distribution Source: Widmer, Oswald-Krapf et al. (2005).
Confronted to the difficulty to collect reli-able and comparreli-able data, the authors have
used the scale in Table 4 to evaluate the e-waste profile of different countries:
3.Evaluating e-waste policies
Table 4: Evaluation of e-waste indicators
Comparison indicator Low (value = 0) Medium (value = 3) High (value = 5) Legal regulation No existing level
regula-tion
Existing regulation giving operational flexibility
Existing regulation with no operational flexibility System coverage No WEEE handled by
system
Few, specific WEEE han-dled by system
All WEEE handled by system
System financing No external financing Partly externally financed system
Fully externally financed system
Producer responsibility Producer responsibility non-existent
Selective producer respon-sibility
Strong producer respon-sibility
Rate of return targets No legal collection and/or recycling targets
Few collection and/or re-cycling targets
Preset, legally binding targets for all processes Source: Widmer, Oswald-Krapf et al. (2005).
The outcome is represented on a spider web chart, as exemplified in Figure 4.
Source: Widmer, Oswald-Krapf et al. (2005), colors are ours.
Figure 4: Comparison of WEEE management systems
This approach takes a holistic perspective as it takes into account societal objectives such as job creation or income distribution. In many other studies, only the efficiency of the take-back system is taken into ac-count, which reveals that the political priority is not geared towards broader so-cietal issues but merely focuses on the effi-ciency of e-waste take-back systems.
Con-sequently, academic analyses tend to reflect this focus, not to mention that they are tied to data availability and thus to a restricted scope of comparison of e-waste policies across countries. Table 5 provides a com-parative analysis of take-back systems in different countries following a similar ap-proach.
StEP Green Paper on e-waste Indicators
Table 5: Comparing recycling systems
4.Methodology
This approach suffers from several limits. At first, it is a top-down approach since the criteria upon which the study evaluates the policies are not justified. For example, the study focuses on cost-related indicators, thereby assuming that the priority of take-back system designers is cost minimiza-tion, and that for example environmental or societal objectives are not to be integrated in the assessment. Also, the comparison focuses on take-back systems, not on coun-tries, thereby leaving out important factors contributing to solving the e-waste prob-lem such as cultural or political ones, which have a strong influence on the abili-ty of a country to enforce an e-waste regu-lation. Therefore, if such an approach can provide an informative overview of e-waste policies in different countries, as ex-emplified in StEP (2009), it falls short of providing justifications for the evaluation criteria chosen to compare different coun-tries and considers a scope of EEE limited to the ICT sector (EU Category 3).
In its review of the WEEE Directive, the United Nations University (2008) was as-signed to focus on the environmental im-pacts of the regulation. It also highlighted the heterogeneity in its enforcement, which was already underlined by the review of its implementation carried out by the Institue for Prospective and Technological Studies IPTS based in Sevilla (2006). In defining the effectiveness of a take-back system, respondents to the interviews conducted for the latter study identified the following indicators:
Collection rate (kg/inhabitant),
Percentage of recycling and recov-ery for each family product,
Recycling/recovery costs,
Overall values of reserves within compliance scheme (the lower the better),
Amount of landfill/incineration vo-lumes.
These studies were carried out in the be-ginning of the implementation of the WEEE Directive, and many countries had not yet put in place a robust evaluation sys-tem. The next section introduces an at-tempt to overcome these drawbacks and to reflect upon the limits of the use of indica-tors to evaluate and compare e-waste poli-cies.
4.
Methodology
The methodology presented here has al-lowed us to construct an e-waste profile that could be applied to different countries, which could later on be compared. Such a comparative analysis could help identify best practices used by governments to dvelop effective strategies to address the e-waste issue. A first step has involved the development of a detailed analysis of the indicators used in several European coun-tries (France, Netherlands, Belgium, and France), and a second to construct an e-waste profile that could be applied to a va-riety of countries.
To shed light on the solutions adopted by different countries when designing their best e-waste policies, the indicators used to construct and evaluate them are analyzed and presented in tabled form. Then, based on this set of indicators, the e-waste profile of a country can be established. Indicators were collected in four countries (Switzer-land, Belgium, Netherlands and France), mostly on the basis of reports prepared by take-back systems and other official statis-tics and confidential data. The following categories have allowed us to organize these indicators in order to ease compara-tive analyses of e-waste profiles in a later stage; they also show the variety of indica-tors used by countries which are trying to solve the e-waste problem:
StEP Green Paper on e-waste Indicators
A. The e-waste problem in the country B. Solutions developed to solve the e-waste problem
B1. Formulation of the e-waste policy B2. Instruments used to implement the e-waste policy
B2.1. Legislation B2.2. Take-back system
Organization
o Actors (Private firms, NGOs, Consumer associa-tions, Media, Unions, Third Party Organizations-TPOs) o Economic instruments o Information-based
instru-ments
C. Performance of the solutions put in place
C1. Collection C2. Recycling
C3. Costs & Expenses of the take-back system
C4. Revenues & Reserves of TPOs C5. Treatment & recovery
D. Context D1. General information Total population Surface Population density Urban population D2. Labour market Unemployment
Contribution of the informal sector to the national economy
Jobs created by recycling schemes (highlight social enter-prises)
D3. Health and Safety
Occupational hazards related to the management of WEEE
H&S standards of the popula-tion living near recycling sites
H&S standards of workers di-rectly involved in the manage-ment of e-waste
D4. Inequalities
Digital gap
E-waste leakage D5. Awareness
Concern of citizens for envi-ronmental and inequality issues
The table in the appendix shows a fictional example of how the availability of these indicators could be mapped in various countries. It draws on the indicators used in the Swiss e-waste profile (available from the author upon request) and includes both quantitative and qualitative indicators. A comprehensive collection of this data has not yet been carried out; this table is pro-vided to show the structure of the indica-tors selected and what an overview could look like if all data could be collected. However, given the problems related with data heterogeneity and erratic collection in many parts of the world, such a compre-hensive approach will not allow us to benchmark countries across the world re-garding the performance of the e-waste so-lutions they have put in place. Therefore, we suggest developing a simpler indicator to evaluate the performance of the solu-tions developed in different countries to solve the e-waste problem.
5.
Sustainability through
indices
For subjects broader than e-waste, attempts have been made to construct composite in-dicators, for example to benchmark sus-tainable development achievements. Van de Kerk and Manuel (2008) have con-structed a sustainable society index (SSI), which “integrates the most important as-pects of sustainability and quality of life of a national society in a simple and transpar-ent way” (it consists of 22 indicators grouped into 5 categories and has been de-veloped for 150 countries).
5.Sustainability through indices
In a paper entitled “Measuring the im-measurable -- A survey of sustainability in-dices”, Böhringer and Jochem (2007) re-view the explanatory power of various sustainability indices applied in policy practice, and conclude that “these indices fail to fulfil fundamental scientific re-quirements making them rather useless if not misleading with respect to policy ad-vice”. They find that normalization and weighting of indicators are often associ-ated with subjective judgments, but that scientific rules exist to guarantee consis-tency and meaningfulness of composite in-dices. In a paper entitled “Sustainability of nations by indices”, Siche, Agostinho et al. (2008) suggest ways to overcome these dif-ficulties for the Environmental Sustainabil-ity Index for example, which “would be more useful if it disaggregated into its in-dividual components, allowing the user to decide on appropriate weights”.
Provided that these obstacles are over-come, a composite index measuring the performance of e-waste solutions could be developed. It should also not repeat the limit of the aforementioned evaluations of take-back systems which are mostly top-down analyses. We suggest developing a “post-normal” index evaluating the per-formance of the solutions adopted by coun-tries to solve the e-waste problem.7 Indeed, not only does this research seek to concep-tualize such an index, it also examines the extent to which it can be applicable in practice. Even in Europe the performance of countries‟ e-waste solutions is very het-erogeneous, and improvements in the per-formance of these solutions are limited by a lack of good quality data. Having a visi-ble albeit composite indicator evaluating the performance of the solutions adopted in
7 For a presentation of this index, see
http://etos.it-
sudpa-ris.eu/membres/CedricGossart/Recherche/Gossart_ Huissman.ppt (29 July 2010).
a given country to solve the e-waste prob-lem could help engage citizens and policy-makers in this major challenge. It would create incentives for countries to catch up with others and to collect and diffuse better quality data. It could also increase trans-parency and foster the development of more reflexive policies that challenge ex-isting policy frameworks, goals and under-lying norms, since better informed stake-holders would be empowered to question the very premises of policies.
Besides, in spite of the production of com-prehensive studies comparing e-waste poli-cies, in the EU for example there are still huge discrepancies concerning the per-formances of the solutions developed in Member States to address the issues sur-rounding e-waste. Such studies might benefit from the existence of a more visible and pedagogical index, even if it is not as comprehensive as them.8 An index can be defined as a number derived from a series of observations, and used as an indicator or measure to indicate a specific characteristic or property. Examples of such indices in-clude:
- The Human Development Index (HDI),
- IFC and Standard & Poor‟s carbon efficient index for emerging mar-kets,9
- U.S. Standard & Poor‟s Carbon Ef-ficient Index,10
8 The limits of evaluation studies are regularly
un-derlined by evaluation experts, including the ones working on sustainable development issues. See the last Easy-Eco conference that took place in Brussels in November 2010,
http://www.sustainability.eu/easy/?k=conferences&s =brussels (29 July 2010).
9 Aims to encourage carbon-based competition
among emerging-market companies. See
http://www.ifc.org/ifcext/sustainability.nsf/Content/ Publications_SustainableInvesting_Brochures (29 July 2010).
StEP Green Paper on e-waste Indicators
- Dow Jones Sustainability Indexes,11 - Ethibel Sustainability Index,12 - Sustainable Society Index,13 - Ecological Footprint (EF),14
- Environmental Sustainability Index (ESI).15
As far as e-waste issues are concerned, ini-tiatives seeking to create simple and visible performance measures have also been taken, such as the “Guide to greener elec-tronics”16
or the “Solar Company Score-card”17
(Silicon Valley Toxics Coalition). Based on preliminary studies carried out by Huisman18 and others a composite e-waste solutions index (ESI) could be constructed, by consulting key stakeholders concerned with and involved in providing e-waste so-lutions. It would express in a single num-ber for a given country the percentage of objectives achieved by this country to solve the e-waste problem (collection rate of e-waste, recycling rate, treatment speci-fications, etc.). It would allow us to benchmark the performance of various
10 http://www.standardandpoors.com/indices/sp-ifci- carbon-efficient/en/us/?indexId=sp-ifci-carbon-efficient (29 July 2010). 11http://www.sustainability-index.com (29 July 2010). 12http://www.ethibel.org/subs_e/4_index/main.html (29 July 2010).
13 See Van de Kerk and Manuel (2008).
14 For a definition and comparison between the EFI
and the ESI, see Siche, Agostinho et al. (2008).
15 Composite index published from 1999 to 2005,
http://sedac.ciesin.columbia.edu/es/esi (29 July 2010).
16 See http://www.greenpeace.org/international/
campaigns/toxics/electronics/how-the-companies-line-up (29 July 2010).
17 See http://www.solarscorecard.com (29 July
2010).
18 See
http://www.step-initiative.org/projects/project.php?id=180 (29 July 2010).
countries and should support their efforts in solving the e-waste problem.
To do so, a composite index summarizing the performance of e-waste solutions in a given country requires that all stakeholders need to be consulted. Although it will not capture all issues at stake, it should provide a reliable picture of the performance of e-waste solutions in a variety of countries. In addition, the proposed framework should accommodate cases in both developed and developing countries.
Böhringer and Jochem (2007) have under-lined the limits of sustainability indices such as the HDI or the EF that provide a one-dimensional metric to valuate country-specific information. We argue with Hezri and Dovers (2006) that by taking a “post-normal turn”,19
namely provided that they are developed with users, indicator systems can overcome part of these problems and co-optimize both scientific and symbolic objectives. Indeed:
“With a post-normal orientation, indicators are mobilized not only toward instrumental and conceptual utilization, but encompass tactical, symbolic and political utilization. In all cases, the marketability of indicators is a critical consideration to ensure they will pass the cognitive screening of poten-tial users, linking the informational content to the chain of action in strategic advo-cacy.”
Particular attention should be paid to the limits of such indicators, since “policy de-cisions can be ineffective or even counter-productive if they do not consider factors which influence index behaviour”, such as the scale of available data and the weight-ing of indicator data (Mayer (2008).
6.Conclusion
6.
Conclusion
The United Nations University (2008) study has underlined the discrepancy in the implementation of the European WEEE Directive, notably because the text was not specific enough regarding enforcement procedures, hoping that such flexibility would make implementation easier. This heterogeneity makes it difficult to compare e-waste policies in EU countries, since EU Member States may have chosen different paths to implement the same directive, re-sulting in the selection of different indica-tors to evaluate it. Indeed, data collected from official and confidential sources proved not to be consistent and reliable enough to carry out comparative analyses, even in the case of Switzerland and the Netherlands, two “early moving” countries. Moreover, using indicators to evaluate e-waste policies raises difficulties related to the construction of indicators themselves, since they are not neutral and can allow governments to indirectly legitimize a cer-tain policy orientation for which no con-sensus could be achieved. Provided that good quality data is available, using indica-tors to compare e-waste policies could help bring out best policy practices; on the other hand, it also raises methodological prob-lems, since indicators may not be compa-rable if used in different contexts.
This advocates in favor of a model-based approach to complement erratic data quali-ty20and of a simplified set of indicators to
roughly benchmark countries against one another: the E-waste Solutions Index (ESI),
20 This approach is being pursued by a group of
StEP related researchers with the “StEP ADDRESS project”, aiming to build an online database of e-waste flows as well as an aggregated E-e-waste Solu-tion Index (ESI) for any country in the world that will enable them to monitor progress and to com-pare themselves with others.
in a similar fashion to the aforementioned spider web developed by Widmer, Oswald-
Krapf et al. (2005). As evidenced by the European 7th Framework Programme (FP7) POINT project, spending a lot of time de-veloping sets of indicators does not mean that they will be used in the policymaking process.21 Therefore, it might be worth-while developing a simple set of indicators that does have an impact on the policy process, especially when it comes to such an urgent issue as e-waste.
StEP Green Paper on e-waste Indicators
7.
Bibliography
Böhringer, C. and P. E. P. Jochem (2007), "Measuring the immeasurable - A survey of sustainability indices", Ecological Economics 63(1): 1-8.
Castell, A., R. Clift, et al. (2004), "Extended Producer Responsibility Policy in the European Union: A Horse or a Camel?", Journal of Industrial Ecology 8(1-2): 4-7.
Fredholm, S. A., J. R. Gregory, et al. (2008), "Characterizing architectural options for electronic waste recycling systems", IEEE International Symposium on Electronics and the Environment.
Funtowicz, S. O. and J. R. Ravetz (1994), "The worth of a songbird: ecological economics as a post-normal science", Ecological Economics 10(3): 197-207.
Gusfield, J. R. (1980), The Culture of Public Problems: Drinking-Driving and the Symbolic
Order, Chicago: The University of Chicago Press.
Hezri, A. A. and S. R. Dovers (2006), "Sustainability indicators, policy and governance: Issues for ecological economics", Ecological Economics 60(1): 86-99.
Huisman, J. (2006), "Where did WEEE go wrong in Europe? Practical and academic lessons for the US", IEEE International Symposium on Electronics and the Environment.
IPTS (2006), "Implementation of the Waste Electric and Electronic Equipment Directive in the EU", Technical Report Series. Office for Official Publications of the European Communities, Luxembourg: Directorate-General Joint Research Centre.
Khetriwal, D. S., P. Kraeuchi, et al. (2009), "Producer responsibility for e-waste management: Key issues for consideration - Learning from the Swiss experience", Journal of Environmental Management 90(1): 153-165.
Lehtonen, M. (forthcoming), "Indicators as an appraisal technology: Framework for analysing the policy influence of the UK Energy Sector Indicators", in Sustainable development,
evaluation and policy making, A. von Raggamby et al., London: Edward Elgar.
Mayer, A. L. (2008), "Strengths and weaknesses of common sustainability indices for multidimensional systems", Environment International 34(2): 277-291.
Siche, J. R., F. Agostinho, et al. (2008), "Sustainability of nations by indices: Comparative study between environmental sustainability index, ecological footprint and the emergy performance indices", Ecological Economics 66(4): 628-637.
StEP (2009), "E-waste Take-back System Design and Policy Approaches", StEP White Paper (1).
7.Bibliography
Turnpenny, J., C. M. Radaelli, et al. (2009), "The Policy and Politics of Policy Appraisal: Emerging Trends and New Directions", Journal of European Public Policy 16(4): 640 - 653. United Nations University (2008), "Review of Directive 2002/96 on Waste Electrical and Electronic Equipment". UNU, Bonn: United Nations University.
Van de Kerk, G. and A. R. Manuel (2008), "A comprehensive index for a sustainable society: The SSI -- the Sustainable Society Index", Ecological Economics 66(2-3): 228-242.
Widmer, R., H. Oswald-Krapf, et al. (2005), "Global perspectives on e-waste", Environmental Impact Assessment Review 25(5): 436-458.
StEP Green Paper on e-waste Indicators
StEP Green Paper on e-waste Indicators
Members and Associate Members of the StEP Initiative are:
International Organizations:
Basel Convention Coordinating Centre for Asia & the Pacific (BCRC China), Basel Convention Coordinating Centre for the African Region (BCCC Africa), Center for Environment and Development for the Arab Region and Europe (CEDARE), Secretariat of the Basel Convention (SBC), United Nations Conference on Trade and Development (UNCTAD), United Nations Environment Programme (UNEP), United Nations Industrial Devel-opment Organization (UNIDO), United Nations University (UNU).
Governmental and Development Cooperation:
Deutsche Gesellschaft für International Zusammenarbeit (GIZ), ENDA-Europe*, Morocco Cleaner Production Center, Renewable Recyclers, Swiss State Secretariat of Economics (SECO), TechSoup Global, US Environ-mental Protection Agency (US-EPA).
Business & Industry:
AER Worldwide, Cisco Systems Ltd., Compliance and Risks, Dataserv Group, Datec Technologies Ltd, Dell, Ericsson, Flection, Global e-Sustainability Initiative (GeSI), GOAB mbH, Hewlett Packard, MicroPro, National Center for Electronics Recycling (NCER), Nokia Corporation, Philips Consumer Lifestyle, PT PLUS KG, Sims Recycling Solutions, Taizhou Chiho Tiande, UMICORE Precious Metal Refining, Vertmonde cia.Ltda*, WEEE Forum*.
Academia & Research:
Austrian Society for Systems Engineering and Automation (SAT), BIO Intelligence Service, Chinese Academy of Sciences (CAS), Delft University of Technology, GAIKER Foundation, Griffith University, Institute for Ap-plied Ecology (Öko-Institut), Swiss Federal Laboratories for Materials Testing and Research (EMPA), Fraunho-fer Institute for Reliability and Microintegration (FHG-IZM), KERP research, Korean Institute of Geoscience and Mineral Resources (KIGAM), Massachusetts Institute of Technology (MIT), Rifer Environmental, Sustain-able Electronic Initiative at the University of Illinois (SEI), Technische Universitaet Braunschweig, Telecom Business School, Thai Electrical and Electronic Institute (EEI), University of Limerick, 3P Institute for Sustaina-ble Management, The Sustainability Consortium.
StEP Green Paper on e-waste indicators
StEP White and Green Paper Series
All StEP publications are online available at http://www.step-initiative.org/publications/.
Number StEP Task Force Title Date
Green Paper #1 TF “Policy” E-waste Indicators 15 September 2011
Number StEP Task Force Title Date
White Paper #3 TF 1 “Policy” On the Revision of EU‟s WEEE
Di-rective - COM(2008)810 final
1 October 2009, revised 22 March 2010
White Paper #2 TF 3 “ReUse” One Global Understanding of
Re-use – Common Definitions
5 March 2009
White Paper #1 TF 1 “Policy” E-waste Take-back System Design
and Policy Approaches
About the StEP Initiative:
“StEP envisions a future in which societies have reduced to a sustainable level the e-waste-related burden on the ecosystem that results from the design, production, use and disposal of electrical and electronic equipment. These societies make prudent use of lifetime extension strategies in which products and components – and the resources contained in them – become raw materials for new products.”
Our name is our programme: solving the e-waste problem is the focus of our attention. Our declared aim is to plan, initiate and facilitate the sustainable reduction and handling of e-waste at political, social, economic and ecological levels.
Our prime objectives are:
Optimizing the life cycle of electric and electronic equipment by o improving supply chains
o closing material loops o reducing contamination
Increasing utilization of resources and re-use of equipment
Exercising concern about disparities such as the digital divide between industrializing and industrialized countries
Increasing public, scientific and business knowledge
Developing clear policy recommendations
As a science-based initiative founded by various UN organizations we create and foster partnerships between companies, governmental and non-governmental organizations and academic institutions.
StEP is open to companies, governmental organizations, academic institutions, NGOs and NPOs and in-ternational organizations which commit to proactive and constructive participation in the work of StEP by signing StEP’s Memorandum of Understanding (MoU). StEP members are expected to contribute moneta-rily and in kind to the existence and development of the Initiative.
StEP’s core principles:
1. StEP’s work is founded on scientific assessments and incorporates a comprehensive view of the social, envi-ronmental and economic aspects of e-waste.
2. StEP conducts research on the entire life cycle of electronic and electrical equipment and their correspond-ing global supply, process and material flows.
3. StEP’s research and pilot projects are meant to contribute to the solution of e-waste problems.
4. StEP condemns all illegal activities related to e-waste including illegal shipments and re-use/ recycling prac-tices that are harmful to the environment and human health.
5. StEP seeks to foster safe and eco/energy-efficient re-use and recycling practices around the globe in a so-cially responsible manner.
Contact:
StEP Initiativec/o United Nations University
Institute for Sustainability and Peace (UNU-ISP) Operating Unit SCYCLE
Hermann-Ehlers-Str. 10 53113 Bonn, Germany Phone: +49-228-815-0213/4 Fax: +49-228-815-0299 [email protected] www.step-initiative.org www.isp.unu.edu