HAL Id: hal-00329220
https://hal.archives-ouvertes.fr/hal-00329220
Submitted on 1 Jan 2001
HAL is a multi-disciplinary open access
archive for the deposit and dissemination of
sci-entific research documents, whether they are
pub-lished or not. The documents may come from
teaching and research institutions in France or
abroad, or from public or private research centers.
L’archive ouverte pluridisciplinaire HAL, est
destinée au dépôt et à la diffusion de documents
scientifiques de niveau recherche, publiés ou non,
émanant des établissements d’enseignement et de
recherche français ou étrangers, des laboratoires
publics ou privés.
F. Pitout, J.-M. Bosqued, D. Alcaydé, W. F. Denig, H. Rème
To cite this version:
F. Pitout, J.-M. Bosqued, D. Alcaydé, W. F. Denig, H. Rème. Observations of the cusp region under
northward IMF. Annales Geophysicae, European Geosciences Union, 2001, 19 (10/12), pp.1641-1653.
�hal-00329220�
Annales
Geophysicae
Observations of the cusp region under northward IMF
F. Pitout1,2, J.-M. Bosqued2, D. Alcayd´e2, W. F. Denig3, and H. R`eme2 1Swedish Institute of Space Physics, Box 537, 751 21 Uppsala, Sweden
2Centre d’Etude Spatiale des Rayonnements, 9 avenue du Colonel Roche, F-31028 Toulouse Cedex 4, France 3Air Force Research Laboratory, Space Vehicles Directorate, Hanscom AFB, Massachusetts, USA
Received: 17 April 2001 – Revised: 18 June 2001 – Accepted: 22 June 2001
Abstract. We present a comparative study of the cusp region
using the EISCAT Svalbard Radars (ESR) and the Cluster spacecraft. We focus in this paper on 2 February 2001, over the time period from 07:30 UT to 12:00 UT when the oblique ESR antenna pointing northward at a low elevation recorded latitudinal motions of the cusp region in response to the IMF. Meanwhile, the Cluster satellites were flying over the EIS-CAT Svalbard Radar field-of-view around local magnetic noon. The spacecraft first flew near ESR, north-east of Sval-bard and then passed over the field-of-view of the antenna at about 11:30 UT. From 08:00 UT to 09:00 UT, the IMF re-mains primarily southward yet several variations in the Z-component are seen to move the cusp. Around 09:00 UT, an abrupt northward turning of the IMF moves the cusp region to higher latitudes. As a result, the Cluster satellites ended up in the northernmost boundary of the high-altitude cusp region where the CIS instrument recorded highly structured plasma due to ion injections in the lobe of the magnetosphere. Af-ter 09:00 UT, the IMF remains northward for more than two hours. Over this period, the ESR records sunward plasma flow in the cusp region due to lobe reconnection, while Clus-ter spacecraft remain in the high-altitude cusp.
Key words. Magnetospheric physics (magnetopause, cusp,
and boundary layers; plasma convection) Ionosphere (polar ionosphere)
1 Introduction
The cusp region is usually defined as the regions of the mag-netosphere in which magnetosheath plasma has direct entry in the ionosphere (Russell, 2000b). The cusp dynamics and the transient phenomena that occur in the high-latitude day-side ionosphere under southward IMF have been widely re-ported. The northward IMF case, however, was less talked about in the literature until very recently. In particular, multi-instrument studies involving ground-based facilities are still
Correspondence to: F. Pitout ([email protected])
rare (e.g. Maynard et al., 2000; Pryse et al., 2000; Sandholt et al., 1999a). This paper claims to contribute to this “new” aspect of cusp studies.
It is well accepted that when the IMF points southward, dayside reconnection takes place at the sub-solar magneto-pause. The large energy flux coming into the ionosphere, as well as the magnetic erosion causes the cusp to be located relatively low in latitude. Its location, studied statistically by Newell et al. (1989) is then about at 75◦magnetic lati-tude, but depends strongly on the magnitude of the IMF BZ.
The ionospheric convection is then driven by sub-solar re-connection to form the typical and well-known two-cell con-vection pattern. The plasma flow within the cusp is, in this case, anti-sunward. Transient phenomena due to bursty or pulsed reconnection occur in the southward IMF cusp. They may lead to poleward moving features whose manifesta-tion is the Poleward Moving Auroral Forms (PMAFs) which are recorded by optical instruments (Sandholt et al., 1998b), poleward convection enhancements observed by HF radars (Thorolfsson et al., 2000), or transient features seen in IS radar data (Lockwood et al., 2000, Lockwood et al., 2001).
On the other hand, under northward IMF conditions, the situation completely changes. The IMF and the Earth’s magnetic field are no longer anti-parallel at the sub-solar magnetopause and, therefore, reconnection can hardly take place. Therefore, for steady northward IMF conditions, the description summarized above no longer applies. The anti-parallelism condition between the IMF and the Earth’s magnetic field may be fulfilled in the magnetospheric lobes (Chandler et al., 1999). The energy input in the polar cap is thus significantly weaker and as a result, the polar cap is con-tracted. Consequently, the cusp finds itself at higher latitudes (Newell et al., 1989).
SuperDARN observations of the ionospheric flow under northward IMF conditions show a more complex convection pattern (Huang et al., 2000). Reverse convection cells form within the polar cap due to the overdraping of reconnected field lines in the lobes (Crooker, 1992). The plasma flow within the cusp region is then sunward (Milan et al., 2000).
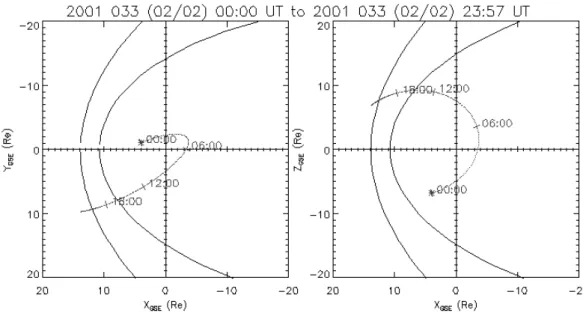
Fig. 1. Cluster orbit in GSE coordinates in the (X, Y ) and (X, Z) planes. The star shows the location of the satellites at 00:00 UT.
This multiple cell pattern supports the idea of magnetic re-connection in the high-latitude magnetosphere, where the magnetic field of the Earth may be anti-parallel with that of the interplanetary medium. Crooker and Rich (1993) reported that lobe reconnection is really a summer phe-nomenon due to obvious geometry considerations. On the other hand, Lockwood and Moen (1999) suggested that even if reconnection takes place in one hemisphere, the over-draped open field lines might reconnect in the opposite sphere and, therefore, drive convection in the winter hemi-sphere.
In addition, recent observations of the northward IMF cusp suggest that the reconnection process at high-latitudes (lobe reconnection) has the same sporadic and pulsating na-ture as that at the sub-solar magnetopause under southward IMF (Even et al., 1998; Sandholt et al., 1998a). Those ob-servations show southward moving features in the dayside high-latitude ionosphere similar to southward moving auro-ral forms.
Satellite observations at high altitudes have shown that the cusp is wider and is located at higher latitudes under north-ward IMF conditions (Russell et al., 1998) and its location at high and low altitudes is less IMF dependent (Fuselier et al., 2000b; Newell et al., 1989).
Simulation efforts have contributed to clarifying the so-lar wind-magnetosphere coupling processes, which comes into play while the IMF is northward. The model by Song et al. (1999) confirms that the magnetosphere is relatively closed for northward IMF. The reconnection sites are then confined to small regions near the cusp. In the ionosphere, the lobe cells and, therefore, the sunward plasma flow in the cusp region are well reproduced (Song at al., 2000).
There are several counterparts to this “idealistic” descrip-tion. First, reconnection can take place at the dayside
magne-topause with IMF BZweakly positive but with a strong IMF
BY (Fuselier et al., 2000a). Second, McCrea et al. (2000)
have shown that dayside reconnection can take place for a little while after a northward turning of the IMF. In addi-tion, Russell et al. (2000a) have presented an alternative view of the reconnection process when the IMF points northward. Under certain conditions, solar wind plasma could possibly penetrate the magnetopause at a low latitude.
The transition period between a northward/southward turning of the IMF is also an interesting point. In this pa-per, we will also focus on this aspect. As already mentioned, McCrea et al. (2000) have shown what may happen when the IMF abruptly goes from a strong negative to a strong positive value. A more global study shows a delay of several minutes before the magnetosphere and the ionosphere fully react to a northward turning of the IMF before reorganize themselves (Taylor et al., 1998).
2 Instrumentation
In this section, we do not intend to list and detail every single instrument, but rather intend to emphasize the new ones, such as Cluster spacecraft or update the existing instruments that have been improved, such as the ESR radar or the DMSP fleet.
2.1 ESR incoherent scatter radar
The ESR radars belong to the European Incoherent Scat-ter Scientific Association. They are located near Longyear-byen (geographic coordinates 78.20◦N and 15.82◦E) on the Spitzberg Island. The ESR system is not, strictly speak-ing, new but a second dish was recently added to the exist-ing steerable 32-meter dish. The new 42-meter dish is fixed
and points field-aligned. This improvement makes the ESR system a very valuable instrument for cusp studies. In con-junction with the Cluster spacecraft, the ESR was operated on 2 February 2001 from 07:30 to 15:00 UT in the so-called Cluster-mode, where the two dishes are used simultaneously, with the steerable dish fixed at a 30◦elevation and pointing towards the magnetic north (azimuth −24◦). With a typical range of measurement between 90 and 800 km, this elevation corresponds in terms of Geographic Latitudes (GL) to 79◦, up to 86◦. The ESR system was running the tau0 modulation scheme, which utilizes two alternating coded signals. 2.2 Cluster
From mid February to mid March, Cluster had ideal orbits for cusp studies. Indeed, its orbit plane consists of, more or less, the Earth spin-axis and the Sun-Earth axis. There-fore, it flew in the midnight-noon meridian plane and conse-quently crossed the polar cusps several times. During several hours on 2 February 2001, Cluster was operated in the so-called “burst mode” where the data is dumped with a high-resolution rate.
The orbit of the satellites is shown Fig. 1 in the GSE frame of reference. Reaching the apogee in the dayside, the veloc-ity decreases progressively so that the Earth rotation speed plays an important role in the footprint of the spacecraft. The projection of the orbit to the ionosphere (Fig. 2) was made using the Tsyganenko 89 model with the actual Kp value for this period (Kp = 1). At the beginning of the ESR run (07:30 UT), Cluster, at that point in the polar cap near the geographic North Pole, was approaching Svalbard. The footprint of the satellite crossed the ESR beam at about 11:30 UT.
We use in this study the Composition Ion Spectrome-ter (CIS) instrument, which is fully described by R`eme et al. (2001).
2.3 DMSP fleet
The Defense Meteorological Satellite Program (DMSP) con-sists of a constellation of operational spacecraft in 98.7◦ sun-snychronous orbits and at an altitude of about 840 km. In this study, data from the DMSP F13 satellite was par-ticularly relevant as a monitor of the dayside high-latitude ionosphere. The DMSP F13 includes a comprehensive set of space environmental sensors. The environmental sensors used in the present study are the auroral particle spectrome-ter and the cold plasma driftmespectrome-ter. The auroral spectromespectrome-ter is an upward looking cylindrical electrostatic analyzer that measures differential energy flux from precipitating electrons and ions within the energy range of 30 eV to 30 keV (Hardy et al., 1984). Data from the plasma driftmeter in this study is used to determine the horizontal cross-track motion of the background ionosphere from which the convective drift com-ponent of the high-latitude ionosphere can be determined (Rich, 1994). The nominal data rate used in the data presen-tation is 1 Hz, i.e. full particle spectra and a measure of the
Fig. 2. Map over the Svalbard region showing satellites’ orbits
pro-jected along the Earth’s magnetic field lines and the field-of-view of the ESR (thick black line). Cluster footprint is in purple and the 3 successive F13 passes in thin black lines labeled in green, blue and red, respectively.
horizontal cross-track drift once per second, for a minimum spatial resolution of about 7.6 km. During the late morn-ing hours on 2 February 2001, the F13 satellite sequentially passed Svalbard and within the ESR field of view at or about 07:52 UT, 09:33 UT, and 11:13 UT. Interestingly enough, this last pass also occurred in close conjunction with the mapped location of the Cluster spacecraft and occurred only several minutes prior to the optimum conjunction of Cluster and the ESR.
3 Observations
3.1 ACE spacecraft
We have used the ACE spacecraft for monitoring the up-stream solar wind conditions. It orbits around the L1 La-grange point and on 2 February 2001, it was located 240 RE
away from the Earth on 2 February 2001.
Throughout the period of interest, the solar wind dy-namic pressure is a rather constant low value of about 1 nPa (sub-solar magnetopause expected to be at ∼ 11 RE).
Consequently, the solar wind dynamic pressure is not expected to play a dominant role in terms of solar wind/magnetosphere interaction. The IMF in our study is more relevant.
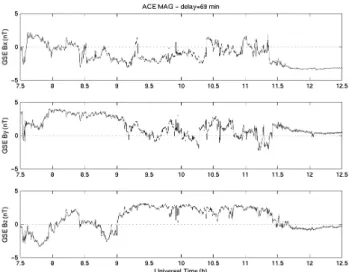
First, we must find an estimate of the expected propagation time between ACE and the ground. The average solar wind speed measured by ACE is 420 km/s. It then takes 60 min for the solar wind to reach the magnetopause without
con-Fig. 3. IMF in GSE coordinates measured by ACE. Data lagged by
69 min.
sidering the magnetosheath. We must consider 7 extra min for the crossing of the magnetosheath and about 2 min for the propagation in the magnetosphere down to the ground (at Alfv´en speed). Eventually, the expected time delay between the spacecraft and the ground is about 69 min.
Figure 4 shows the IMF in GSE cartesian coordinates mea-sured at ACE with a resolution of 16 s. A time lag of 69 min has been applied to these data. We can divide the whole event into three time intervals. From 07:30 (beginning of ESR run) to about 09:00 UT, the IMF varies with BZ either negative
or positive. This interval is interesting when studying the cusp dynamics. After 09:00 UT, a period of positive IMF BZ
begins until 11:30 UT. Over this period, BZ is nearly
con-stant at about +3 nT and BX is negative at around −3 nT.
This configuration should favor reconnection at the northern lobe of the magnetosphere, but with the values of the X- and
Z-components of the IMF being weak, one may have to take into account the Y -component as well. The latter is relatively variable over this second interval with both negative and pos-itive values. Finally, the third interval begins at 11:20 UT when the IMF turns southward again. Throughout this last period, the IMF is dominated by its X-component:
BX∼ −3.5 nT ,
BX∼ +1 nT ,
BZ= −1 nT .
Even though the Z-component is weakly negative, this con-figuration fulfills, in principle, the condition for having reconnection at the southern hemisphere dayside magne-topause. We have eventually three intervals of very differ-ent conditions, which are expected to lead to very differdiffer-ent behavior and dynamics of the cusp region.
3.2 EISCAT Svalbard Radars
The ESR dish pointing field-aligned (not shown) indicates that there is very little activity. This is confirmed by the
IM-AGE magnetometers in Longyearbyen and Ny ˚Alesund (not shown). They record no significant activity over the whole period of interest. This suggests that the activity and, there-fore, the cusp region, lies north of the ESR. This is the reason why we will concentrate our efforts on the steerable antenna pointing northward.
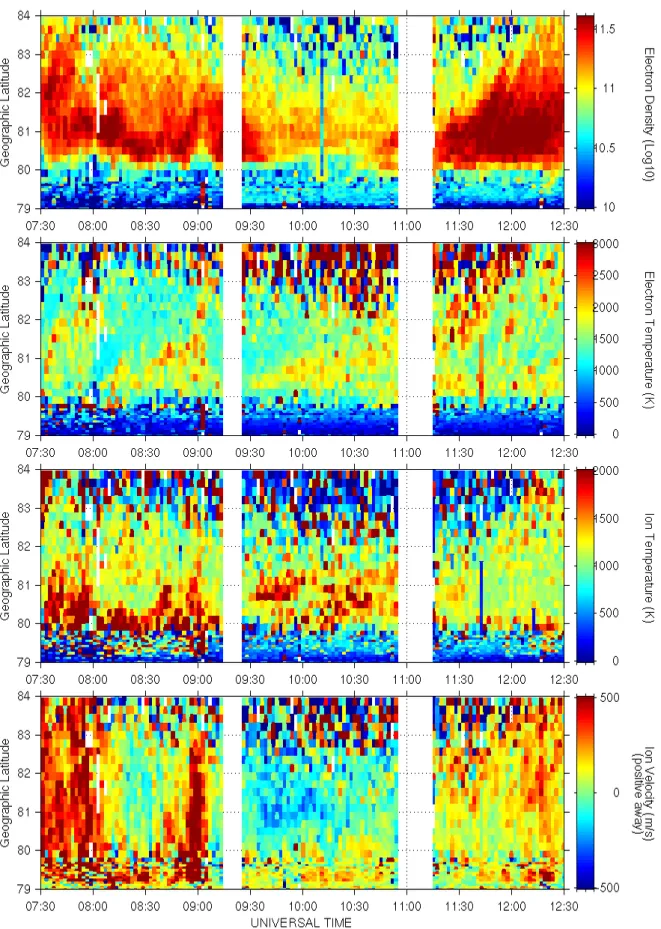
Figure 4 shows an overview of the ESR data from 07:30 through to 12:30 UT. The data are displayed in the usual way: electron density and temperature, ion temperature and line-of-sight velocity from top to bottom. The two blank intervals are due to unfortunate data gaps.
From 07:30 to 08:15 UT and from 08:45 to 09:00 UT, the ionospheric plasma flow is poleward, with velocities around 500 km/s. These intervals correspond to southward IMF conditions (ACE plot). On the other hand, between 08:15 and 08:45 UT, and after 09:00 UT, the flow is weak but still clearly sunward.
The transition period corresponding to the northward turn-ing of the IMF is clearly seen on ESR data. Between 08:45 and 09:02, the flow is clearly poleward due to a southward IMF. A poleward moving structure is visible both in electron density and temperature, which is most likely the signature of a open flux tube that is reconnected in the sub-solar mag-netopause and has been dragged anti-sunward.
Between 09:00 and 09:04, a transition period occurs. This is consistent with the northward turning of the IMF recorded by ACE at 07:51 UT, indicating a lag by the calculated 69 min. Our estimate of the time lag between ACE and the ground appears to be good. The electron density plot shows that the poleward convection of the plasma is stopped. At 09:04, the plasma even starts to drift southward. Within 4 min, the convection reorganizes itself and the motion of the plasma is reversed. Curiously, from 09:02 UT, the velocity of the ionospheric plasma starts to drop, but finally becomes predominantly negative only at 09:08 UT.
Over the next two hours, the IMF remains steadily north-ward (Fig. 3). The electron density observed by the ESR is low (about 1011m−3). Only a faint band of slightly denser electron population remains around 81◦GL. The electron temperature is higher within this region as well. It reaches about 2000 K, whereas it is only about 1000 K elsewhere. This suggests that electron precipitation occurs. On the other hand, the ion also shows higher temperature and a southward velocity in the same region. This region of high electron and ion temperature corresponds to the southern edge of the sun-ward flow region, where precipitation of particles of mag-netosheath origin is expected to occur when the IMF points northward (Sandholt et al., 2000). This region of weak pre-cipitation moves slightly poleward as the lobe cell shrinks while the IMF points less and less northward. This ten-dency is also clearly seen in the velocity panel, which is the boundary between the negative and positive values (adiaroic boundary (Pryse et al., 2000)) of the horizontal plasma veloc-ity goes globally up in latitude.
From about 11:30 UT, when the IMF recorded by the ACE turns southward, the ESR starts recording higher electron density and temperature, as well as positive LOS velocity
Fig. 4. Plasma parameters measured by the northward pointing ESR dish on 2 February 2001. From top to bottom: Ne, electron density, Te,
Fig. 5. Cluster CIS overview from spacecraft 3. The upper panel shows ion density for protons (black) and he-lium 2+ (blue). The three components of proton convection velocity are dis-played in the middle panel. The lower panel shows an ion spectrogram. All parameters of the three panels are plot-ted versus universal time, XGSE, YGSE, ZGSEand radial distance to the Earth.
(poleward flow), first around 81◦GL and the change moves progressively northward. It is very interesting to note that the change is very gradual. The electron density ends up being high at 84◦GL only around 12:00 UT, although the plasma flow has been northward for more than half an hour. 3.3 Cluster spacecraft
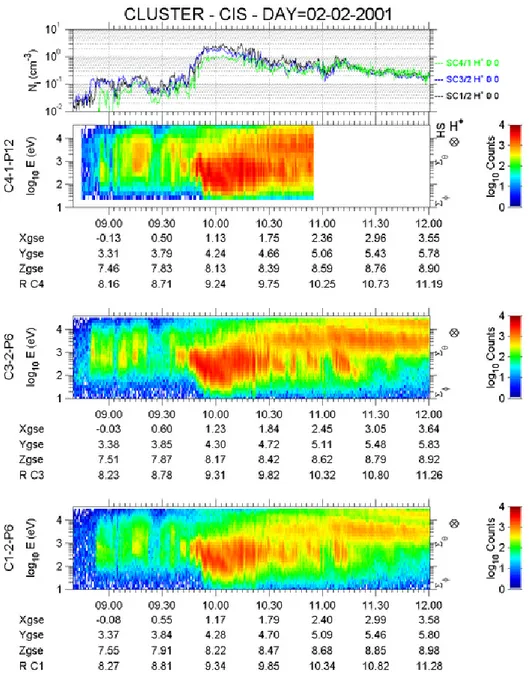
Figure 5 shows the CIS data from spacecraft 3 throughout the day. A first quick look allows us to identify the succes-sive layers that the satellites crossed. The first region is the polar cap, as Cluster is above the northern pole. Then around 10:00 UT, it crosses a region of high ion density and energy, which is very likely the cusp region. We shall see that it is indeed the cusp. Note that the convection velocity is domi-nated by the Y -component within the cusp. As the spacecraft flies further sunward, it crosses the dayside magnetosphere region and its closed field lines. Around 15:00 UT, Cluster crosses the magnetopause and ends up in the magnetosheath, where all parameters are much higher than in the magneto-sphere. At about 21:00 UT, the spacecraft goes through the bow shock and eventually ends up in the solar wind, where the plasma flow is primarily anti-sunward, as expected.
Figure 6 displays in more detail the crossing of the cusp region as seen by CIS instruments on board three spacecraft. From 07:30 (start of ESR operation) to about 08:50, the Clus-ter spacecraft are basically in the polar cap (Figs. 2 and 6). The CIS instrument on board records very few low energy protons. Just before 09:00 UT, the Cluster satellites entered
a region of plasma composed of ions in the energy range of 100 eV–5 keV. The fluxes and energies recorded there are not high enough to say that the region crossed is the cusp. The parameters are more consistent with mantle plasma, even though it is unusually structured. The crossing of this re-gion lasts for about an hour. Some of the ion structures seen throughout this interval look like ion injections.
When the three spacecraft enter the mantle, the later can be considered as immobile. The delays between the three spacecraft are consistent with the times required by the three satellites to reach a fixed structure, considering their separa-tions and velocities. Therefore, the mantle can be considered quite stable, at least at the moment when the spacecraft en-ter it. Clusen-ter observed an unusually structured mantle. This could be due to the fact that the IMF turned northward while the spacecraft were traversing this region. The reorganiza-tion of the high-latitude magnetosphere might lead to such a structured mantle. When the IMF turned northward, the cusp must then have moved poleward toward the satellites. A pe-riod of transition can actually be seen in the CIS data. A drop out of the ion flux is clearly seen in the CIS spectrometer di-rectly after 09:00 UT, the point in time when the IMF turning was seen in the magnetosphere.
Around 09:50 UT, Cluster S/C 3, followed by the other spacecraft, reaches a region where ions have basically the same energy but the fluxes are much higher: the polar cusp. The density within the cusp, 20 cm−3, is lower than average, which is consistent with a northward IMF cusp. Furthermore, the location of the satellite, projected along the field lines,
Fig. 6. Cluster data on 2 February 2001. From top to bottom, proton density from 3 spacecraft and ion spectrograms recorded by CIS
instrument on board each of the 3 spacecraft: S/C 4, S/C 3 and S/C 1.
leads to a footprint at about 83 GL. This is again in agreement with a northward IMF configuration of the cusp but not quite the same location observed by the ESR (81◦GL). Note that
the separation between the satellites is about the same but they do not enter the cusp with quite the same time delay as they did for the mantle. This shows that the cusp was moving slowly.
Within the cusp, “reverse” dispersed structures are clearly seen. The high energies are observed before the lower ones. By taking into account the motion of the satellites (fly-ing sunward), the higher energies end up poleward of the structure, whereas the lower energies are at the equatorward boundary. This is consistent with an injection in the
magne-tospheric lobe. In other words, the reconnection site must be located poleward of the spacecraft. The pulsed reconnection theory (Lockwood and Smith, 1992, 1994) offers a good ex-planation for such “saw tooth” structures. Moreover, a closer look at the particle data reveals D-shaped distributions of ions flowing predominantly downward along the magnetic field lines. For a more detailed description of this cusp cross-ing and particle injections, one should refer to the paper by Bosqued et al. (2001).
From 10:30 UT onward, Cluster starts to pick up high-energy ions. This suggests that the spacecraft are on close field lines in the dayside magnetosphere. Note that until 11:20 UT, CIS also records magnetosheath-like ions,
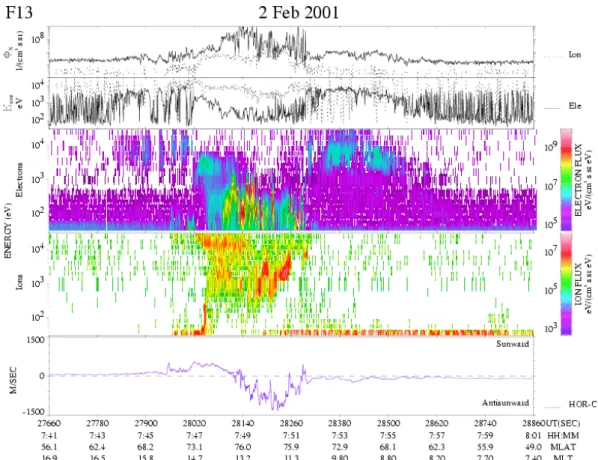
indicat-Fig. 7. DMSP data from the SSJ/4 instrument between 07:41 and 08:01 UT on 2 February 2001.
ing that Cluster must be in a boundary layer of mixed ion populations.
3.4 DMSP F13
The F13 data for the three successive passes (Fig. 2) of the northern high-latitude region are shown in Figs. 7, 8 and 9. In each successive pass, the satellite skimmed the dayside ionosphere, reaching a maximum magnetic latitude of ap-proximately 76.0◦, 77.9◦, and 80.6◦, respectively, close to the magnetic noon meridian. Plotted in each data panel in the figures are from top to bottom: (1) the integrated num-ber flux of precipitating electrons and ions, (2) the average energy of electrons and ions, (3) the differential energy flux of electrons, (4) the differential energy flux of ions, and (5) the horizontal component of the cross track convective drift. Also shown in each data panel is a vertical line indicating the time of the closest approach for the DMSP satellite over Svalbard and through the field-of-view of the ESR. Figure 2 shows the sub-orbital tracks of F13 for these three passes in a geographic coordinate reference. It is noted here, for gen-eral reference, that the IMF BZcomponent was negative for
the first pass at 07:52 and positive for the next two passes at 09:32 and 11:13 UT on 02 February 2001.
The first pass of the F13 spacecraft traversed the afternoon and morning auroral zones bounding the dayside cusp region (Figs. 2 and 7). We identify the nominal cusp as the region of
relatively cold (100–200 eV) electron precipitation between 07:49:04 to 07:50:09 UT and poleward of the 75.9◦magnetic latitude, where the character of the 1-to-10 keV ions indicates a multiple, pulsed cusp geometry on strongly anti-sunward convecting field lines. It is noted that the full latitudinal span of the dayside cusp may not be fully represented in this plot due to the tangential nature of this pass across the noontime auroral zone. In spite of this limitation, it is clear that the cusp was generally located at 75.9◦, as indicated above. In addition, the general convection pattern discerned from this pass was that the dominant cell was located in the afternoon sector, which is consistent with the positive polarity of the observed IMF BY component.
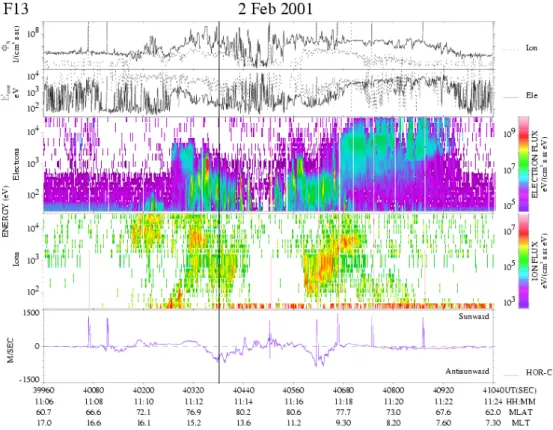
During the remaining two passes at 09:32 and 11:13 UT (Figs. 2, 8 and 9), the IMF BZpolarity was positive and the
convection across the high-latitude region was indicative of a contracted two-cell pattern of reversed convection near the poles bordered (clearest in the plot for 11:13 UT) at lower latitudes by the “traditional” convection cells. Overall, the convection was quite weak, as might be expected for a north-ward IMF orientation, and specifically, the sunnorth-ward convec-tion in the center of the polar cap was extremely small. We nominally relate the inner two cells to lobe merging and the outer cells to viscous interactions on the flanks of the mag-netosphere. Within the noontime pass at 09:32 UT (Figs. 2 and 8), there was an indication of lobe-type merging as ev-idenced by the significant flux of 100 eV to 2 keV ions with
Fig. 8. DMSP data from the SSJ/4 instrument between 09:25 and 09:43 UT on 2 February 2001. The entry of the spacecraft in the
field-of-view of the ESR is marked with a black vertical line.
a hint of a reversed dispersion, i.e. a general decrease in the mean energy of the precipitating ions with decreasing lat-itude. The F13 satellite intercepted the ESR field-of-view close to 77.4◦MLAT (80.7◦geographic latitude) within the low-latitude boundary layer situated between the cusp and the post-noon boundary plasma sheet. In the final pass at 11:13 UT (Figs. 2 and 9), a signature of lobe merging was not apparent in the noontime polar, perhaps due to the higher lat-itude (> 80◦MLAT) of this pass. The satellite traversed the field-of-view of the ESR within the boundary plasma sheet near 78.2◦MLAT (81.0◦geographic latitude). Thus, while there are notable differences in the particle signatures for each of these two time intervals, the passes, in general, are consistent with a contracted polar cap and reversed convec-tion due to lobe merging.
4 Discussion
4.1 IMF BZ-related cusp dynamics
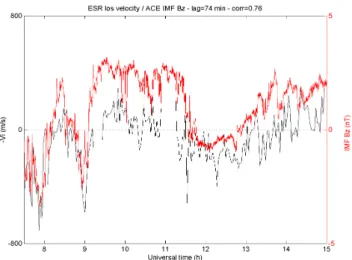
The ESR observations of the whole period (07:30–12:30 UT) exhibit the typical behavior of the cusp region under vari-ous IMF conditions. Figure 10 emphasizes the good cor-relation between the IMF BZ (shown by the red line) and
the line-of-sight velocity measured by the ESR (shown by the black line). The velocity is the northward component
of the convection velocity measured at 81◦Geographic Lat-itude (GL). For a better view, we have actually plotted −Vi
so that the plotted velocity and the corresponding IMF BZ
have the same sign. BZ measured by ACE lags behind by
74 min, a time lag for which the correlation coefficient be-tween the flow and the IMF BZ is maximum (0.76). This
time lag differs somewhat from the one calculated earlier (69 min). The difference of 5 min is due to the time the mag-netosphere/ionosphere system needs to reorganize to the new IMF conditions. The correlation is obvious: anti-sunward flow for BZ <0, and sunward for BZ >0. Note that when
the IMF points northward, the sunward plasma flow has a very weak velocity.
This first interval (07:30 to 09:00 UT) represents a typical case of the cusp responding dynamically to changes as the IMF BZ changes. However, the Z-component of the IMF
never reaches a sufficient negative value to allow the cusp to be observed by the field-aligned pointing ESR antenna. In other words, the cusp never goes down to the ESR latitude (78.20◦GL). A value of about −5/ − 6 nT would have been necessary. When the IMF is southward, dayside reconnec-tion at the magnetopause occurs and the ionospheric plasma is dragged northward by reconnected field lines. The re-connection process is efficient in terms of horizontal plasma transport: the velocities reached are high (> 500 m/s). The high electric field responsible for this flow is also responsible
Fig. 9. DMSP data from the SSJ/4 instrument between 11:06 and 11:24 UT on 2 February 2001. The black vertical line marks the conjunction
with the ESR.
for the associated Joule heating of the ion population in the ionosphere. Electron heating in the F-region is due to low energy electron precipitation. Both ESR (Fig. 4) and DMSP (Fig. 7) data reveal poleward-moving transients due to a vari-ation in the reconnection rate at the dayside magnetopause.
However, we should be careful not to see all moving struc-tures as the signature of flux tubes just having been recon-nected. There is another explanation for poleward moving structures. For example, a plasma blob created at a lower lat-itude and convected northward would look like a poleward moving transient in ESR data, although it has nothing to do with reconnection. In this case, the electron temperature as-sociated with such a cold plasma blob is not supposed to increase. Having said that, the poleward moving features, whatever their cause, are characteristic of the ionosphere dy-namics under southward IMF.
4.2 IMF polarity changes, transition intervals
The IMF turning at 09:00 UT is not associated with an im-mediate response of the ionosphere. The ESR sees a period of transition lasting approximately 4 min. This time is neces-sary for the coupled magnetosphere/ionosphere to reorganize itself to the new convection configuration. This is very con-sistent with the 4 min reported by Taylor et al. (1998). This delay is of the same order of the 5 min found earlier between the expected northward turning of the IMF at the ionosphere and the response of the latter.
On the other hand, when the IMF turns southward again around 11:20 UT, the period of transition over which the ionospheric plasma comes from low-latitudes and moves poleward due to a northward convection, looks somewhat different. In fact, a closer look at the ESR flow data (Figs. 5 and 10) indicates that the ionospheric plasma flow starts to become poleward before the actual IMF turning. There are two explanations for this: (1) reconnection in the magneto-spheric lobe stops due to unfavorable IMF conditions; (2) ESR starts to observe the return anti-sunward flow in be-tween the lobe and viscously-driven afternoon cells. The last DMSP F13 overpass at 11:13 UT confirms the latter. How-ever, both explanations may make a contribution. We should mention that at the end of the reverse flow period, the IMF
BX becomes positive. Combined with a positive BZ, this
does not give, in theory, favorable conditions for lobe recon-nection occuring. Since the sunward convection remains, it is highly probable that the Y -component of the IMF plays here a crucial role by allowing reconnection to occur in the side lobe of the magnetosphere.
4.3 Northward IMF cusp
After the turning of the IMF, the plasma seen by the ESR (Ne, Fig. 4), which was at about 82◦GL, starts moving
equa-torward, steered by sunward convection. After this transi-tion period, the ionosphere, as seen by the ESR, is “emp-ty”. The winter hemisphere is usually not considered to be a
favored hemisphere for lobe reconnection. However, Lock-wood and Moen (1999) have reported a case of lobe recon-nection in winter. The negative X-component of the IMF was then thought to fulfill the anti-parallelism condition between the magnetic field of the Earth and that of the interplanetary medium. In our case, we also have a negative X-component around −3 nT. Although IMF BX<0 and BZ>0, the
con-ditions did not seem a priori ideal for having lobe reconnec-tion. Having said that, the sunward flow observed by the ESR strongly suggests that we do have lobe reconnection. The electron density also measured by the ESR is very low on the order of 1011m−3throughout the whole period, thus show-ing that the reconnection mechanism at the lobes is much less efficient than at the dayside magnetopause. There is no clear sign of equatorward moving transient, such as those reported by Lockwood and Moen (1999) or Sandholt at al. (2000), either in the electron density or in the electron temperature. However, it is clear that the boundary between the sunward and anti-sunward convecting plasma region corresponds to high electron and ion temperature. Previous observations have shown that cusp precipitations for northward IMF take place at the equatorward edge of the lobe cell (Sandholt et al., 1999b). The higher ion temperatures between the two cells are due to Joule heating arising from a high electric field. Having said that, one can ask oneself why the elec-tron density is so low in the cusp. Knowing that the cusp is located at 81◦GL and that the ESR dish points at 30◦of ele-vation, it means that the measurements in the cusp plasma are made at about 300 km of altitude, i.e. in the F-region. This altitude should be ideal to observe the effects of low-energy electron precipitations. On the other hand, the ions injected in the cusp observed by Cluster are in the 100 eV–5 keV en-ergy range. They are therefore too energetic to contribute to the electron density at the altitude at which the ESR observes the cusp. They are expected to precipitate much lower. As a matter of fact, 1–4 keV ions have a maximum of ionization rate between about 140 and 180 km. Consequently, the con-tribution of the precipitating ion population, even the least energetic one, is certainly negligible in the observed electron density at 300 km of altitude. The other point is the absence of structures in the electron density. We propose that there might be several reasons for this. First, all the particles in-jected in the lobe might not reach the ionosphere. In addi-tion, we saw that the velocity measured by Cluster within the cusp was predominantly zonal. The structures associ-ated with the reconnection pulses might have been stretched out in the Y -direction and, therefore, might not be clearly visible by the ESR. Finally, although we were very careful with the mapping and although we have used DMSP satellite data to make sure that both Cluster and the ESR were ob-serving the same relevant regions, we saw here that the ESR and Cluster observations of the cusp region are not fully con-sistent in terms of cusp location. We would like to remind the reader and emphasize that the mapping of satellite data along the Earth’s field lines down to the ionosphere may be hazardous in the cusp region. In addition, at the time when the ion dispersed structures are seen in CIS data, the
pro-Fig. 10. Lagged Z-component of the Interplanetary Magnetic Field
(red) and the latitudinal plasma velocity measured by the ESR at geographic latitude 82◦ (black) versus time between 07:30 and 15:00 UT. Best correlation (0.76) obtained for a magnetic field lagged by 74 min.
jected orbit of the spacecraft is east of the ESR field-of-view. The assumption that the X-line (reconnection line) is wide enough to be observed by the ESR simultaneously may also be wrong. The last two DMSP overflights turned out to be very complementary to ESR observations. While ESR ob-serves toward the magnetic North Pole, i.e. at more or less constant magnetic longitude, the DMSP passes occurred at almost constant magnetic latitude, thereby cutting the iono-sphere perpendicularly to the ESR beam. The plasma flow observed (4-cell pattern) is very consistent with lobe recon-nection under northward IMF as well.
4.4 ESR-Cluster conjunction
In the late morning, around 11:30 UT, Cluster space-craft “cross” the field-of-view of the ESR between 80 and 81 GL. The Cluster spacecraft seem then to be in some kind of boundary layer in which a mixed popula-tion of magnetosheath-like and mirroring high-energy ions is recorded. According to ACE data, the IMF turns north-ward around this time. ESR located in the afternoon sector by that time, records relatively high electron density and a weak but northward plasma flow. All this suggests that the conjunction between Cluster and ESR does not occur in the cusp region, but rather on closed field lines.
5 Conclusion
We have presented a case study of coordinated observation of the polar cusp region by the EISCAT Svalbard Radar, Clus-ter spacecraft and the DMSP F13 satellite. The three instru-ments turned out to be very complementary for this kind of study. This combination made it possible to compare the
cusp region under southward and northward IMF and to ac-curately describe the northward IMF case.
For the short southward IMF intervals, the ionosphere, as observed by the ESR, exhibits a typical behavior. Poleward propagating transients associated with rather strong poleward ionospheric flows are observed.
When Cluster reaches the high-latitude cusp, the IMF has turned northward. The ionosphere observed by the ESR is then completely different. The plasma density and temper-ature are low, indicating very weak precipitations, and the plasma flow is clearly sunward although it has a low veloc-ity. Cluster and DMSP satellites allowed us, by character-izing the ion injections for the former and thanks to particle and plasma flow data for the latter, to confirm that the reverse flow observed at ESR was really due to lobe reconnection under northward IMF conditions. The reconnection process was seen to be sporadic or pulsing in nature, as it is for south-ward IMF. However, it still remains unclear whether ESR does observe the same transient behavior in the ionosphere.
A good agreement has been found between IMF BZ
mea-sured by ACE, and the plasma flow: anti-sunward for nega-tive BZ, sunward for positive BZ. Although the lobe
recon-nection is favored in summertime (Crooker and Rich, 1993), and the IMF is neither strongly northward nor strongly anti-sunward, we do have evidence of lobe reconnection. The im-portant parameter is actually the elevation angle of the IMF. In our case, it is about 45◦. This value, though rather high, seems to be sufficient to allow lobe reconnection in the win-ter hemisphere.
We strongly encourage more systematic studies of the cusp region under northward IMF, especially by using the ESR radar in the configuration we used here, namely, with the steerable antenna pointing northward.
Acknowledgement. The authors are grateful to the director and staff of the EISCAT Scientific Association for providing the radar facili-ties and assistance with making the observations. EISCAT is an in-ternational association, supported the research councils of Finland, France, Germany, Japan, Norway, Sweden and the United King-dom. We thank the institutes, which maintain the IMAGE magne-tometers array. The IMAGE magnetometer data are collected as a Finnish-German-Norwegian-Polish-Russian-Swedish project. ACE data were provided by Caltech University. We thank the Situation Satellite Center (SSC Web) for the satellites orbits. We would like to thank A. Vontrat-R´eb´erac for valuable comments on earlier ver-sion of this manuscript.
Topical Editor M. Lester thanks I. McCrea and F. Fenrich for their help in evaluating this paper.
References
Bosqued, J.-M., Phan, T. D., Dandouras, I., et al.: Ion observations in the high-latitude magnetopause and cusp: first results from the CIS ion instruments, Ann. Geophysicae, this issue, 2001. Chandler, M. O., Fuselier, S. A., Lockwood, M., and Moore, T.
E.: Evidence of component merging equatorward of the cusp, J. Geophys. Res., 104, 14 647, 1999.
Crooker, N. U.: Reverse convection, J. Geophys. Res., 97, 19 263, 1992.
Crooker, N. U. and Rich, F. J.: Lobe cell convection as a summer phenomenon, J. Geophys. Res., 98, 13 403, 1993.
Even, S. A., Farrugia, C. J., and Cowley S. W.: Pulsating cusp aurora for northward interplanetary magnetic field, J. Geophys. Res., 103, 27 507, 1998.
Fuselier, S. A., Trattner, K. J., and Petrinec, S. M.: Cusp observa-tions of high- and low-latitude reconnection for northward inter-planetary magnetic field, J. Geophys. Res., 105, 253, 2000a. Fuselier, S. A., Petrinec, S. M., and Trattner, K. J.: Stability of the
high-latitude reconnection site for steady northward IMF, Geo-phys. Res. Lett., 27, 473, 2000b.
Hardy, D. A., Schmitt, L. K., Gussenhoven, M. S., and Marshall, F. J.: Precipitating electron and ion detectors (SSJ/4) for the Block 5D/Flights 6–10 DMSP satellites: calibration and data presenta-tion, AFGL-TR-84-0317, pp. 50, Air Force Geophysics Labora-tory, Hanscom AFB, MA, 1984.
Huang, C. S., Andre, D. A., Sofko, G. J., and Kustov, A. V.: Super Dual Auroral Radar Network observations of ionospheric multi-cell convection during northward interplanetary magnetic field, J. Geophys. Res., 105, 7419, 2000.
Lockwood, M. and Smith, M. F.: The variation of reconnection rate at the dayside magnetopause and cusp ion precipitation, J. Geo-phys. Res., 97, 14 841, 1992.
Lockwood, M. and Smith, M. F.: Low- and middle-altitude cusp particle signatures for general reconnection rate variations, J. Geophys. Res., 99, 8531, 1994.
Lockwood, M. and Moen J.: Reconfiguration and closure of lobe flux by reconnection during northward IMF: Possible evidence for signature in cusp/cleft auroral emission, Ann. Geophysicae, 17, 8, 996–1011, 1999.
Lockwood, M., McCrea, I. W., Milan, S. E., Moen, J., Cerisier, J.-C., and Thorlfsson, A., Plasma strucure with poleward-moving cusp/cleft auroral transients: EISCAT Svalbard Radar observa-tions and explanation in terms of local time extend of events, Annales Geophys., Vol. 18, No. 9, 1027, 2000.
Lockwood, M., Opgenoorth, H., van Eyken, A. P., et al.: Coor-dinated Cluster, ground-based instrumentation and low-latitude satellite observations of transient poleward-moving events in the low and high-latitude mantle regions, Ann. Geophysicae, this is-sue, 2001.
McCrea, I. W., Lockwood, M., Moen, J., Pitout, F., Eglitis, P., Aylward, A. D., Cerisier, J.-C., Thorolfssson, A., and Milan, S. E.: ESR and EISCAT observations of the response of the cusp and cleft to IMF orientation changes, Ann. Geophysicae, 18, 9, 1009–1026, 2000.
Maynard, N. C., Burke, W. J., Pfaff, R. F., Weber, E. J., Ober, D. M., Weimer, D. R., Moen, J., Milan, S., Maseide, K., Sandolt, P. E., Egeland, A., Søraas, F., Lepping, R., Bounds, S., Acu˜na, M. H., Freudenreich, H., Machuzak, J. S., and Gentille, L. C.: Driv-ing dayside convection with northward IMF: observations by a sounding rocket launched from Svalbard, J. Geophysic. Res., 105, 5245, 2000.
Milan, S. E., Lester, M., Cowley, S. W., and Brittnacher, M.: Day-side convection and auroral morphology during an interval of northward interplanetary magnetic field, Ann. Geophysicae, 18, 4, 436–444, 2000.
Newell, P. T., Meng, C.-I., Sibeck, D., and Lepping, R.: Some low-altitude cusp dependencies on the interplanetary magnetic field, J. Geophys. Res., 94, 8921, 1989.
N., Moen, J., and Smith, R. W.: Multi-instrument probing of the polar ionosphere under steady northward IMF, Ann. Geophysi-cae, 18, 1, 90–98, 2000.
R`eme, H., Aoustin, C., Bosqued, J.-M., et al.: First multispacecraft ion measurements in and near the Earth’s magnetosphere with the identical Cluster Ion Spectrometry (CIS) experiment, Ann. Geophysicae, this issue, 2001.
Rich, F. J.: Users guide for the topside ionospheric plasma moni-tor (SSIES, SSIES-2, and SSIES-3) on spacecraft of the Defense Meteorological Satellite Program (DMSP), Vol 1: Technical De-scription, PL-TR-94–2187, pp. 69, Air Force Phillips Laboratory, Hanscom AFB, MA, 1994.
Russell, C. T., et al.: Entry of the Polar spacecraft into the polar cusp under northward IMF conditions, Geophys. Res. Lett., 25, 3015, 1998.
Russell, C. T., Le, G., and Petrinec, S. M.: Cusp observations of high- and low-latitude reconnection for northward IMF: an alter-nate view, J. Geophys. Res., 105, 5489, 2000a.
Russell, C. T.: The polar cusp, Coordinated measurements of mag-netospheric processes, 25, 1413, 2000b.
Sandholt, P. E., Farrugia, C. J., and Cowley, S. W. H.: Pulsating cusp aurora for northward IMF, J. Geophysic. Res., 101, 26 507, 1998a.
Sandholt, P. E., Farrugia, C. J., Moen, J., Noraberg, Ø., Lybekk, B., Sten, T., and Hansen, T.: A classification of dayside auroral forms and activities as a function of IMF orientation, J. Geo-physic. Res., 103, 23 325, 1998b.
Sandholt, P. E., Farrugia, C. J., Cowley, S. W. H., Denig, W. F.,
Lester, M., Moen, J., and Lybekk, B.: Capture of magnetosheath plasma by the magnetosphere during northward IMF, Geophys. Res. Lett., 26, 2388, 1999a.
Sandholt, P. E., Farrugia, C. J., Cowley, S. W. H., Lester, M., Moen, J., Lybekk, B., and Trondsen, E.: Excitation and decay of mag-netospheric lobe cell convection and its associated aurora, Geo-phys. Res. Lett., 26, 2597, 1999b.
Sandholt, P. E., Farrugia, C. J., Cowley, S. W. H., Lester, M., Denig, W. F., Cerisier, J.-C., Milan, S. E., Moen, J., Trondsen, E., and Lybekk, B.: Dynamic cusp aurora and associated pulsed re-verse convection during northward interplanetary magnetic field, J. Geophysic. Res., 105, 12 869, 2000.
Song, P., DeZeeuw, D. L., Gombossi, T. L., Groth, C. P., and Pow-ell, K. G.: A numerical study of solar wind-magnetosphere inter-action for northward interplanetary magnetic field, J. Geophys. Res., 104, 28 361, 1999.
Song, P., Gombossi, T. I., DeZeeuw, D. L., Powell, K. G., and Groth, C. P.: A model of solar wind-magnetosphere-ionosphere coupling for due northward IMF, Planet. Space Sci., 48, 29, 2000. Taylor, J. R., Lester, M., Yeoman, T. K., Greenwald, R., Sofko, G., and Villain, J.-P.: Ionospheric convection response to a north-ward turning of the interplanetary magnetic field on 23 March 1995 studied employing SuperDARN HF radar data, Adv. Space. Res., 22, 1289, 1998.
Thorolfsson, A., Cerisier, J.-C., Lockwood, M., Sandholt, P. E., Se-nior, C., and Lester, M.: Simulataneous optical aurora and radar signatures of polar-moving auroral forms, Ann. Geophysicae, 18, 9, 1054–1066, 2000.