Journal of Applied Biosciences 136: 13877 - 13886
ISSN 1997-5902
Additive Main Effect and Multiplicative Interactions (AMMI)
and Regression Analysis in Sorghum [
Sorghum bicolor (L).
Moench] Varieties
Gebeyehu Chala1*, Bulti Tesso2, Dagnachew Lule3 and Kebede Dessalegn4
1Oromia Agricultural Research Institute, Mechara Agricultural Research Center
2Haromaya University, Alemaya, Ethiopia, 3Oromia Agricultural Research Institute, Addis Ababa, Ethiopia, 4Bako Agricultural Research Center, Bako, Ethiopia
*Corresponding author: [email protected]
Original submitted in on 11th January 2019. Published online at www.m.elewa.org/journals/ on 30th April 2019
https://dx.doi.org/10.4314/jab.v136i1.4
ABSTRACT
Background and justification: Ethiopia is the third largest sorghum producer in Africa next to Nigeria and Sudan. Shortage of widely adapted and stable high yielding variety is one of the major bottlenecks for production and productivity of sorghum in the country. Grain yield performance is not the only parameter for selection as a genotype with the highest grain yield would not necessarily mean stable and adaptable across location and years. Eberhart and Russell (1996) and AMMI model could be the preferable tools to identify stable, high yielding and adaptable genotype (s) for wider or specific environments.
Objectives: To identify stable high yielding sorghum varieties that could be adapted for wider and/or specific environments and make recommendations for further demonstration and production in the test environments and similar agro ecologies.
Material and methods: A total of 21 released sorghum varieties and a local check were evaluated at three locations in western Ethiopia (Bako, Gute, Biloboshe) and two locations in eastern Ethiopia (Mechara and Mieso) in 2017 main cropping seasons. The trial was arranged in a randomized complete block design (RCBD) in three replications.
Summary of results and application of the study: The combined analysis of variance revealed highly significant effect of environment and genotype by environment interactions for grain yield. This indicated that the tested varieties showed inconsistent grain yield performance across locations. Birmash variety
gave the highest grain yield with average yield of 3.5 ton ha-1 but specifically adapted to Gute, Biloboshe
and Mechara. Baji was the second high yielding variety with mean grain yield of 3.3 ton ha-1 and relatively
with wider adaptability. The first two IPCAs accounted for a total of 88.64% of the interaction sum square. In general, deviation from regression coefficient, AMMI stability value and genotype selection index revealed that Baji, Birmash, Emahoy, IS9302 and Gambella-1107 were relatively stable varieties with optimum grain yield and therefore recommended for further demonstration and popularization in the test locations and areas with similar agro-ecologies.
INTRODUCTION
Sorghum [Sorghum bicolor (L.) Moench] is a C4 cereal crop belonging to the family Gramineae. It has 2n = 20 chromosomes and an estimated genome size of 750 Mb being twice the genome of rice and six times the genome of Arabidopsis (Passardi et al., 2004). Sorghum is a dryland cereal crop grown on approximately 44 million hectares of land (Prakash et al., 2010) in 99 countries (ICRISAT, 2009) with an annual production of 60 million tons (Iqbal et al., 2010). It is widely cultivated in different parts of Ethiopia. Several authors reported that Ethiopia is the primary center of origin and hence, center of diversity for sorghum (De Wet and Huckabay, 1967; Doggett, 1988; Smith and Frederiksen, 2000). Sorghum is widely grown in the dry areas of Africa, Asia, America and Australia (Dickon et al., 2006). Although sorghum is cultivated both in tropical and temperate climates, it is best known for its adaptation to the drought- prone semi-arid tropical (SAT) regions of the world (Baummhardt, 2000) and used for food for the poorest people who live in semiarid regions of the world (Jiang et al., 2013). It can be adapted to environments with 400-600 mm annual rainfall that are too dry for other cereals to grow (Dickon et al., 2006). Sorghum is one of the most important cereal crops planted as food insurance, especially in the moisture deficit lowlands of eastern, northern and north-eastern parts of Ethiopia where the climate is characterized by unpredictable drought and erratic rainfall (Degu et al., 2009). It is also one of the most important cereal crops of the tropics grown extensively over wider areas with altitude ranging from 400 to 3000 meters above sea level (m.a.s.l) due to its ability to adapt the adverse environmental conditions. It is the major source of energy and protein for millions of people living in arid and semi-arid region of the world. It occupied third position in terms of production in Africa after wheat and maize and fifth in the world after wheat, maize, rice and barley (FAO, 2017). Moreover, it is widely used as a source of nutrition, fodder, biofuel, fiber and confection (Abubakar and Bubuche, 2013). It is able to grow under severe stress conditions. Sorghum can be
cultivated successfully on almost all soils and in the temperature range of 16–40°C (Abubakar and
Bubuche, 2013). Ethiopia is the third largest sorghum producer in Africa next to Nigeria and Sudan (FAOSTAT, 2012). In Ethiopia, a total of 4.34 million tons of sorghum is being produced per annum. The
mean yield level in the country is estimated at 2.4 t ha−1. The crop is the major food cereal after maize and
tef in terms of number of growers, area coverage and grain production in the country (FAO, 2017). Oromia, Amhara and Tigray regions are the three major sorghum producers in the country (CSA, 2016). Out of the total sorghum area harvested in 2014 main cropping season, Oromia region accounts 39.92% (669,575.97 hectares), Amhara and Tigray regions contributed 33.31% (558,827.95 hectares) and 12.82% (215,111.82 hectares), respectively. In multi-environment trials, the phenotype of an individual is a measure of an environment main effect, a genotype main effect, and the genotype by environment interaction (GEI) (Yan and Tinker, 2005). More than forty sorghum varieties were released in the country from different regional and national research centers during the last 40 years (MoA, 2017). However, most of the varieties were not evaluated for their specific and wider adaptability and thus exhibit fluctuating yields when grown in different environments or agro-climatic zones. To this end, multi- environment adaptability and stability test is crucial to identify stable high yielding and adaptable varieties and discover sites that best represent the target environment (Yan et al., 2000). Adaptability is the result of genotype, environment and genotype by environment interaction. A given variety could perform at an acceptable level in a range of environments, referred to as general adaptability, but others could perform well only in desirable environments, known as specific adaptability (Farshadfar and Sutka, 2008). Therefore, the present study aims to identify stable high yielding sorghum varieties that could be adapted for wider and/or specific environments and make recommendations for further demonstration and production in the test environments and similar agro ecologies.
MATERIALS AND METHODS
Description of the Study Area: Field experiment was conducted during 2017 main cropping season at five locations in Ethiopia where sorghum is widely grown. The locations were Bako, Gute, Biloboshe (Western
Oromia), Mechara, and Mieso (Eastern Oromia). The detailed agro-ecological conditions of the locations are presented in Table 1.
Table 1: Agro-ecological features of the experimental locations. Locations Altitude
(m.a.s.l) Rain fall (mm) Ave. Soil Type Geographic coordinates Latitude Longitude Ave. Temp. (ºC) Max. Min.
Gute 1906 1633.5 Alfisoils 9o00'N 36o38'E 21.6 14.3
Biloboshe 1758 1568.6 Sandy Loam 9 o00'N 38 o10'E 21.4 14.2
Bako 1650 1425.3 Alfisoils 9o6' N 37o09'E 20.4 13.5
Mechara 1760 871 Sandy loam 8o36'N 40o18 'E 23.4 8.9
Mieso 1470 856.8 Vertisoil 16o06'N 37o 08'E 35.0 8.3
Source: Bako and Mechara Agricultural Research Centers Plant Materials: A total of 21 sorghum varieties released from different research centers in Ethiopia were evaluated against one local check. The detailed
information about the experimental materials is presented in Table 2.
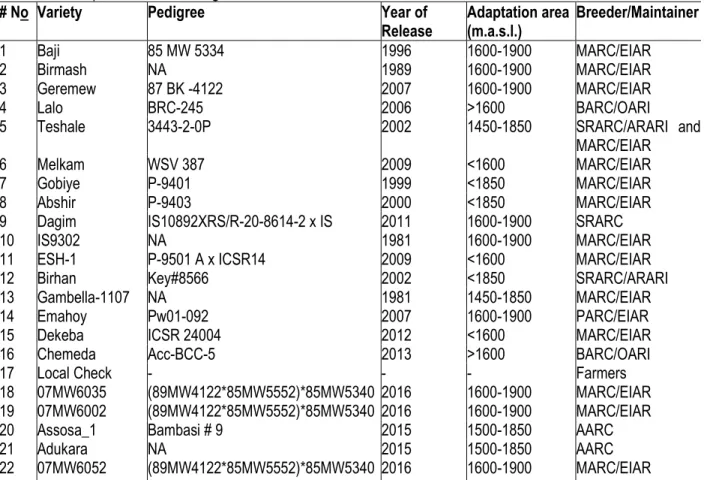
Table 2: Description of different sorghum varieties tested at five locations.
# No Variety Pedigree Year of
Release Adaptation area (m.a.s.l.) Breeder/Maintainer
1 Baji 85 MW 5334 1996 1600-1900 MARC/EIAR
2 Birmash NA 1989 1600-1900 MARC/EIAR
3 Geremew 87 BK -4122 2007 1600-1900 MARC/EIAR
4 Lalo BRC-245 2006 >1600 BARC/OARI
5 Teshale 3443-2-0P 2002 1450-1850 SRARC/ARARI and
MARC/EIAR
6 Melkam WSV 387 2009 <1600 MARC/EIAR
7 Gobiye P-9401 1999 <1850 MARC/EIAR
8 Abshir P-9403 2000 <1850 MARC/EIAR
9 Dagim IS10892XRS/R-20-8614-2 x IS 2011 1600-1900 SRARC
10 IS9302 NA 1981 1600-1900 MARC/EIAR
11 ESH-1 P-9501 A x ICSR14 2009 <1600 MARC/EIAR
12 Birhan Key#8566 2002 <1850 SRARC/ARARI
13 Gambella-1107 NA 1981 1450-1850 MARC/EIAR
14 Emahoy Pw01-092 2007 1600-1900 PARC/EIAR
15 Dekeba ICSR 24004 2012 <1600 MARC/EIAR
16 Chemeda Acc-BCC-5 2013 >1600 BARC/OARI
17 Local Check - - - Farmers
18 07MW6035 (89MW4122*85MW5552)*85MW5340 2016 1600-1900 MARC/EIAR 19 07MW6002 (89MW4122*85MW5552)*85MW5340 2016 1600-1900 MARC/EIAR
20 Assosa_1 Bambasi # 9 2015 1500-1850 AARC
21 Adukara NA 2015 1500-1850 AARC
22 07MW6052 (89MW4122*85MW5552)*85MW5340 2016 1600-1900 MARC/EIAR Key: EIAR=Ethiopian Institute of Agricultural Research, MARC=Melkasa Agricultural Research Center, BARC= Bako Agricultural Research Center, SRARC= Sirinka Agricultural Research Center, ARARI=Amhara Regional Agricultural Research Institute,
Experimental procedures: The trial was laid out in Randomized Complete Block Design (RCBD) with three replications. The experimental plot consisted of two rows, each 5 m in length with 75 cm between row spacing and 15 cm spacing between plants. Seeds were sown by hand drilling at the rate of 12 kg ha-1 as per the recommendation for row planting in sorghum. Thinning was done two weeks after emergence to adjust plant to plant spacing. 100 kg ha-1 NPS fertilizer was applied at planting. Urea was applied as top
dressing at the rate of 50 kg ha-1 at knee height stage. The field was kept free of weeds by hand weeding during the whole growing period.
Stability analysis
Eberhart and Russell’s model: Yield stability was determined following the Eberhart and Russell (1966) model by regressing of the mean grain yield of individual genotypes on environmental index and calculating the deviation from the regression.
Where:
Yij = the mean of the ith genotype in the jth environment, µi = the grand mean,
βi = the regression coefficient of the ith genotype on environmental index,
Ij = the environmental index obtained by the difference between the mean of each environment and the grand
mean, δij = the regression deviation of the ith cultivar in the jth environment
Additive Main effect and Multiplicative Interaction (AMMI) model :
The AMMI model was calculated using the formula suggested by Zobel (et al., 1988):
Where: = the mean yield of genotype i in environment j, = the grand mean, = the deviation of the genotype mean from the grand mean, = the deviation of the environment mean from the grand mean, = the singular value for the IPCA n, N = the number of PCA axis retained in the model, = the PCA score of a genotype for PCA axis n, = the
environmental PCA score for PCA axis n, = the AMMI residual and = the residuals.
AMMI’s stability value (ASV): The AMMI model is essential to quantify and rank genotypes according to their yield stability. This value was calculated according to Purchase (1997) as follow:
In effect, the ASV is the distance from zero in a two dimensional scatter graph of IPCA1 (Interaction Principal Component Analysis axis 1) scores against IPCA 2 scores. Since the IPCA1 score contributes more to G x E sum of squares, it has to be weighted by the proportional difference between IPCA1 and IPCA2 scores to compensate for the relative contribution of IPCA1 and IPCA2 to the total G x E sum of squares.
Genotype Selection Index (GSI): Stability is not the only parameter for selection as the most stable genotypes would not necessarily give the best yield performance. Therefore, based on the rank of mean grain yield of genotypes (RYi) across environments and rank of AMMI stability value (RASVi), genotype selection index (GSI) was calculated for each genotype as: RYi = RASVi + GSIi. A genotype with the least GSI is considered as the most stable (Farshadfar, 2008).
RESULTS AND DISCUSSION
Analysis of variance The mean grain yield of varieties averaged over environments indicated that, Birmash, Baji and IS9302 followed by Emahoy gave higher grain yield (3.52, 3.34, 3.21 and 3.19 ton ha-1), respectively and the lowest for Abshir (1.52 ton ha-1) (Table 3). The result of the combined ANOVA showed that, the total variation in grain yield was attributed due to
environmental (19.34%), genotypic (19.78%) and GEI (47.85%) effects (Table 5). This implied that the largest proportion of the variation was due to the interaction effect than the main effect. Similar results were reported by Asfaw (2007); Hagos and Fetien (2011); Mahnaz et al. (2013) and Sewagegne et al. (2013). Table 3. Mean grain yield (tons ha-1) across different locations in 2017 cropping season
# No Varieties Grain yield (ton ha
-1) of testing locations Mean GY
Bako Biloboshe Gute Mechara Miesso
1 Baji 3.123ab 4.136ab 4.311b 3.863a-d 1.287cd 3.34
2 Birmash 2.674b-e 4.229a 4.795ab 4.159a-c 1.721a-d 3.52
3 Geremew 2.808a-c 3.294a-d 4.655ab 2.271f-k 1.037 d 2.81
4 Lalo 2.909a-c 4.051ab 4.778ab 2.110g-l 1.680b-d 3.17
5 Teshale 2.598b-e 2.378de 1.295ij 4.331a-c 2.500a 2.62
6 Melkam 2.720a-d 1.512e 1.487g-j 3.717b-e 1.693a-d 2.23
7 Gobiye 2.096d-f 2.339de 0.951ij 2.280f-j 1.476b-d 1.78
8 Abshir 1.609f 1.503e 0.597j 2.325f-i 1.571b-d 1.52
9 Dagim 1.675f 4.034a-c 4.419ab 2.615d-h 1.232cd 2.79
10 IS9302 2.987a-c 3.731a-c 4.461ab 3.490b-g 1.368b-d 3.21
11 ESH-1 2.801a-c 1.538e 1.735f-i 2.333f-i 1.832a-d 2.05
12 Birhan 2.056 ef 1.477e 0.682j 2.429e-h 1.650b-d 1.61
13 Gambella-1107 2.452c-e 2.994b-d 2.634d-f 4.121a-c 1.747a-d 2.97
14 Emahoy 2.970a-c 2.884cd 3.251cd 4.871ab 1.975a-c 3.19
15 Dekeba 1.597 f 2.344de 1.895f-i 4.090a-c 1.442b-d 2.27
16 Chemeda 2.366c-e 1.589e 2.177e-h 3.593b-f 2.200ab 2.38
17 Local check 2.635b-e 1.357e 4.445ab 0.721m 1.293cd 2.12
18 07MW6035 2.750a-c 3.425a-d 3.099c-e 0.941j-m 1.241cd 2.35
19 07MW6002 2.988a-c 3.247a-c 5.444a 0.99i-m 1.212cd 2.82
20 Assosa_1 2.988a-c 1.440e 1.232h-j 3.433c-g 1.559b-d 2.01 21 Adukara 2.379f 1.468e 2.823e-g 5.120a 1.559b-d 2.76 22 07MW6052 2.834a-c 3.693a-c 3.929bc 1.952h-m 1.025d 2.6 Mean 2.525 2.68 2.921 2. 98 1.559 2.553 CV% 13.2 31.5 18.9 24.4 27.5 LSD (0.05) 0.551 1.382 0.91 1.199 0.708
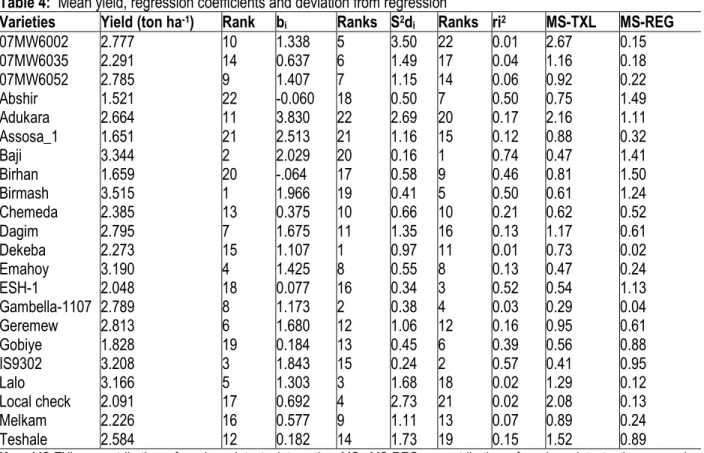
Stability Analysis using Eberhart and Russell Regression Model; According to Eberhart and Russell (1966), a stable genotype should have high yield, unit regression coefficient (bi) and deviation from regression (Sdi2) close to zero. Accordingly, varieties such as Gambella-1107 and Emahoy had regression coefficient closer to unity, deviation from regression very close to zero with and mean grain yield greater than the average and hence could be considered as stable
varieties (Table 4). Varieties such as Dekeba and Lalo showed regression coefficient close to unity but Dekeba was specifically adapted to Mechara amd Lalo to Gute & Billo Boshe site Varieties such as Chemeda, ESH-1 and Gobiye had regression coefficients less than one, implying their specific adaptability to marginal environments. Miesso site was low yielding environment in 2017.
Table 4: Mean yield, regression coefficients and deviation from regression
Varieties Yield (ton ha-1) Rank bi Ranks S2di Ranks ri2 MS-TXL MS-REG
07MW6002 2.777 10 1.338 5 3.50 22 0.01 2.67 0.15 07MW6035 2.291 14 0.637 6 1.49 17 0.04 1.16 0.18 07MW6052 2.785 9 1.407 7 1.15 14 0.06 0.92 0.22 Abshir 1.521 22 -0.060 18 0.50 7 0.50 0.75 1.49 Adukara 2.664 11 3.830 22 2.69 20 0.17 2.16 1.11 Assosa_1 1.651 21 2.513 21 1.16 15 0.12 0.88 0.32 Baji 3.344 2 2.029 20 0.16 1 0.74 0.47 1.41 Birhan 1.659 20 -.064 17 0.58 9 0.46 0.81 1.50 Birmash 3.515 1 1.966 19 0.41 5 0.50 0.61 1.24 Chemeda 2.385 13 0.375 10 0.66 10 0.21 0.62 0.52 Dagim 2.795 7 1.675 11 1.35 16 0.13 1.17 0.61 Dekeba 2.273 15 1.107 1 0.97 11 0.01 0.73 0.02 Emahoy 3.190 4 1.425 8 0.55 8 0.13 0.47 0.24 ESH-1 2.048 18 0.077 16 0.34 3 0.52 0.54 1.13 Gambella-1107 2.789 8 1.173 2 0.38 4 0.03 0.29 0.04 Geremew 2.813 6 1.680 12 1.06 12 0.16 0.95 0.61 Gobiye 1.828 19 0.184 13 0.45 6 0.39 0.56 0.88 IS9302 3.208 3 1.843 15 0.24 2 0.57 0.41 0.95 Lalo 3.166 5 1.303 3 1.68 18 0.02 1.29 0.12 Local check 2.091 17 0.692 4 2.73 21 0.02 2.08 0.13 Melkam 2.226 16 0.577 9 1.11 13 0.07 0.89 0.24 Teshale 2.584 12 0.182 14 1.73 19 0.15 1.52 0.89
Key: MS-TXL = contribution of each variety to interaction MS, MS-REG = contribution of each variety to the regression component of the treatment by location interaction, MS-DEV (sdi2) =deviations from regression component of interaction, ri2 =
squared correlation between residuals from the main effects model and the site index, bi = regression coefficient
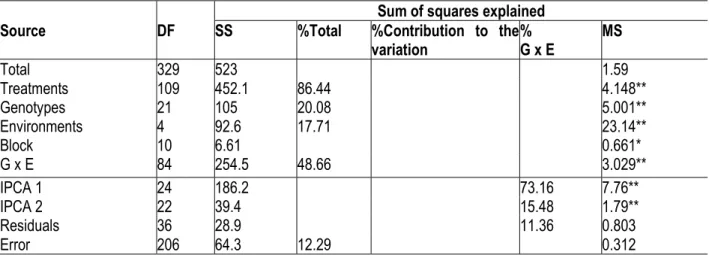
Additive main effect and multiplicative interactions (AMMI) model: The combined AMMI ANOVA of the twenty two sorghum varieties over five locations for grain yield (ton ha-1) is presented in Table 5. The ANOVA table indicated highly significant differences (p<0.01) for the environments, genotypes, GEI and the first two IPCA. The total variation explained was 86.45% for treatments (20.08% was due to the genotypes, 17.71% was due to the environment and 48.66% was due to their interaction) and the remaining 13.55% for error. The greater contribution of the treatment over the error indicated the reliability of this multi-location experiment. The lion share of variation was largely due to GEI. As discussed earlier, the high percentage of GEI is an indication for the highly variable sorghum growing environment. This also revealed that there was a differential yield performance among the released varieties across testing
environments. As G x E interaction was significant, further calculation of genotype stability was coducted. In the AMMI ANOVA, the GEI was further partitioned using PCA. The number of PCA axis to be retained is determined by testing the mean square of each axis with the estimate of residual using the F-statistics. The result of ANOVA showed that the first two IPCA were highly significant at (P<0.01) implying the inclusion of the first two interactions PCA axes in the model. Hence, the best fit AMMI model for this multi-location yield trial data was AMMI-2 (Table 5). Gauch and Zobel (1996) suggested that the most accurate model for AMMI can be predicted by using the first two IPCAs. Several authors took the first two IPCAs such as for bread wheat (Asnake et al., 2013), common bean (Abeya et al., 2008) and finger millet (Dagnachew et al., 2014,
Table 5: AMMI analysis of variance for grain yield (ton/ha) of sorghum varieties tested at five locations during 2017 main cropping season.
Sum of squares explained %Total %Contribution to the
variation % G x E Source DF SS MS Total 329 523 1.59 Treatments 109 452.1 86.44 4.148** Genotypes 21 105 20.08 5.001** Environments 4 92.6 17.71 23.14** Block 10 6.61 0.661* G x E 84 254.5 48.66 3.029** IPCA 1 24 186.2 73.16 7.76** IPCA 2 22 39.4 15.48 1.79** Residuals 36 28.9 11.36 0.803 Error 206 64.3 12.29 0.312
Key: DF = degree of freedom, SS =sum of squares, MS = mean of squares and, GxE = Genotype by Environment, * significant (P<0.05), ** = highly significant (P<0.01).
AMMI Stability Values (ASV) and Genotype Selection Index : In AMMI stability value analysis (ASV), a genotype with least ASV score is the most stable across environments and the larger the ASV value, either negative or positive, the more specifically adapted a genotype is to certain environments (Purchase, 1997). Accordingly, Gambella-1107 and Baji showed the least ASV than the others (Table 6).
Stability is not the only parameter for selection of high yielding genotypes as the most stable genotypes would not necessarily give the best yield performance. As such, the genotype selection index (GSI) revealed that Baji, IS9302, Birmash, Gambella-1107 and Emahoy were among the top-ranking genotypes integrating both stability and grain yield performance parameters (Table 6).
Table 6. Mean grain yield, IPCA scores and ASV of 22 sorghum varieties evaluated at five locations during 2017 main cropping season.
Varieties Yield (ton ha-1 )
Rank IPCA1 IPCA2 IPCA3 IPCA4 ASV ASV
Rank GSI 07MW6002 2.777 10 -1.134 -0.269 0.309 -0.079 2.4791 22 32 07MW6035 2.291 14 -0.609 -0.491 -0.537 0.190 1.4122 15 29 07MW6052 2.785 9 -0.615 -0.142 -0.212 0.578 1.3440 13 22 Abshir 1.521 22 0.509 -0.401 -0.317 -0.270 1.1769 9 31 Adukara 2.664 11 0.781 0.297 0.680 0.266 1.7236 19 30 Assosa_1 1.651 21 0.543 0.275 0.066 0.154 1.2125 11 32 Baji 3.344 2 -0.287 -0.526 -0.108 0.378 0.8146 3 5 Birhan 1.659 20 0.526 -0.504 -0.224 -0.058 1.2483 12 32 Birmash 3.515 1 -0.304 0.681 -0.029 -0.186 0.9480 7 8 Chemeda 2.385 13 0.484 -0.194 0.339 -0.365 1.0690 8 21 Dagim 2.795 7 -0.604 0.544 -0.322 -0.545 1.4216 16 23 Dekeba 2.273 15 0.513 0.440 -0.102 -0.287 1.1983 10 25 Emahoy 3.190 4 0.380 0.393 0.264 0.079 0.9161 6 10 ESH-1 2.048 18 0.272 -0.648 0.126 0.097 0.8773 4 22 Gambella-1107 2.789 8 0.318 0.306 -0.118 -0.030 0.7552 1 9 Geremew 2.813 6 -0.678 0.130 0.192 0.121 1.4802 17 23 Gobiye 1.828 19 0.328 -0.370 -0.572 0.059 0.8046 2 21 IS9302 3.208 3 -0.362 0.392 0.074 0.179 0.8793 5 8 Lalo 3.166 5 -0.783 0.017 -0.328 -0.124 1.7020 18 23 Local check 2.091 17 -0.772 -0.639 0.858 -0.294 1.7960 20 37 Melkam 2.226 16 0.636 -0.197 0.234 0.241 1.3958 14 30 Teshale 2.584 12 0.858 -0.144 -0.275 -0.107 1.8694 21 33 Mean 2.553
Key: IPCA=Interaction Principal Component Axis 1, 2, 3 and 4; ASV=AMMI Stability Value SUMMARY AND CONCLUSIONS
Multi-location trials are very important for selecting the best genotype for wider or specific environments before advising or recommending crop varieties for commercial production. A total of 21 sorghum varieties were evaluated against the local check across five locations in 2017. The combined analysis of variance revealed highly significant effect of environment and genotype by environment interactions for grain yield. About 48.68% of the total variation was explained by G x E interaction effect. This implied that the environments were variable and varietal performance
across locations was inconsistent. Most of the tested varieties were adapted to specific location. For instance, 07MW6002, Adukara and Teshale variety showed better performance at Gute, Mechara and Miesso, respectively. Generally, the mean grain yield performance, ASV, deviation from regression coefficient and GSI revealed that Baji, Birmash, Emahoy, IS9302 and Gambella-1107 were relatively stable varieties with optimum grain yield and therefore recommended for further popularization.
REFERENCE
Abeya Temesgen, Chemeda Daba, Girma Mengistu, Dagnachew Lule and Negash Geleta (2008). Regression and Additive mean effect and multiple interactions (AMMI) in common bean (Phaseolus vulgaris (L.) genotypes. Ethiopian Journal of Biological Science. 7(1):45-53 Abubakar, L. and Bubuche, T. S. 2013. Genotype x
environment interaction on yield and its
component of sorghum (Sorghum bicolor (L.) Moench) genotypes of some selected states in North-Western Nigeria. International Journal of Current Agricultural Research, 1(6): 27-29.
http://www.wrpjournals.com/journals/V/IJCAR
Asfaw Adugna. 2007. Assessment of yield stability in sorghum. African Crop Science Journal, 15 (2): 83 – 92.
Asnake W, Henry M, Temesgen Z, Girma T, 2013. Additive main effects and multiplicative interactions model (AMMI) and genotype main effect and genotype by environment interaction (GGE) biplot analysis of multienvironmental wheat variety trials. African J. Agric. Res. 8(12):1033-1040.
CSA (Central Statistical Agency). 2016. Agricultural sample survey 2010/2011: report on area and production of crops (private peasant holdings, main season), vol. 1. Addis Ababa: Federal Democratic Republic of Ethiopia, Central Statistical Agency.
Dagnachew Lule, Masresha Fetene, Santie de Villiers and Kassahun Tesfaye (2014). Additive Main Effects and Multiplicative Interactions (AMMI) and genotype by environment interaction (GGI) biplot analyses aid selection of high yielding and adapted finger millet varieties. Journal of Applied Biosciences. 76:6291– 6304.
De Wet JMJ, Huckabay JP (1967). The origin of Sorghum bicolor. II. Distribution and domestication. Evolution 21 (4):787-802. Doggett H (1988) Sorghum. Longman Scientific &
Technical, London.
Eberhart, S.A. and Russel, W.A. 1966. Stability parameters for comparing varieties. Crop Science, 6:36-40.
FAOSTAT. 2012. Database of agricultural production. Rome: Food and Agriculture Organization of the United Nations. Available at http://faostat.fao.org/default.aspx accessed November 2015.
FAOSTAT. 2017. Food and Agriculture Organization of the United Nations Data base of AgriculturalProduction.FAOStatisticalDatabase s.Availableathttp://faostat.fao.org/site/339/defa ult. aspx.
Farshadfar, E. (2008). Incorporation of AMMI Stability Value and Grain Yield in a Single NonParametric Index (Genotype Selection Index) in Bread Wheat. Pakistan Journal of Biological Sciences 11:1791–1796.
Gauch HG, Zobel RW, 1996. AMMI analysis of yield
Hagos Tadesse and Fetien Abay. 2011. Additive Main Effects and Multiplicative Interactions analysis of yield performance of sesame genotypes across environments in Northern Ethiopia. Journal of the dry lands, 4(1): 259-266. ICRISAT (International Crops Research Institute for the
Semi-Arid Tropics). 2009. online Available on the website http://www.icrisat.org/ Assessed on July 5, 2011.
Iqbal, A., Sadia, B., Khan, A.I., Awan, F.S., Kainthand, R.A. and Sadaqat, H.A. 2010. Biodiversity in the sorghum (Sorghum bicolor L. Moench) germplasm of Pakistan. Genetics and Molecular Research, 9 (2): 756-764.
Kebede Dessalegn, Dagnachew Lule, Girma Mengistu, Kassa Mamo, Chemeda Birhanu, Girma
Chemeda& Gudeta Bedada (2018). Genotype
by Environment Interaction & Grain Yield Stability Analysis for Finger Millet Genotypes from Western Oromia. Ethio. J Crop Scie. 6 (1):119-134
Mahnaz, R., Ezatollah, F. and Mohammad, M. J. 2013. Additive Main Effect and Multiplicative Interaction Analysis of phenotypic stability in chickpea genotypes over stress and non-stress environments. International Journal of Agriculture and Crop Sciences, 5(36):253-260. MOA (Ministry of Agriculture). 2017. Annual action plan report on cereals. Amhara National Regional State Bureau of Agriculture, Bahir Dar, Ethiopia.
Prakash, R., Ganesamurthy, K., Nirmalakumari, A. and Nagarajan, P. 2010. Heterosis for fodder yield in sorghum (Sorghum bicolor L. Moench). Electronic Journal of Plant Breeding, 1(3): 319-327.
Passardi, F., Longet, D.,Penel, C. and Dunand, C. 2004. The class III peroxidase multigenic family in rice and its evolution in land plants. Phytochemistry, 65: 1879–1893. Purchase, J.L. 1997. Parametric analysis to describe
genotype by environment interaction and stability in winter wheat. PhD.thesis. Department of Agronomy, Faculty of Agriculture, University of the Orange Free State, Bloemfonten, South Africa.
Sewagegne Tariku, Taddesse Lakew, Mulugeta Bitew and Mitiku Asfaw, 2013. Genotype by
Ethiopia. Net Journal of Agricultural Science, 1(1): 10-16.
Smith CW, Frederiksen RA (2000) Sorghum: origin, history, technology, and production, vol 2. John Wiley & Sons, USA.
Yan, W., Hunt, L.A., Sheng, Q. and Szlavnics, Z. 2000. Cultivar evaluation and mega environment investigation based on the GGE biplot. Crop Science, 40: 597–605.
Yan, W. and Tinker, N.A. 2005. An integrated biplot analysis system for displaying, interpreting and exploring genotype by environment interactions. Crop Science, 45: 1004–16. Zobel, W.R., Wright, M.J. and Gauch, H.G. 1988.
Statistical analysis of a yield trial. Agronomy Journal, 80:388-393