UNIVERSITÉ DE MONTRÉAL
DEVELOPMENT OF A WELDABILITY TESTING SYSTEM TO QUANTIFY
HOT CRACKING SUSCEPTIBILITY OF INCONEL 718 PRE-WELDED
SHEETS
HAMZEH FATHOLLAHZADEH DÉPARTEMENT DE GÉNIE MÉCANIQUE ÉCOLE POLYTECHNIQUE DE MONTRÉAL
MÉMOIRE PRÉSENTÉ EN VUE DE L’OBTENTION DU DIPLÔME DE MAÎTRISE ÈS SCIENCES APPLIQUÉES
(GÉNIE MÉCANIQUE) AVRIL 2015
ÉCOLE POLYTECHNIQUE DE MONTRÉAL
Ce mémoire intitulé :
DEVELOPMENT OF A WELDABILITY TESTING SYSTEM TO QUANTIFY HOT CRACKING SUSCEPTIBILITY OF INCONEL 718 PRE-WELDED SHEETS
présenté par : FATHOLLAHZADEH Hamzeh
en vue de l’obtention du diplôme de : Maîtrise ès sciences appliquées a été dûment accepté par le jury d’examen constitué de :
M.ACHICHE Sofiane, Ph. D., président
Mme BROCHU Myriam, Ph. D., membre et directrice de recherche M. BROCHU Mathieu, Ph. D., membre
DEDICATION
“Everyone has a happy ending, if you are not happy then it is not the end.”
ACKNOWLEDGEMENTS
I would like to express my sincere gratitude to my supervisor, Professor Myriam Brochu for her guidance, technical and financial support, and helpful discussions during the course of this research.
I would also like to thank my loving wife, Nazanin Yadollahi, for her emotional support throughout all these years.
I extend many thanks to Pratt and Whitney for their support to provide required samples for my project.
And of course, I want to thank all the friends, professors, and classmates, who have been there through the good and the bad over these wonderful past two years.
RÉSUMÉ
Les défauts de fissuration à chaud sont fréquemment observés lors du soudage à l'arc sous gaz avec électrode de tungstène (GTAW), de feuilles d'Inconel 718. Dans le but de résoudre ce problème et d'améliorer la qualité des soudures, un projet de recherche a été mené par professeure Brochu de l’École Polytechnique de Montréal. Dans le cadre de ce dernier, des soudures ayant une variété de microstructures ont été produites en faisant varier les paramètres de soudage. Dans certaines de ces microstructures, un joint de grain central rectiligne a été observé : une caractéristique qui semblerait être à l’origine des fissures. Par la suite, des tentatives pour produire une soudure sans joint de grain central furent amorcées. Suite à ce projet, il a été jugé nécessaire de tester la susceptibilité à la fissuration à chaud des différents joints soudés. Ainsi, le but de ce projet est de développer un système et une méthode expérimentale permettant de déterminer l’effet de la microstructure de soudures existantes sur leur susceptibilité à la fissuration à chaud, et ce à un moindre coût. La procédure adoptée pour la conception et le développement du système est divisée en plusieurs étapes, soit l’analyse de la littérature et des méthodes d'essai de soudabilité existantes, la conception du système et le développement de la procédure expérimentale permettant d’évaluer les capacités du système.
En ce qui a trait à l’analyse de la littérature, les propriétés mécaniques de différents superalliages de nickel, particulièrement les alliages de type IN718, ont été comparées à d’autres matériaux. Les maints types de fissures pouvant se former lors du procédé de soudage de ces alliages ont ensuite été examinés. Les méthodes d'essai de soudabilité les plus courantes pour quantifier la sensibilité à la fissuration à chaud des matériaux y sont décrites. Il a été conclu de la revue de littérature que les méthodes d'essai impliquant l’application d’une contrainte externe sont plus efficaces que les autres puisqu’elles offrent un meilleur contrôle sur le déroulement du test.
Dans le chapitre suivant, les capacités et les limites des différentes méthodes décrites précédemment ont été analysées et comparées afin de vérifier leur capacité à répondre aux attentes et aux spécificités techniques du projet. Il a été conclu que la méthode d'essai de ductilité à chaud est celle qui répond au plus grand nombre de critères pour ce projet. Le chapitre 4 décrit le processus de conception de la méthode d'essai de ductilité à chaud qui comprend divers obstacles et défis qui ont dû être surmontés. Le chapitre concernant les procédures expérimentales et la mise sur pied du système fournit des détails sur certaines caractéristiques, et des spécifications quant
aux dispositifs et au matériel utilisés. Ensuite, l’assemblage des différents dispositifs est expliqué. Ce chapitre contient aussi des explications supplémentaires sur la procédure d’évaluation de la fonctionnalité et de l'efficacité du système.
Les résultats des tests ont montré que l'écart type maximum pour la mesure de la ductilité à chaud est de 6 et se produit à 1210ºC. D'autres essais ont été effectués sur deux microstructures soudées d’IN718 différentes pour valider la capacité du système à déterminer la susceptibilité à la fissure de solidification de différentes microstructures d’un même matériau. Les résultats ont confirmé qu’une microstructure soudée présentant un joint de grain central est plus susceptible de développer des fissures lors de la solidification de la soudure.
Finalement, des calculs plus détaillés ont été faits pour déterminer le budget requis pour créer et installer le système. Les résultats ont démontré qu’un budget d’environ 50,000$ est nécessaire pour développer ce système au département de génie mécanique de l’École Polytechnique de Montréal. De plus, le temps total requis pour déterminer la soudabilité d'un matériau par cette méthode est d'environ huit heures de travail, auquel il faut ajouter le temps nécessaire à la préparation de l'échantillon.
ABSTRACT
Hot cracking defects are frequently observed during the gas tungsten arc welding of Inconel 718 sheets. In order to solve this problem and improve the quality of the welds, a research project was carried out by prof. Brochu, École Polytechnique de Montréal. In their study, a series of welds with different microstructures were produced using various welding parameters. In some of these microstructures, longitudinal centerline grain boundary was observed: a characteristic that is seemingly a weak point for crack initiation. Subsequently, multiple attempts to produce a weld with no evidence of the centerline grain boundaries were initiated. Following up with the project by prof. Brochu, it was deemed necessary to test the hot cracking susceptibility of the different welds that were produced. Thus, this project’s goal is to develop a system and an experimental method that are capable of determining the effect of the microstructure of the existing welds on their hot cracking susceptibility, and all of this at the lowest possible price. The procedure adopted to design and develop the system is divided in multiple steps, namely the literature review, the analysis of the existing weldability testing methods, the design of the system and the development of the experimental procedure allowing to evaluate the capabilities of the system.
In the literature review, the mechanical properties of several nickel base superalloys, particularly the IN718 alloys, were compared with other materials. The several types of welding cracks occurring during the welding processes of such alloys were then explained. The main part of this chapter describes the common weldability testing methods used to quantify susceptibility of the materials to hot cracking. It was concluded that the tests including the application of an external load are more efficient than the others since they provide a better control over the testing process. In the next chapter, the capacities and the limitations of the different methods described above were analyzed and compared in order to verify their capability to satisfy the expectations and the technical specificities of this project. It was concluded that the hot ductility test is the method that meets the highest number of requirements of the project. Chapter 4 describes the designing process of the hot ductility testing system which includes various obstacles and challenges that had to be overcome during this endeavor.
The chapter concerning the experimental procedures and the system setup provides details about certain capabilities and on specifications concerning the devices and the equipment used. Then, the
assembly of the different devices is explained. This chapter also contains further explanations about the evaluation process of the functionality and the effectiveness of the system.
The test results showed that the highest standard deviation of hot ductility measurements is of 6 at 1210 ºC. Further tests were carried out on two different IN718 weld microstructures to validate the capability of the system to determine the solidification cracking susceptibility of different microstructures of the same material. The results confirmed that the weld microstructure with a longitudinal centerline grain boundary was more susceptible to weld solidification cracking. Finally, more detailed calculations were made to determine the required budget to set up and install the system. The results showed that a budget of approximately 50,000$ is required to develop this system at the mechanical engineering department of the École Polytechnique de Montréal. Additionally, the total required time to determine the weldability of a material with this method is of about eight hours, to which the time required for sample preparation has to be added.
TABLE OF CONTENT
DEDICATION ... III ACKNOWLEDGEMENTS ... IV RÉSUMÉ...V ABSTRACT ... VII TABLE OF CONTENT ... IX LIST OF TABLES ...XIII LIST OF FIGURES ... XIV LIST OF SYMBOLS AND ABBREVIATIONS ... XVIIINTRODUCTION ... 1
Problem statement ... 1
General objectives ... 2
Specific objectives ... 2
LITERATURE REVIEW ... 4
1.1 Nickle base superalloys ... 4
1.2 Welding of superalloys ... 5
1.3 Welding defects and cracks ... 7
1.3.1 Cold cracking ... 7
1.3.2 Hot cracking ... 8
1.4 Weldability testing methods ... 10
1.4.1 Modified cast pin tear test ... 10
1.4.2 Varestraint test ... 12
1.4.3 Sigmajig ... 16
1.4.5 Hot ductility test by Gleeble ... 22
1.5 Conclusion ... 26
ANALYZING THE EXISTING WELDABILITY TESTING METHODS .... 27
2.1 Quantifying hot cracking susceptibility of a thin pre-welded sample ... 27
2.2 Measuring the weldability of welds produced by different welding parameters... 28
2.3 Testing time and cost ... 28
2.3.1 Required equipment and specimen preparation ... 28
2.3.2 Required testing time... 29
2.4 Conclusion ... 31
DESIGN METHODOLOGY AND CHALLENGES ... 32
3.1 Producing a welding thermal cycle ... 32
3.1.1 Heater ... 32
3.1.2 Cooler ... 36
3.1.3 Thermometer ... 37
3.2 Mechanically testing samples ... 39
3.3 Precisely measuring ductility ... 39
3.3.1 Extensometer ... 40
3.3.2 Control and monitoring system ... 44
3.4 Conclusion ... 45
EXPERIMENTAL SETUP AND PROCEDURE ... 47
4.1 Testing equipment ... 47
4.1.1 Induction heater... 47
4.1.2 Mechanical tester ... 48
4.1.4 Infrared pyrometer ... 49
4.1.5 Control system ... 50
4.2 Experimental procedure ... 51
4.2.1 Test specimen... 51
4.2.2 System setup and connections ... 55
4.2.3 Coil design ... 56
4.2.4 Calibration of the infrared thermometer on LabVIEW ... 57
4.2.5 Measuring and compensating for emissivity ... 58
4.2.6 Heating and cooling rate ... 58
4.2.7 Ductility measurement ... 59
4.2.8 NST test ... 59
4.2.9 On-heating test ... 60
4.2.10 On-cooling test ... 61
RESULTS AND DISCUSSION ... 62
5.1 Hot ductility testing parameters ... 62
5.1.1 Thermal cycle... 62
5.2 Testing precision ... 64
5.3 Weldability test ... 65
5.3.1 Hot-ductility behavior of steel samples ... 65
5.3.2 Hot ductility of Inconel 718 weld microstructures ... 67
5.4 Sensitivity to quantify the SCS of the weld microstructures ... 72
5.5 System analysis ... 76
CONCLUSION ... 78
LIST OF TABLES
Table 2-1 : Required samples and equipment in externally loaded methods ... 29
Table 2-2 : Required time for each step at different weldability methods, valued from 1 (lowest) to 4 (highest) ... 30
Table 2-3 : The procedure followed to find the potential research problems ... 31
Table 3-1 : Comparison of the different heating system ... 34
Table 3-2 : Comparison of the different thermometers ... 38
Table 3-3 : Comparison of the different methods to measure the elongation ... 42
Table 3-4 : Procedure followed to design the hot ductility testing system ... 45
Table 4-1 : Chemical composition of AISI 1005 grade steel (weight %) ... 51
Table 4-2 : Nominal welding parameters of two types of welds ... 52
Table 4-3 : Chemical composition of nickel superalloy IN718 (weight %) ... 52
Table 5-1 : Emissivity values at various temperature ranges ... 63
Table 5-2 : Testing repetitions for the on-heating and NST tests ... 64
Table 5-3 : Rupture elongation percentage of steel samples at different heating cycles... 66
Table 5-4 : NST results for microstructures of two welding pools ... 68
Table 5-5 : Rupture elongation percentage of IN718 welds at different heating cycles ... 68
Table 5-6 : Comparison of hot ductility parameters measured by different researchers ... 71
Table 5-7 : Total cost to setup the hot ductility testing system... 76
LIST OF FIGURES
Figure 1-1 : Stress-rupture behavior of three classes of superalloys [7] ... 5
Figure 1-2 : GTAW system [8] ... 6
Figure 1-3 : GTAW torch in operation [9] ... 6
Figure 1-4 : Cold cracks locations in (a) cross section and (b) surface of a weld (inspired from [10]) ... 7
Figure 1-5 : Hot cracks in cross section (a) and surface (b) of a weld (inspired from [10]) ... 8
Figure 1-6 : (a) Solidification grain boundaries in a weld metal [12]. (b) Formation of solidification cracking during welding process [13]. ... 9
Figure 1-7 : A mold of cast pin tear test [15] ... 11
Figure 1-8 : Locations of cracking in different cast pins shown by arrows [14] ... 11
Figure 1-9 : Results of modified cast pin test for different alloys [15] ... 11
Figure 1-10 : (a) A varestraint testing machine [17]. (b) The direction of welds relative to the applied augmented bending strain. (c) A schematic of the Varestraint testing machine showing its different mandrel die radius (inspired from [18]). ... 13
Figure 1-11 : The stretched surface of two samples showing crack propagation in (a) transverse and (b) spot test... 14
Figure 1-12 : The methodology through which temperature of liquid metal pool is monitored and SCTR is measured [19]. ... 15
Figure 1-13 : Schematic of a Sigmajig testing fixture (inspired from [23]). ... 16
Figure 1-14 : Fusion zone crack induced by an external load in the Sigmajig test ... 17
Figure 1-15 : A typical Sigmajig testing diagram indicating that the material (b) is more weldable than the material (a) [14] ... 18
Figure 1-16 : General schematic of the U-type tester configuration (inspired from [2]) ... 19
Figure 1-17 : U- type hot cracking test setup [28] ... 20
Figure 1-19 : Hot ductility test by a Gleeble machine[29] ... 22
Figure 1-20 : (a) Heat distribution over a sample in the free span with the cold and hot jaws [30]. (b) The thermal schedule over which the samples are fractured at various target testing temperatures ... 23
Figure 1-21 : Typical on-cooling and on-heating ductility curves [14] ... 24
Figure 3-1 : Different width of coils with a load inside (a and b) ... 35
Figure 3-2 : Different elongation stages during a tensile test. (a) Reference points before application of strain. (b) Sample at rupture instant. (c) Sample after rupture ... 44
Figure 3-3 : General configuration of the system ... 46
Figure 4-1 : Induction heater system including a power supply and an output station [38]... 48
Figure 4-2 : High speed camera [43] ... 49
Figure 4-3 : High speed fiber optic infrared transmitter with the lens probe [41] ... 50
Figure 4-4 : NI USB-6210 data acquisition system [44] ... 50
Figure 4-5 : Geometry of the testing specimen (dimensions in mm) ... 52
Figure 4-6 : An IN718 plate made from welded coupons ... 53
Figure 4-7 : Schematic of the welded plates after machining ... 53
Figure 4-8 : Machined samples : (a) sample with a weld in the center, (b) sample after polishing ... 53
Figure 4-9 : Weld pool shapes (a and b) and the microstructures (c and d) resulted from different welding speeds. Presence of longitudinal center line grain boundary shown by the arrows (EBSD analysis) (e) ... 54
Figure 4-10 : Microstructures of the welds after experiencing the testing heating cycle, (a) elliptical and (b) teardrop weld pool shapes ... 55
Figure 4-11 : (a) Coil and specimen. (b) Orientation and distance of the infrared lens and camera relative to the welded region in the specimen ... 55
Figure 4-13 : Induction coil geometry with a sample inside ... 57
Figure 4-14 : (a) LM78XX voltage regulator pinout. (b) Application circuits [46] ... 58
Figure 4-15 : Reference points on a specimen before and after fracture ... 59
Figure 4-16 : General connection between controller and other devices in the system ... 61
Figure 5-1 : Voltage-temperature relationship of the thermometer at 0.99 emissivity ... 63
Figure 5-2 : Emissivity of steel 1005 and IN718 samples at different temperatures ... 63
Figure 5-3 : Images of a fractured sample during an NST test, captured by the high speed camera. (a) Fracture just occurred at 1405ºC, (b) An image captured within a few millisecond after the fracture. ... 64
Figure 5-4 : Fractured steel samples in the on-heating tests ... 66
Figure 5-5 : On-heating curve of AISI 1005 grade steel ... 67
Figure 5-6 : Fractured specimen of IN 718 samples during hot ductility test ... 69
Figure 5-7 : Hot ductility curves of elliptical pool shape weld ... 70
Figure 5-8 : Hot ductility curves of teardrop pool shape weld ... 70
Figure 5-9 : Comparison of the hot ductility parameters for the weld microstructures ... 72
Figure 5-10 : Comparison of the hot ductility for the three Haynes 282 alloys (a, b and c) with the same NST and peak temperatures [36]. ... 73
Figure 5-11 : On-cooling curves and the ductility recovery lines (DRL) of two weld microstructures ... 74
LIST OF SYMBOLS AND ABBREVIATIONS
Symbols
σth Threshold stress
µ0 Magnetic permeability
µr Relative permeability
S Coil tube section
AB, A’B’, A’’B’’ Pair reference points aȧ, bḃ , cċ Pair reference points
d0, d1 , d2 Distance between the reference points dave1 , dave2 Rupture displacement average
Di Inside coil diameter
di Inside coil tube diameter
Do Outside coil diameter
do Outside coil tube diameter
e% Elongation %
W Weld width
Wh Sample width in its head
Wrc Sample width in its reduced section
x Skin depth
δ Elongation
δw Resolution
ρ Electrical resistivity
Abbreviations
ASTM American Society For Testing And Materials
BRT Brittle Temperature Range
CLGB Center Line Grain Boundary
DAQ Data Acquisition System
DRH Direct Resistance Heating
DRL Ductility Recovery Lines
DRT Ductility Recovery Temperature
EBSD Electron Backscatter Diffraction
EBW Electron Beam Welding
GTAW Gas Tungsten Arc Welding
HAZ Heat Affected Zone
HCS Hot Cracking Susceptibility
IH Induction Heating
IN718 Inconel 718
IRH Indirect Resistance Heating
MIG Metal Inert Gas
NDT Nil Ductility Temperature
NST Nil Strength Temperature
PT Peak Temperature
SAW Submerged Arc Welding
SCS Solidification Cracking Susceptibility SCTR Solidification Cracking Temperature Range
INTRODUCTION
Aerospace engineers are always aiming to design jet turbine engines with higher capacities than their previous versions. Since these engines run at very high temperatures, they require special metal alloys capable of retaining their strength even at temperatures above 600°C. Nickel-based superalloys are one of the most important classes of engineering materials that can withstand these severe conditions. They are also widely applicable in rocket engines, nuclear power, chemical processing plants and other demanding environments [1].
In order to weld nickel and its alloys, most of the conventional welding processes can be used. However, gas tungsten arc welding (GTAW), metal inert gas (MIG) welding, submerged arc welding (SAW) and electron beam welding (EBW) are considered as the most common methods to weld these alloys [2].
The most important issue that limits the welding of these alloys is the presence of cracks either in the weld or near the fusion zone, in the heat affected zone (HAZ). Solidification cracking, liquation cracking and strain-age cracking are known as the most important cracking types to have been identified in these alloys [3]. Thus, studying the susceptibility of different materials to these types of welding cracks has always been an interest for many researchers. The varestraint test, modified cast pin tear test, Sigmajig test, hot ductility test and strain-to-fracture test are all well-known weldability testing methods.
Different weldability testing methods are designed to be applied for numerable testing conditions, sample geometries and materials. Therefore, many parameters such as the geometry of the material, the type of welding, the expected precision and the budget should be considered prior to selecting a method for weldability tests.
Problem statement
The industrial partner of this project has observed occurrence of the hot cracking defects during the GTAW of Inconel 718 sheet and forged component assembly. Thus, a research project was launched by Brochu et al. [4] to understand and improve the resistance of the joints to solidification cracking. Following a detailed characterization of cracked and uncracked specimens, it was proposed that center line grain boundary (CLGB) increases the weld susceptibility to solidification
cracking. In the second step of their research, it was attempted to promote a weld, free of center line grain boundary by modifying welding parameters. Finally, three different weld microstructures were produced, but no equipment was available to verify that the produced microstructures really improved the weld resistance to solidification cracking. Thus, the current research aims to develop a weldability testing system and method capable of quantifying hot cracking susceptibility of welds having different microstructures.
General objectives
The general objective of the current project is to develop a weldability testing system with less than 25,000$ which can be used to quantify hot cracking susceptibility (HCS) of pre-welded IN718 samples.
Specific objectives
The achievement of the following specific objectives will bring the project to completion:
Identifying the best weldability testing method which meets technical requirements of the current project.
Analyzing the system in terms of feasibility of developing the system at school.
Evaluating of the system in terms of its testing precession and is capability to quantify solidification cracking susceptibility (SCS) of Inconel 718 samples.
Document organization
In the first chapter of this document, different types of welding cracks and the common methods of quantifying weldability of different materials are discussed. The second chapter outlines the limitations of each method to see which one is the best match for the requirements of this project. Then, in the third chapter, the possibility of applying various devices and equipment in the weldability testing system is explained and analyzed. The fourth chapter includes experimental and setup procedures through which the system is designed, developed and used to determine the weldability of different samples. Testing results and discussion are presented in the fifth chapter. This includes the results of hot ductility tests and the quantifying solidification cracking
susceptibility of two weld microstructures. Finally the conclusion, recommendations and future work are discussed.
LITERATURE REVIEW
In this chapter, general properties of nickel base superalloys will be described and compared. It will be followed by the introduction of different types of cracks which usually occur during or after the welding of nickel alloys. Then, some important and widely used methods to determine the weldability of materials will be presented.
1.1 Nickle base superalloys
In the second and third decades of the 20th century, stainless steels were widely used for high temperature applications since a strong and corrosion resistant material was required. Advances in the aerospace industry were coincident with the improvement of engines capable of working at higher temperatures. The application of stainless steels was therefore limited since they could not exhibit desirable mechanical properties at temperatures above 540°C. In fact, their limitation in strength was a boost for the development of more heat resistant alloys. Superalloys are a good example of alloys developed specifically after World War II which were applied in aircrafts, industrial gas turbines and oil equipment. Superalloys are heat-resisting alloys which are grouped on the basis of their chemical composition. Today, nickel base superalloys represent about 50% of an aircraft engines’ weight mostly due to their special metallurgy and mechanical properties [5]. In general, nickel based superalloys are divided into two major groups depending on their strengthening mechanisms:
Solid solution strengthening, Precipitation strengthening.
Solid solution strengthened alloys exhibit moderated creep resistance (Figure 1-1) but good corrosion resistance up to 800° C. They are also widely used in power generation, chemical processing, petrochemical industries and composite tooling. Precipitation strengthened alloys exhibit outstanding corrosion resistance and high strength even at very high temperatures [3, 6]. Figure 1-1 indicates a 100 hours stress rupture behavior for three classes of superalloys [7]. The figure also includes the stress-rupture behavior of carbide-phase-strengthened cobalt alloys which is not of any interest for this research.
Figure 1-1 : Stress-rupture behavior of three classes of superalloys [7]
1.2 Welding of superalloys
Welding is often used to manufacture components from superalloys. Cost effectiveness and successful manufacturing is therefore highly influenced by the alloy weldability. One of the common welding methods in the aerospace industry is GTAW. This welding process is very interesting for this project since it was used to produce different weld microstructures by using different welding parameters as will be explained bellow.
In the welding process by GTAW, a power supply is used to create an electric arc between a non-consumable tungsten electrode and a work piece (Figure 1-2). The energy created by the power supply melts the metals and produces a weld. An inert shielding gas (Argon and Helium) is used to protect the weld area (fusion zone and heat affected zone) from atmospheric contamination. Depending on the application, a filler metal can be used (Figure 1-3). When no filler material is required, the method is called autogenous welding.
Figure 1-2 : GTAW system [8]
Figure 1-3 : GTAW torch in operation [9]
There are three main variables which can be used in welding process by the GTAW. The first variable is the arc voltage, which is the voltage between the tungsten electrode tip and the work piece. The arc current and length, the type of shielding gas and the shape of the tungsten electrode tip can influence the arc voltage. The second variable is the welding current which can be used to get a desired welding penetration. Depending on the material and thickness of the metal base and the geometry of the electrode, various welding currents may be applied. The speed at which a torch (Figure 1-3) is moved along the joint is the last variable, called the welding speed. The shape of the weld pool and width are important characteristics of a weld which are affected by the welding speed. Power supply Shielding Gas Workpiece Torch Gas shield Welding direction Shielding gas in Current conductor Filler material
Non-consumable tungsten electrode Torch
1.3 Welding defects and cracks
Most defects which occur during welding of nickel-base superalloys are cracks. Although the quality of a weld can be influenced by a wide variety of defects (undercut, inadequate fusion and porosity), cracks are one of the worst types of defect since a failure can be caused by the growth of a small crack. One of the factors that contribute to the formation of a crack is the material’s insufficient ductility in combination with tensile stresses. Thus, the temperature at which a crack initiates can be used to categorize different types of cracks. Based on these temperatures, cracks can be categorized into two main groups: hot and cold [10].
1.3.1 Cold cracking
These cracks usually occur in solid state near or at room temperature, in a state where no liquid film is in the weld. Excessive strain in the weld after cooling can also promote the formation of cold cracks. This is typically observed in welds of a very thick cross section with presence of a high temperature gradient during welding.
Figure 1-4 (a) and (b) show the typical locations of a cold crack in a weld and its heat affected zone (HAZ). Transverse cracks are typical of excessive strains in the thick cross section samples. Toe1 and underbead2 cracks usually occur in the weld heat affected zone. They are likely to be caused by a combination of excessive stress and a brittle HAZ [11].
Figure 1-4 : Cold cracks locations in (a) cross section and (b) surface of a weld (inspired from [10])
1 Where the base metal ties in to the weld metal along the weldment face. 2 In a weld HAZ under and adjacent to its fusion zone.
1.3.2 Hot cracking
Hot cracks form in the weld fusion zone and heat affected zone due to the formation of the liquid in the system at high temperatures [3]. In fact, during solidification where shrinkage stresses are induced in the weld by high cooling rate, hot cracks can initiate at different weld locations. Transverse, longitudinal and crater3 cracks are some examples of the hot cracking defects [11] shown in Figure 1-5 (a) and (b).
Figure 1-5 : Hot cracks in cross section (a) and surface (b) of a weld (inspired from [10]) Hot cracking generally occurs in two regions of a weld, both susceptible to the formation of liquid films:
The fusion zone (Solidification cracking susceptible region),
The partially melted region in heat affected zone (Liquation cracking susceptible region).
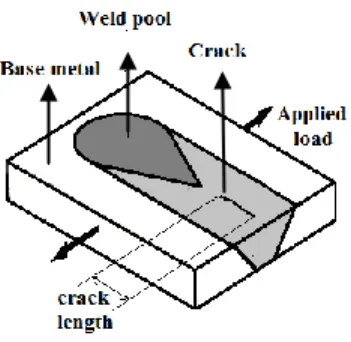
1.3.2.1 Solidification cracking
Many of the weld cracks formed during weld fusion are associated with boundaries and interfaces of alloys. Figure 1-6 (a) shows solidification of grain boundaries in the fusion zone which can affect susceptibility of an alloy to solidification cracking. During solidification, shrinkage strains are induced by phase transformation from liquid to solid and thermal contraction within the weld. At the same time, low melting point liquid films form along solidification grain boundaries. If the mushy zone4 ductility is inferior to these deformations, cracks initiate at the final stage of
3 The end of a welding pass where the weld pool is unfilled.
4 Solid-liquid region which forms during welding and trails behind the liquid weld pool.
solidification [4]. Figure 1-6 (b) shows the fusion zone and beginning of solidification. The figure also shows a solidification crack caused by the presence of shrinkage strains.
(a) (b)
Figure 1-6 : (a) Solidification grain boundaries in a weld metal [12]. (b) Formation of solidification cracking during welding process [13].
Generally, solidification temperature range is one of the major metallurgical factors affecting the susceptibility of the weld to solidification cracking. The temperature range directly affects the size of the mushy zone. At the beginning of the mushy zone, the temperature is equal to the liquidus temperature. On the other side, the end of the mushy zone intersects with the lower temperature of an alloy where the weld is completely solidified. Higher temperature ranges can induce larger volumes of the mushy zone, thus enhancing the susceptibility to solidification cracking [3].
1.3.2.2 HAZ cracking
In order to evaluate the base metal susceptibility to HAZ cracking, the resistance of a metal to the formation of liquation cracking should be studied. Liquation cracking happens when the hot ductility of a metal is lower than the high-temperature induced strains. The presence of liquid films
Solidification grain boundaries
Fusion zone
Beginning of solidification
Solidification cracking
Weld cross section Weld top view
W e ld ing d ir e ct io n
within the base metal during solidification is necessary to the formation of liquation cracks. The higher solidification temperature ranges can increase the presence of liquid films in base metal [3].
1.4 Weldability testing methods
The weldability of a material exhibits its resistance to crack formation, the more an alloy is weldable, the less cracks it is likely to form during welding.
In order to measure and compare the weldability of different materials, many testing methods have been developed. Those methods are usually used to quantify the HCS can be categorized into two groups of self-restrained and externally loaded tests.
In self-restrained tests, no load is externally applied to the samples and cracks are formed only by shrinkage strains during solidification. Cast pin tear test is an example of such a test [14].
In order to carry out an externally loaded test, samples which are usually machined into particular shapes are mechanically tested by applying external loads. With this method, it might be necessary to test specimens in a particular thermal-cycle. The transvarestraint, Sigmajig, U-type hot cracking and hot ductility tests are all examples of externally loaded tests that will be discussed in this section.
1.4.1 Modified cast pin tear test
In this test, a gas tungsten arc welding torch is used to melt small charges of material. A water cooled copper mold is then used as a recipient for the molten materials. In order to determine cracking susceptibility, different restraints can be generated by controlling the length of the molds (Figure 1-7). The longer pins can potentially create higher solidification restraint and lead to the formation of circumferential cracks on the outside of the pins (Figure 1-8). All the obtained information regarding the pin length and its associated circumferential cracking percent can be presented in a plot (Figure 1-9) [14].
Figure 1-7 : A mold of cast pin tear test [15]
Figure 1-8 : Locations of cracking in different cast pins shown by arrows [14]
Figure 1-9 : Results of modified cast pin test for different alloys [15]
Mo ld l eng th Head Foot
According to Figure 1-9, the most susceptible materials to solidification cracking are those where cracking occurs all around the diameter of the pin (100% circumferential cracking) at the shortest pin length [14, 15]. This test only verifies weld solidification cracking of materials with different chemistry. In fact, it is a quantitative test since no material properties are measured.
The cast pin tear test can only be used to determine solidification cracking susceptibility of a cast material. In fact, it is not a method that can be used to quantify the weldability of various welds. Basically, the welding process includes microstructural evolution within the welded area which may result in inhomogeneous mechanical properties in the weld, base metal and heat affected zone. This can promote residual shrinkage strain within these regions which affects the weldability of the material. Still, the cast pin tear test is considered as one of the simplest and less expensive methods. It is mainly used in studies that have aimed to obtain a general understanding of the susceptibility of a material to solidification cracking.
1.4.2 Varestraint test
Varestraint test was first developed by Savage and Lundin in 1960 to quantify HCS of materials [16]. This method is generally performed based on augmented strains rather than on metallurgical variables at the root cause of hot cracking. Figure 1-10 (a) shows a Varestraint testing machine with a welding ram, mandrel die and a testing sample. The movable welding ram produces a weld on the sample which is bent to get the shape of a mandrel. The increased strains generated by bending loads cause cracks to occur on the outer surface of the under welding sample (Figure 1-10 (c)). The most commonly used welding process for these tests is GTAW whose welds are usually autogenous[14].
Figure 1-10 : (a) A varestraint testing machine [17]. (b) The direction of welds relative to the applied augmented bending strain. (c) A schematic of the Varestraint testing machine showing
its different mandrel die radius (inspired from [18]).
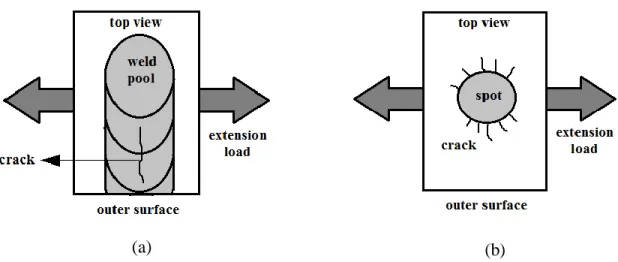
As it was partially explained, the Varestraint test rapidly applies bending strains that promote cracking on the outer surface of a sample. The relative direction of the applied strain and welding determines the susceptible region in which cracks occur. Based on this, the Varestraint test can be divided into three types of longitudinal, transverse and spot tests as shown in Figure 1-10 (b). In the longitudinal type, bending strains are applied along the length of the weld. This would promote cracking in both the fusion (solidification cracking) and heat affected zones (liquation cracking). In order to separately determine the susceptibility of these types of cracks, two other methods known as transverse and spot Varestraint tests can be used[14].
In the transverse test, bending strain is imposed perpendicularly to the weld and circumscribes most of the cracks in the fusion zone (Figure 1-11 (a)). Extension loads are perpendicular to the partially melted zone (the most susceptible region) causing longitudinal cracks in the fusion zone. In order to promote cracking in the heat affected zone, a spot Varestraint test was developed (Figure 1-11 (b)). This method involves bending a sample in which a small melted spot weld was created [3]. As Figure 1-11 (b) demonstrates, the extension load on the outer surface affects the partially melted zone surrounding the spot in the HAZ.
(a) (b) (c) T o p v ie w S ide v ie w
(a) (b)
Figure 1-11 : The stretched surface of two samples showing crack propagation in (a) transverse and (b) spot test.
1.4.2.1 Testing Procedure
The general procedure of Varestraint test can be described as follows:
Fix the specimen in a testing machine (Figure 1-10 (a)). It should be mentioned that the samples of 3mm thick or less are not recommended to be tested on with this method to avoid buckling during bending [3, 16]. Other samples dimensions, such as length and width, can be selected based on the capacity of the testing machine.
Produce weld on the specimen while welding pool temperature is measured by a thermocouple. It should be noted that the temperature is measured only if the purpose of a test is to determine brittle temperature range which is explained in this section.
Apply the bending strains to the specimen. Tension strains intensity on the specimen outer surface is controlled by the mandrel dies of different radiuses which is shown in Figure 1-10 (b).
Observe cracks by 25-40x magnification.
In order to get significant and accurate results, three to six tests are usually carried out for each strain level.
1.4.2.2 Evaluation of weldability
Different parameters have been used by researchers as indicators to evaluate the HCS by Varestraint test. All these indicators come from observations of cracks formed either in a weld or in the heat affected zone. For instance, the number of cracks, the maximum crack length, the total crack length and the average crack length are some of the measurements used to evaluate and compare materials HCS [6, 17-22]. For example, if comparing different alloys, it would help to determine which material contains the shortest crack length, and ultimately find the most weldable material.
In addition, the temperature range in which solidification cracking initiates and propagates may be measured. This is called the solidification cracking temperature range (SCTR) which can be obtained by measuring the maximum crack length and temperature course in a weld (Figure 1-12). In this regard, the temperature of the weld pool can be measured by a thermocouple. This can be used to plot time-temperature graph. Then, the longest crack in all tests is divided by the welding travel speed to get the time interval in which the crack occurred. Now, by merging the information of the weld pool time-temperature graph with the material’s solid temperature and cracking time interval, the temperature range in which a crack may develop in the mushy zone can be determined [19]. The wider this temperature range, the lowest weldability for a material is anticipated.
Figure 1-12 : The methodology through which temperature of liquid metal pool is monitored and SCTR is measured [19].
Solidus temperature
Cracking time interval SCTR
The general limitations of weldability testing with the Varestraint method can be described as follows:
This method is limited to specimens thicker than 3mm. Otherwise, buckling5 may occur during bending when the samples cannot perfectly get the shape of the mandrel.
Actual strain on the outer surface of the specimen is always different from the ideal value since the sample cannot perfectly take the shape of the mandrel block during bending. It causes different radius values between sample and die. Therefore, to get better estimation of actual applied strain, a correction factor may be required.
Varestraint test is an operator sensitive method since its final testing results is highly dependent on the operator’s decision on the number and length of cracks.
1.4.3 Sigmajig
Figure 1-13 shows schematic representation of a weldability testing system that was developed by Goodwin [23] in order to evaluate solidification cracking susceptibility of thin sheet metals (less than 0.25mm) [24]. Instead of taking measurements of cracks and/or determining the solidification temperature range, mechanical load frame of this test is used to measure the stress at which a crack initiates in a weld (Figure 1-14). This stress, called threshold stress σth, can be used to compare cracking susceptibility of different materials.
Figure 1-13 : Schematic of a Sigmajig testing fixture (inspired from [23]).
Figure 1-14 : Fusion zone crack induced by an external load in the Sigmajig test
1.4.3.1 Testing procedure
Small square shaped samples (50mm×50mm) are clamped between hardened steel grips (Figure 1-13).
Before loading, it may be verified that the gas tungsten arc facilities will produce a full penetration and teardrop-shaped weld in the samples [23]. It is important since it leads the cracks to concentrate on the weld centerline, therefore causing solidification cracking. Predetermined loads are applied to the sample and then measured through a pair of strain
gauges.
If no crack is observed, the load level is increased by 50lb per each 1-mm thickness of the sample. This process should be continued until cracking is visually observed in the sample [24, 25].
The minimum stress at which cracking occurs in the specimen is reported as the threshold stress.
When cracking occurred in the sample, additional tests must be conducted with 10lbs above and below the respective load in order to verify the threshold stress [24, 25].
1.4.3.2 Evaluation of weldability
As stated above, threshold stress in the Sigmajig test is used to evaluate the solidification cracking susceptibility of a material. In that regard, results are usually plotted based on cracking percentage versus applied stress. Figure 1-15 shows the diagrams of two different materials where cracking percentage increases with increasing stress until the point at which complete separation occurs. There are two important indications in this plot which show that the material 2 is more weldable
than the material 1. Firstly, cracking occurs at lower stress levels in material 1. Secondly, it exhibits a more gradual transition from the first occurred crack to the complete separation point (100% cracking).
Figure 1-15 : A typical Sigmajig testing diagram indicating that the material 2 is more weldable than the material 1 [14]
Generally, this method is designed to quantify SCS. In addition, since a testing specimen is subjected to a preload during the welding process, the Sigmajig method is limited to bead on welds therefore butt welds cannot be tested.
1.4.4 U-type hot cracking test
The U-type hot cracking tester was developed in Hiroshima University in order to quantify the SCS without using a mechanical load frame [26]. Since the Varestraint is not precise enough to determine local strain at trailing edge of the weld pool, this method can determine local strain in the vicinity of cracking lips during GTAW welding [27]. In fact, this setup can generate solidification cracking at the center line of a weld by applying an extension load transverse to welding direction of the sample. It should be noted that in a manner similar to those of the other weldability tests (Transvarestraint and Sigmajig), the load is applied to a specimen while welding. Then, through measuring the local critical strain at the crack initiation area, susceptibility to solidification cracking is determined. In order to determine the critical strain, two grains are taken as reference points using a high magnification microscope installed on the high speed camera for observation. The critical strain can be determined using the distance between reference points before and after the fracture.
This testing setup usually contains the following devices to evaluate the weldability of a metal: (1)
U-type hot cracking tester,
Laser autogenous welding equipment, High speed camera.
In Figure 1-16, a schematic of the U-type tester configuration is shown where a specimen can be fixed between the ends of two beams using chucking plates. If the beams are bent towards each other, the extension strain can be applied to the sample after it is fixed completely between them. This strain will promote solidification cracking in the sample during welding. In addition, a laser welding machine is generally used to produce autogenous welds [2].
Meanwhile, a high speed camera is used to record the process in which a crack forms in the sample. It is then possible to retrieve the recorded film to determine the critical strain in the cracking area [28]. Figure 1-17 shows the full setup of a U-type hot cracking test using a high speed camera and a laser welding machine. A metal halide lamp is also used to provide adequate light for better filming quality.
Figure 1-17 : U- type hot cracking test setup [28]
1.4.4.1 Testing procedure
Fixing the sample between the free end of one of the beams and the respective chucking plate.
Pushing two ends of the beam towards each other and at the same time fixing the other end of specimen to the free end of the second beam.
Welding the middle of the sample. In the case of evaluating solidification cracking, welding travel direction must be normal to the direction of extension strain (similar to Sigmajig and Transvarestraint methods in solidification cracking tests.)
Using the high speed camera to record process of crack formation which normally occurs behind the welding pool in the centerline of the weld.
Retrieving the film to measure displacement of the reference point (grains) to determine critical strain.
In the case of measuring brittle temperature range, a platinum thermocouple is used to measure temperature interval during which the critical crack occurs. The process is similar to the methods used to quantify SCTR in Varestraint test.
1.4.4.2 Evaluation of weldability
Figure 1-18 shows displacement of reference points when cracking occurs in the weld due to the applied strain. In the figure, d1 and d2 are the distance between the reference points, respectively before welding and after theformation of the crack. The difference between 𝑑1 and 𝑑2 is used to measure the critical strain at which a crack is initiated in the weld. Based on the results of this test, the materials which exhibit the lower level of critical strains are more susceptible to weld solidification cracking [2].
Figure 1-18 : Measurement of reference points displacement in a U-type hot cracking test With this method, the welding travel speed should be taken into consideration in the final analysis. In fact, different cracks can occur at various welding speeds within the weld and the HAZ. This phenomenon might make it necessary to conduct further observations in order to recognize a particular type of crack. Besides, it is impossible to apply constant strain on the specimen during the U-type jig since the applied strains decrease by increasing the bending radius of the beams. Moreover, because of the preload applied to a sample this method is limited to bead on welds.
1.4.5 Hot ductility test by Gleeble
Elevated temperature properties of a material such as hot strength or hot ductility6 can be used to evaluate its weldability. The typical machine used to test hot ductility properties of a material is Gleeble which is shown in Figure 1-19. This machine can mechanically test a sample at different temperatures over a thermal cycle [29].
Figure 1-19 : Hot ductility test by a Gleeble machine[29]
1.4.5.1 Thermal system
In a Gleeble test, samples are heated by a high electrical current that passes through them. As Figure 1-19 indicates, a sample is placed between two jaws which are connected to a high current circuit. The figure also shows a thermocouple which is welded to the center of the sample. It is used to monitor and control the temperature. Besides, to avoid the system from overheating, a chiller pumps water through the jaws.
Depending on the jaws’ material and the length of free span, temperature distribution over the sample will change. Figure 1-20 (a) shows parabolic temperature distribution over the length of a sample in which the highest temperature is at the center. For example, once compared to stainless steel jaws (hot jaw), it is found that copper jaws (cold jaw) result in a steeper curve because of their higher thermal conductivity [30].
6 Elongation of a sample subjected to a specific temperature and strain rate.
Figure 1-20 : (a) Heat distribution over a sample in the free span with the cold and hot jaws [30]. (b) The thermal schedule over which the samples are fractured at various target testing
temperatures
1.4.5.2 Mechanical System
The mechanical system of Gleeble is capable of applying tension to a sample along its center axis through jaws. One of the jaws is fixed and the other one is attached to a hydraulic ram whose movement can be monitored by stroke, force or strain. During the simulation of a thermal cycle, a mechanical system can apply controlled displacement or load to a sample at different temperatures (Figure 1-20 (b)) [31].
1.4.5.3 Thermal cycle simulation
The general purpose of this test is to characterize the ductility of a material at elevated temperatures. This can be used to quantify the hot cracking susceptibility of a material, usually presented as ductility versus temperature plots. Figure 1-21 indicates a typical hot ductility plot including on-heating and on-cooling curves. Over the on-on-heating tests, the material shows increasing ductility which dramatically drops to zero after the peak point. At this temperature, known as Nil Ductility Temperature (NDT), the material exhibits no ductility. Another point in this diagram is Nil Strength Temperature (NST), the temperature at which the material exhibits no strength.
(a) (b)
Target testing temperatures
Figure 1-21 : Typical on-cooling and on-heating ductility curves [14]
Further tests on on-cooling lead to the determination of the Ductility Recovery Temperature (DRT) point. In order to determine this temperature, a specimen is heated to NST and then cooled. During the cooling process, specimens are pulled to fracture at various temperatures. After different tests, a certain temperature is determined as the point at which the material starts to retrieve its strength. That point on the plot can be reported as DRT.
1.4.5.4 Testing procedure [14]
Testing sample should be machined into a standard geometry which can be fixed between the jaws.
Weld fusion zone is located in the center of the sample where the peak temperatures usually occurs.
On-heating tests are usually carried out by a heating rate of about 111ºC/sec and pulling the sample at different desired testing temperatures by a stroke rate of 50mm/sec.
NST can be determined by heating at a rate of 111ºC/sec while a constant tension stress is applied to fracture a sample.
For the on-cooling tests, samples are heated at the rate of around 111ºC/sec up to a peak temperature and then cooled at a rate of almost 50ºC/sec. During cooling process samples are fractured at 25℃ interval with the stroke rate of 50mm/sec.
Dimensions of fracture area are then measured to determine the ductility of samples based on the reduction area.
1.4.5.5 Evaluation of weldability
Hot ductility curves provide valuable information on a material’s weldability. The temperatures of NDT, NST and DRT can define crack susceptible regions. For example, the difference between two temperatures of NST and DRT indicates the temperature range over which grain boundary liquid films are presented in the material. The wider the temperature range, the higher the susceptibility to hot cracking in the HAZ can be predicted for a material [3, 6, 32]. However, the more exact way to predict this is by comparing hot ductility curves. The on-cooling curves are more important since hot cracks usually occur during cooling process. One of the methods is to quantify the rate at which a material retain its ductility. The faster a ductility recovers, the less susceptible it is to form a hot crack.
In general, the first limitation of this test is the application of high heating and cooling rate, which may alter the properties of the materials and especially those which encounter microstructural evolution at high heating or cooling rates. In addition, Gleeble is an expensive multipurpose thermal-mechanical simulator that is used not only for weldability tests but also in a wide variety of applications ranging from physical simulation such as hot rolling of steel and aluminum to research into high temperature performance of metal alloys for jet engines. Therefore, if weldability evaluation is the only purpose of a research, the investment is not reasonable; this will be detailed in the next chapter.
1.5 Conclusion
As explained in the literature review section, externally loaded testing methods are better to control the testing procedure and to provide more precise measurements of weldability. In addition, they can be more precise in measurements aimed to study the effects of different welding parameters on the weldability. For example, in the Varestraint, Sigmajig and U-type hot cracking tests, weldability of different welding parameters can be directly quantified, whereas in the hot ductility tests by Gleeble different welding parameters are indirectly simulated on a specimen. Therefore, externally loaded testing methods seem more likely to fulfill the expectations required to achieve the main objective of the current study. However, more analysis should be made in terms of capability of the systems to meet requirements of the project.
ANALYZING THE EXISTING WELDABILITY TESTING
METHODS
In this chapter, more detailed analysis will be made on the weldability testing methods in terms of their capability to meet the requirements of the current project. The results of analysis will then be used to find the best method to achieve the project goal which is “developing a cost effective weldability testing system to quantify HCS of pre-welded IN718 samples”.
To achieve the goal, the weldability testing system must exhibit the following capabilities and specifications:
1st: Quantifying the hot cracking susceptibility of thin pre-welded samples.
2nd: Measuring the weldability of welds produced by changing the welding parameters. 3rd: Necessitating low monetary investment (less than 25000$) and reasonable testing time.
2.1 Quantifying hot cracking susceptibility of a thin pre-welded
sample
If the purpose of this study is to understand how different weld microstructures can influence cracking susceptibly, a testing method needs to be sensitive enough to determine small variations of HCS.
The cast pin tear test is a method to evaluate the weldability of a material’s chemistry rather than of a welded microstructure.
The Varestraint, Sigmajig and U-type hot cracking methods consist of breaking a sample while welding and are not designed to test a pre-welded sample.
Gleeble can be used to test pre-welded samples since it is capable of simulating actual welding conditions in the welded area.
2.2 Measuring the weldability of welds produced by different welding
parameters
With the Varestraint and Sigmajig tests, the effects of different welding parameters on a material’s weldability can be directly tested. The control allowed on the direction of the applied stress or strain can determine and ensure the occurrence of a crack whether in the fusion or the heat affected zone.
Different welding parameters can be indirectly tested by Gleeble. The machine can be programed to simulate and test different welds produced by various welding parameters, such as heat input and welding travel speed.
2.3 Testing time and cost
In order to get an estimation of the required budget to conduct the mentioned weldability testing methods, the total testing cost is assessed based on the required equipment and the total testing time.
2.3.1 Required equipment and specimen preparation
In this part, direct and indirect cost of different externally loaded test will be analyzed. The overall cost of each method was estimated based on the required testing equipment and the sample preparation. Table 2-2 contains the information on the sample preparation and the major equipment required for different tests.
In order to fix samples between two jaws of the Gleeble machine, samples needs to be machined into specific geometries (threaded end rod samples or pin holes made at two ends of samples) [33], whereas the other tests use simple square or rectangular shape samples. Consequently, samples with more complex geometries are more expensive and may increase the machining cost.
Concerning the required equipment to carry out a weldability test, the U-type testing method uses more equipment and devices than Varestraint and Sigmajig tests, which makes the testing procedure more complex and expensive. The Gleeble machine, being a multipurpose thermal-mechanical physical simulator, is considered as the most expensive method for weldability tests. Table 2-1 includes an approximate range of testing costs for each method.
Table 2-1 : Required samples and equipment in externally loaded methods
Type of test Varestraint Sigmajig U-type
Hot ductility
with Gleeble
Crack type Solidification and liquation Solidification Solidification and
liquation
Solidification and liquation
Sample geometry
Shape Rectangular Square Rectangular
Rod or Rectangular with complex geometry Thickness > 3𝑚𝑚𝑎 > 0.25𝑚𝑚𝑎 > 0.25𝑚𝑚𝑎 NS𝑏 Width & length Flexible 𝑐 50 × 50𝑚𝑚 NS𝑏 Rod length is usually 100mm but the others are
Flexible𝑐 Equipment Welding or welding simulator Autogenous welding machine Autogenous welding machine Autogenous laser welding machine Electrical resistance heater Water cooled quenching system Mechanical
testing Bending machine𝑑
Testing jig𝑓 U-type jig Servo-mechanical
testing system Measureme nt process Thermometer 𝑓 Microscope Microscope
High speed camera
Thermometer 𝑓 Any device to measure reduced cross section or elongation
Approximate testing cost $30K-$40K $30K-$40K $40K-$50K $500K-$1M a: upper range is limited by capability of testing machine
b: not specified and generally depends on machine’s limitations c: restricted by machine’s maximum capabilities
d: with different mandrels of various radius e: capable of applying different loads
f: not necessary only if the brittle temperature range is of interest
2.3.2 Required testing time
The required time to complete the weldability tests is analyzed based on the required time (1) to setup a system and make that ready for a test and (2) analyze its final results. Table 2-2 compares the required time at each step of different weldability tests.
Gleeble has the simplest procedure to conduct a test since all of the required equipment is gathered in a single machine. All of the testing parameters such as heating rate, cooling rate and stroke rate can be programmed and automatically applied in a testing procedure. Further analysis is only needed to measure a reduced cross section or the elongation of a sample after fracture.
In the Varestraint and Sigmajig tests, most of the required time for initial setup is spent on pre-adjustments of the welding machine to ensure that appropriate welding speed and depth are achieved. The U-type test has more measurement equipment, like a high recording speed camera, which increases the required setup time.
Because of the application of a high speed camera in the U-type test, the final analysis of the fractured sample is relatively fast and simple. In all other tests, further time consuming processes are required for the observation and inspection of fractured samples to make measurement of cracks or cross section.
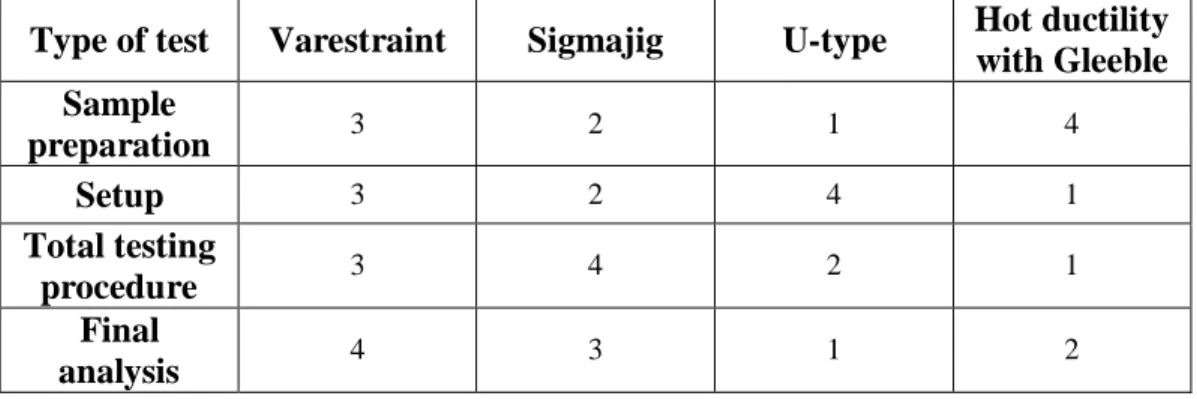
Table 2-2 : Required time for each step at different weldability methods, valued from 1 (lowest) to 4 (highest)
Type of test Varestraint Sigmajig U-type Hot ductility
with Gleeble Sample preparation 3 2 1 4 Setup 3 2 4 1 Total testing procedure 3 4 2 1 Final analysis 4 3 1 2
2.4 Conclusion
The design and development process of the weldability testing system of the current study is followed through a systematic engineering design approach [34]. Table 2-3 shows the first stage of this procedure.
After identifying the project’s requirements and clarifying the overall task, background research was carried out on different weldability testing methods. This step has been achieved by analyzing said methods to find possible solutions for existing problems. At this stage a check list, as shown in Table 2-3, was prepared to compare the capability of each method to achieve the objectives of the present project.
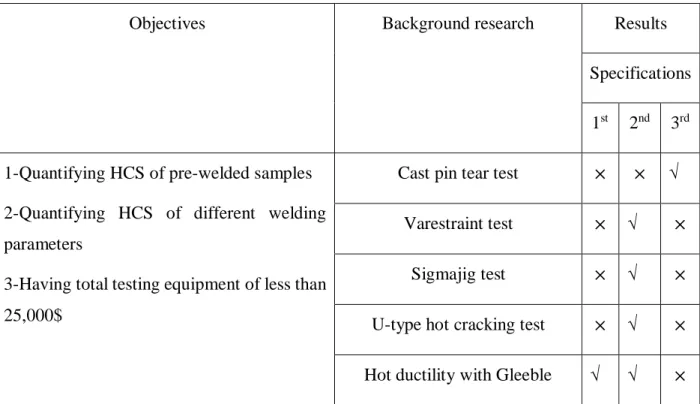
Table 2-3 : The procedure followed to find the potential research problems
Objectives Background research Results
Specifications 1st 2nd 3rd 1-Quantifying HCS of pre-welded samples
2-Quantifying HCS of different welding parameters
3-Having total testing equipment of less than 25,000$
Cast pin tear test × × √
Varestraint test × √ ×
Sigmajig test × √ ×
U-type hot cracking test × √ × Hot ductility with Gleeble √ √ × Therefore, it can be concluded that the hot ductility test with Gleeble is the method with the highest number of potential solutions for the existing problems. Despite the machine being too expensive, it is the best candidate for the weldability testing of a thin pre-welded sample among all of the other analyzed methods.
It has now been evaluated that it is worthy to design and customize a weldability testing system to quantify the weldability of different weld microstructures at the lowest possible price.
DESIGN METHODOLOGY AND CHALLENGES
In chapter 2, the analysis of the existing solutions showed that the hot ductility test is the best option to determine the weldability of pre-welded samples. In the design and development process of the system, two important factors need to be considered: price and precision. The system should be developed at the lowest possible price but should remain precise enough to determine the HCS of different microstructures. After the goals were set, a systematic approach [34] was used to achieve them. Firstly, the required specifications of the hot ductility testing system were identified. Secondly, the specific problems and millstones hindering the achievement of the project’s objectives were clarified. This was followed by the identification and analysis of the possible solutions for the existing problems. The third and final step consisted of selecting the best equipment possible based on the advantages and limitations of each solution.
As explained in Chapter 1, a hot ductility testing system should possess the following capacities to quantify the HCS of a weld.
Capacity of:
1) producing a welding thermal cycle 2) mechanically testing samples 3) precisely measuring ductility
In addition, the total cost of the system should be less than 25000$. Thus, the total cost of equipment for the system should stay within the defined budget by the client.
3.1 Producing a welding thermal cycle
One of the required specifications of a hot ductility testing system is its capability to simulate a welding thermal cycle. Thus, it must be equipped of a heating and/or cooling system in order to produce the high heating and cooling rate.
3.1.1 Heater
During on-heating or on-cooling tests, the sample is fractured at a target temperature after having experienced a predetermined thermal cycle. Since the application of these thermal cycles is to simulate the actual welding conditions, the approximate heating rate of the welding process should
![Figure 1-1 : Stress-rupture behavior of three classes of superalloys [7] 1.2 Welding of superalloys](https://thumb-eu.123doks.com/thumbv2/123doknet/2330137.31498/23.918.229.696.112.498/figure-stress-rupture-behavior-classes-superalloys-welding-superalloys.webp)
![Figure 1-2 : GTAW system [8]](https://thumb-eu.123doks.com/thumbv2/123doknet/2330137.31498/24.918.167.691.113.413/figure-gtaw-system.webp)
![Figure 1-5 : Hot cracks in cross section (a) and surface (b) of a weld (inspired from [10]) Hot cracking generally occurs in two regions of a weld, both susceptible to the formation of liquid films:](https://thumb-eu.123doks.com/thumbv2/123doknet/2330137.31498/26.918.124.829.328.480/figure-section-inspired-cracking-generally-regions-susceptible-formation.webp)
![Figure 1-9 : Results of modified cast pin test for different alloys [15]](https://thumb-eu.123doks.com/thumbv2/123doknet/2330137.31498/29.918.237.696.726.966/figure-results-modified-cast-pin-test-different-alloys.webp)
![Figure 1-15 : A typical Sigmajig testing diagram indicating that the material 2 is more weldable than the material 1 [14]](https://thumb-eu.123doks.com/thumbv2/123doknet/2330137.31498/36.918.371.605.212.424/figure-typical-sigmajig-testing-indicating-material-weldable-material.webp)
![Figure 1-20 : (a) Heat distribution over a sample in the free span with the cold and hot jaws [30]](https://thumb-eu.123doks.com/thumbv2/123doknet/2330137.31498/41.918.222.704.114.378/figure-heat-distribution-sample-free-span-cold-jaws.webp)