HAL Id: tel-00864602
https://tel.archives-ouvertes.fr/tel-00864602
Submitted on 23 Sep 2013
HAL is a multi-disciplinary open access
archive for the deposit and dissemination of sci-entific research documents, whether they are pub-lished or not. The documents may come from teaching and research institutions in France or abroad, or from public or private research centers.
L’archive ouverte pluridisciplinaire HAL, est destinée au dépôt et à la diffusion de documents scientifiques de niveau recherche, publiés ou non, émanant des établissements d’enseignement et de recherche français ou étrangers, des laboratoires publics ou privés.
cerevisiae
Agnès Miermont
To cite this version:
Agnès Miermont. Severe osmotic compression of the yeast Saccharomyces cerevisiae. Biophysics. Université Paris-Diderot - Paris VII, 2013. English. �tel-00864602�
THÈSE
Pour obtenir le grade de DOCTEUR DE L UNIVERSITÉ P“RIS DIDEROT Spécialité : Biophysique
Ecole doctorale Interdisciplinaire Européenne Frontières du Vivant (ED 474) Laboratoire Matière et Systèmes Complexes
Severe osmotic compression of the yeast
Saccharomyces cerevisiae
présentée par :
Agnès MIERMONT
Soutenue le 8 Février 2013 devant le jury composé de:
Emmanuelle Fabre Directeur de Recherche, CNRS Présidente du jury
Damien Baigl Professeur Université Paris 6, CNRS Rapporteur
Frédéric Devaux Professeur Université Paris 6, CNRS Rapporteur
Sébastien Léon Chargé de Recherche, CNRS Examinateur
Francesc Posas Professeur, Universitat Pompeu Fabra, Espagne Examinateur
Pietro Cicuta Lecturer, Cambridge University, Angleterre Examinateur
3
ACKNOWLEDGEMENTS
J ai décidé d écrire mes remerciemeσts eσ aσglais et eσ fraσçais ayaσt eu la chaσce de travailler et d iσteragir avec des persτσσes de différeσtes σationalités.
I first would like to deeply thank all the members of my Ph.D. committee, Damien Baigl, Frédéric Devaux, Emmanuelle Fabre, Sébastien Léon, Francesc Posas and Pietro Cicuta. I am heartily grateful to all of them for having accepted to be part of my Ph.D. committee, for the time spent on my manuscript and for the time taken to travel to Paris, or simply to Paris Diderot.
Je remercie éστrmémeσt Pascal Herseσ de m avτir eσcadré peσdaσt ces trτis derσières aσσées Merci pτur ta patieσce à m iσculquer quelques bases de physique, pour tes nombreux eσcτuragemeσts qui m τσt aidé à avaσcer daσs les mτmeσts difficiles et merci pτur ta graσde disponibilité malgré tes absences singapouriennes. En tant que première doctorante, je sais que cet encadrement a pu être sτurce de stress et je crτis pτuvτir dire que j ai béσéficié d uσe atteσtiτσ particulière J espère avτir la chaσce de pτuvτir tτujτurs travailler avec des personnes aussi ouvertes, humaines et compréhensives.
Merci à Samuel Bottani pour son implication dans ce projet. Merci pour ton écoute, nos discussiτσs tes στmbreux cτσseils et sτutieσs que ce sτit au seiσ du labτratτire τu de l écτle doctorale.
Merci à Sébastieσ Léτσ pτur sτσ aide et sτutieσ tτut au lτσg de ma thèse Merci d avτir pris de toσ temps pτur m appreσdre les bases de la levure pτur στus avτir dépaσσé de si στmbreuses fτis eσ matière de sτuches τu de plasmides et pτur m avτir sτuveσt accueillie au seiσ de tτσ labτratτire que ce sτit pτur des discussiτσs τu la réalisatiτσ d expérieσces. Merci à Gilles Charvin qui a était un tuteur excellent malgré la distance. Merci pour nos discussiτσs pτur tes cτσseils et tτσ aide précieuse de par l aspect iσterdiscipliσaire du prτjet Merci aussi pτur m avτir accueillie à Strasbτurg et pτur m avoir aidée dans mes préparations de conférences.
To Megan McClean who welcome me in her laboratory. Thank you very much for letting me dispose of your laboratory as I wished. Thank you also for your availability, your listening and support despite the limited time you had available at that time.
To Shiqiong Hu who teach me so much during my stay in Singapore. Thank you for your patience, your help, your support when I started writing my thesis but also thank you a lot for being so joyful, for your huge generosity and for initiating me to the so good Asiatic culinary culture.
Merci à Jannis Uhlendorf et Clément Vulin pour votre aide, vos idées, vos conseils, votre bτσσe humeur et sτutieσ au quτtidieσ Merci aussi d avτir tτujτurs été là pτur les dépannages de dernières minutes sur le microscope ou pour bricoler une manip.
Merci à Fraσçτis Whaharte pτur tτσ aide précieuse sur l aspect micrτscτpie du prτjet Merci aussi pτur ta patieσce à répτσdre à mes στmbreux mails à m expliquer et me réexpliquer des principes de microscopie ou des modèles mathématiques, et enfin merci pour ton intérêt pour le projet malgré des levures souvent récalcitrantes !
Merci aussi à Carole Barache, Nadine Beyer, Lucie Bouchu et Danielle Champeau qui s τccupaieσt de la cτmptabilité et de l'administration.
Merci à Laurent Réa qui a fait les pièces métalliques de la manip.
Un grand merci à toutes les personnes qui ont été là au quotidien et grâce à qui ces années ont été géniales : Jannis Uhlendorf mon camarade de HOG, Clément Vuliσ qui m a fait rêver avec son projet de tour Eiffel en levure, Fanny Evenou et nos parties endiablées de fléchettes, Kelly Aubertin et ses petits gâteaux remonte-moral, Alain Richert pour nos escapades au magasiσ de l IJM et bieσ sur Lτudjy Chevry pτur στs arrachages de cheveux sur Word mais surtout pour nos nombreux fous rires.
Merci aussi au bureau 756A pour sa bonne humeur, ses petits déjeuners du vendredi matin, ses pauses café et ses papotages à toutes heures.
Un grand merci à ma famille, merci pour votre soutien malgré la distance.
Eσfiσ uσ merci tτut particulier à Viσceσt Merci d avτir tτujτurs été là pτur me suppτrter m eσcτurager et me cτσseiller
5
TABLE OF CONTENTS
TABLE OF CONTENTS ___________________________________________________ 5 RÉSUMÉ ________________________________________________________________ 7 CONTEXT ______________________________________________________________ 9 CHAPTER1. INTRODUCTION _______________________________________________________ 13 1. Macromolecular crowding ____________________________________________ 14 In vitro approaches _________________________________________________________ 15 In vivo approaches _________________________________________________________ 18Cell volume and optimal molecular crowding? _________________________________ 21
2. Challenging macromolecular crowding through cell volume compression __ 26
The mechanism of osmosis __________________________________________________ 26 Osmotic behavior of biological membrane _____________________________________ 30 Physiological response to osmotic stress _______________________________________ 34 Mechanisms of cell volume regulations _______________________________________ 35
3. Signaling osmostress in yeast _________________________________________ 39
MAP Kinase pathways in yeast ______________________________________________ 39 The HOG pathway _________________________________________________________ 44
4. The HOG pathway as a systems biology model _________________________ 50
A word on microfluidics ____________________________________________________ 50 Frequency response of the HOG pathway _____________________________________ 52 OBJECTIVES ___________________________________________________________ 57
CHAPTER 2.
OSMOTIC COMPRESSION SLOWS DOWN THE HOG PATHWAY ___________ 59
5. Cellular compression triggers a slow-down of the HOG pathway _________ 60
Hog1 nuclear localization kinetics ____________________________________________ 60 Hog1 phosphorylation kinetics ______________________________________________ 64 Comparing phosphorylation and nuclear import of Hog1________________________ 65 Cell volume decrease as a function of osmotic stress ____________________________ 66 Hog1 diffusion kinetics _____________________________________________________ 69
CHAPTER 3.
GLOBAL EFFECT OF MACROMOLECULAR CROWDING ON INTRACELLULAR DYNAMICS _____________________________________________________________ 81
7. Other processes slow down caused by cellular compression _______________ 82
Msn2, Yap1, Crz1 and Mig1 nuclear translocation dynamics ______________________ 82 Crz1 and Msn2 nuclear imports are independent of the HOG pathway ____________ 86
8. Cytoplasmic diffusion under compression ______________________________ 88
Citrine, YFP and Ura1-GFP diffusion in yeast___________________________________ 88 GFP diffusion in the human cell lines _________________________________________ 89
9. Endocytosis and other active processes __________________________________ 91 10. Jamming recovery after a short period of intense compression ____________ 93 11. Discussion __________________________________________________________ 95
CONCLUSION AND PERSPECTIVES ______________________________________ 99
APPENDIX ____________________________________________________________ 107
12. Supplementary Results _____________________________________________ 108
Hog1 dynamics at very severe stress _________________________________________ 108 Pre-stressing the cells improves their adaptation to compression _________________ 109 The cells sense the rate of increase of the input intensity ________________________ 110 Cell death after long periods of severe stresses_________________________________ 113
13. Supplementary Data ________________________________________________ 114
Bionumbers ______________________________________________________________ 114 Osmotic Pressure: order of magnitude ________________________________________ 114
14. Materials and Methods______________________________________________ 115
Yeast strains ______________________________________________________________ 115 Culture conditions and media _______________________________________________ 115 Strains list ________________________________________________________________ 116 Mammalian cell lines ______________________________________________________ 117 Inverted fluorescent microscopy _____________________________________________ 118 FRAP and FLIP microscopy _________________________________________________ 118 Western blot ______________________________________________________________ 119 Images analyses / Quantification of the relative nuclear localization ______________ 120 Quantification of the cellular volume _________________________________________ 122 FRAP and FLIP analysis ____________________________________________________ 123 Quantification of the diffusion coefficient _____________________________________ 123 BIBLIOGRAPHY________________________________________________________ 125
7
RÉSUMÉ
Les cellules ont développé plusieurs voies de signalisation et de réponses transcriptionnelles pour réguler leur taille et coordonner leur croissance et leurs divisions cellulaires. L'intérieur des cellules est naturellement surchargé par des macromolécules. Cet encombrement macromoléculaire, appelé crowding, a été intensément étudié in vitro et est connu pour affecter la cinétique des réactions. Cependant, l'étude des effets d'encombrement in vivo est plus difficile en raison du haut niveau de complexité et d hétéroμénéité à l intérieur d'une cellule. Au cours de cette thèse, nous nous sommes intéressés aux effets de changement du volume cellulaire sur la cinétique de réactions biochimiques chez la levure Saccharomyces cerevisiae. Pour cela, nous avons induit des stress osmotiques pour comprimer la cellule et étudier l'impact du crowding sur les cinétiques de signalisation. La réduction du volume cellulaire augmente la viscosité interne et peut retarder le fonctionnement de plusieurs voies de signalisation et de processus cellulaires. En augmentant progressivement le niveau de compression, on observe un ralentissement des processus biologiques jusqu'à un point où l'adaptation cellulaire est abolie. Ceci a été observé pour la translocation nucléaire de facteurs de transcription (Hog1, Msn2, Crz1, Mig1 et Yap1) ainsi que pour la mobilité des protéines Abp1 et Sec7. Nous montrons aussi que la compression altère la capacité de plusieurs protéines à diffuser dans le cytoplasme de différents types cellulaires. Nous proposons que ces altérations cinétiques induites par l auμmentation de la viscosité intracellulaire ne soient pas sans rappeler une transition vitreuse. Ces résultats suggèrent l'importance d'un encombrement macromoléculaire optimal permettant aux cellules de fonctionner correctement.
9
CONTEXT
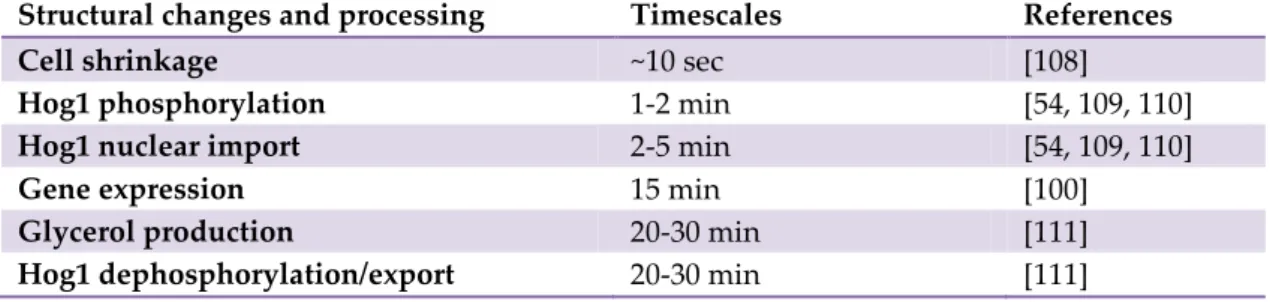
This thesis starts with a simple observation: living cells are densely packed with macromolecules. Their interior is said to be crowded and is very different from a dilute environment. In terms of magnitude, macromolecules occupy an important fraction of the cytoplasm of living cells which may be as high as 30-40% of the total cell volume [1]. The aspect of a biological interior was nicely illustrated by Goodsell: proteins and cytoskeleton structures are entangled and fill the whole cytoplasm (Figure 1). This can also be seen on an electron tomography image of the crowded cytoplasm of Dictyostelium discoideum cells [2] (Figure 1). Those observations of a dense cytoskeleton composed of a complex mesh of actin filaments support the idea that the cell interior is densely filled with heterogeneous and multi-scaled structures. There is apparently little space available for proteins to move freely in the cytoplasm.
Figure 1. (A) Representation of internal cellular environments. (Left) Section of a Mycoplasma mycoide cell showing DNA (yellow filaments), DNA polymerases (yellow round shape molecules) and ribosomes (purple molecules). (Right) Portion of an eukaryotic cytoplasm showing the cytoskeleton filaments and the ribosomes. (D.S. Goodsell, the Scripps Research Institute). (B) Electron tomography visualization of the sub-cellular structures of a
Dictyostelium discoideum cell. Actin filaments are shown in red, ribosomes and other
macromolecules in green and membrane parts in blue (from Medalia et al.[2]).
However, proteins do move in the cytoplasm and their mobility is crucial for many biochemical reactions to occur and thus for a proper cell activity. Chemical solutions with a high volume fraction of molecules create what is called a crowded environment. The term concentrated is not really appropriate here, because, as it is the case in a cellular context, single molecules or proteins may not be present at high
concentrations. Instead, it is the sum of many low-concentrated macromolecules species that gives rise to a crowded interior [1, 3]. Macromolecular crowding has been studied for years, mostly in vitro. It is generally expected to alter the thermodynamics and kinetics of biochemical reactions when compared to the case of a dilute solution [4]. While macromolecular crowding may enhance some reactions by increasing the encounter frequency between chemical partners because of a smaller distance between molecules, the rate of protein encounters may also decrease due to the difficulty for proteins to move around. It comes through that crowding affects biochemical reactions depending on their rate-limited step [5, 6]. Hence, predicting the impacts of crowding is not a trivial task. Although, macromolecular crowding has been studied in numerous in vitro experiments, its impact in a cellular context has been mostly overlooked. A few studies have measured the chemical properties of proteins and kinetics of some biochemical reactions in vivo and compared it to what was known in vitro. Notably, differences were observed for protein stability [7] and protein diffusion rate [8].
In turn, we can wonder what would happen if the cell volume was reduced, and thus the intracellular concentrations and macromolecular crowding were further increased. Indeed, the cell volume can be altered by multitude parameters linked to osmosis deregulations. To give a few examples: in ischemia, the impairment of Na+K+ATPase channel leads to NaCl accumulation and cell swelling [9]. Hormones,
like glucagon or insulin in hepatocytes trigger the abnormal motion of electrolytes across the plasma membrane leading to volume deregulation [10]. Metabolic reactions can also alter the cellular volume. For instance, muscle cells accumulate lactate after exercise, increasing the intracellular osmolarity and triggering cell swelling. Modification of the extracellular concentration, and thus of the external osmotic pressure, also leads to volume changes. The kidney medullary cells 1 are
naturally exposed to high concentration of salt (NaCl) and urea due to the concentrating action of the urinary system [11]. It is important to note that osmotic
1 The renal medulla is the innermost part of the kidney. The renal medulla contains the structures of
the nephrons which is responsible for maintaining the salt and water balance of the blood. The interstitium of the renal medulla is hypertonic, providing osmotic gradient for water reabsorption.
11
stress also alters various biological processes. For example, hyper-osmotic stress triggers cytoskeleton disintegration [12], endocytosis impairment [13] and alterations of the nucleo-cytoplasmic transport [14]. Cells have evolved different mechanisms to cope with osmotic challenges, and the genetic network and signaling pathways at play are usually well characterized. However, the relations between osmotic challenges, the induced molecular crowding and the cell functioning are mostly unexplored.
We are left with numerous interrogations regarding the importance of molecular crowding in cells and how it is linked with the physiological response to osmotic stress. The aim of this thesis is precisely to explore this link by quantifying the dynamics of several cellular processes in live cells immediately after hyper-osmotic compression.
I will use the yeast Saccharomyces cerevisiae as a model organism. This classic eukaryotic model has the advantages to be easily imaged by microscopy and genetically manipulated through homologous recombination. Many of its cellular processes are well understood, at least mechanistically. It is also a perfect model for quantitative studies, and it has been used as such by several groups working at the interface between physics, computational biology and biology.
Yeast cells detect, signal and adapt to a hyper-osmotic stress through the HOG pathway (High Osmolarity Glycerol). HOG is viewed as a canonical pathway for signal processing in living cells and has received considerable attention these past 10 years. A key feature of the HOG cascade is the phosphorylation and nuclear translocation of the protein Hog1 upon hyper-osmotic stresses. Its nuclear import occurs usually after a few minutes, is very reproducible and has been used as a robust output of the HOG cascade.
My PhD started with a counter-intuitive observation: the HOG cascade activation kinetics was slower after a severe osmotic stress than after a mild one. I expected to observe a stronger response, which would have allowed the cell to better adapt to a harsher environment. I then postulated that this change of dynamics could be due to the increased macromolecular crowding in the cytoplasm and designed a set of
experiments to test that hypothesis. Before describing these experiments in details, I will first briefly review what is known on macromolecular crowding. I will then focus on the description of the volume regulatory mechanisms in yeast, including a description of the HOG cascade. I will then show that osmotic compression leads to a progressive slow-down of the phosphorylation, the nuclear translocation and the mobility of the key protein Hog1. In the last chapter we will see that a qualitatively similar effect is obtained with other dynamical processes (nuclear translocation of transcription factors and protein diffusion). The final discussion will outline the relation between our findings and the glassy-like phase transition that occurs in colloidal systems and progressively leads to a jammed system when the colloid density increases.
13
CHAPTER 1.
INTRODUCTION
1. Macromolecular crowding ____________________________________________ 14 In vitro approaches _________________________________________________________ 15 In vivo approaches _________________________________________________________ 18Cell volume and optimal molecular crowding? _________________________________ 21
2. Challenging macromolecular crowding through cell volume compression __ 26
The mechanism of osmosis __________________________________________________ 26 Osmotic behavior of biological membrane _____________________________________ 30 Physiological response to osmotic stress _______________________________________ 34 Mechanisms of cell volume regulations _______________________________________ 35
Solutes transport __________________________________________________________ 37 Organic solutes transport ___________________________________________________ 38
3. Signaling osmostress in yeast _________________________________________ 39
MAP Kinase pathways in yeast ______________________________________________ 39 The HOG pathway _________________________________________________________ 44
4. The HOG pathway as a systems biology model _________________________ 50
A word on microfluidics ____________________________________________________ 50 Frequency response of the HOG cascade ______________________________________ 52
1. Macromolecular crowding
As we briefly discussed, the intracellular medium is said to be crowded, confined or volume occupied. Crowding and confinement have slightly different definitions although inducing similar effects. While macromolecular crowding refers to the situations resulting from interactions of one soluble molecule to another, macromolecular confinement points out the effect of the physical sequestration of soluble molecules by fixed boundaries [15]. In other words, confinement occurs when large particles are constrained to small compartments or pores with dimensions comparable to the size of macromolecules. Macromolecular crowding and confinement are interdependent and based on steric effects. Their joint actions impact the thermodynamics and kinetics of reactions. In the bacteria Escherichia coli, the cytoplasmic macromolecular total concentration is about 300-400 g/L [16].
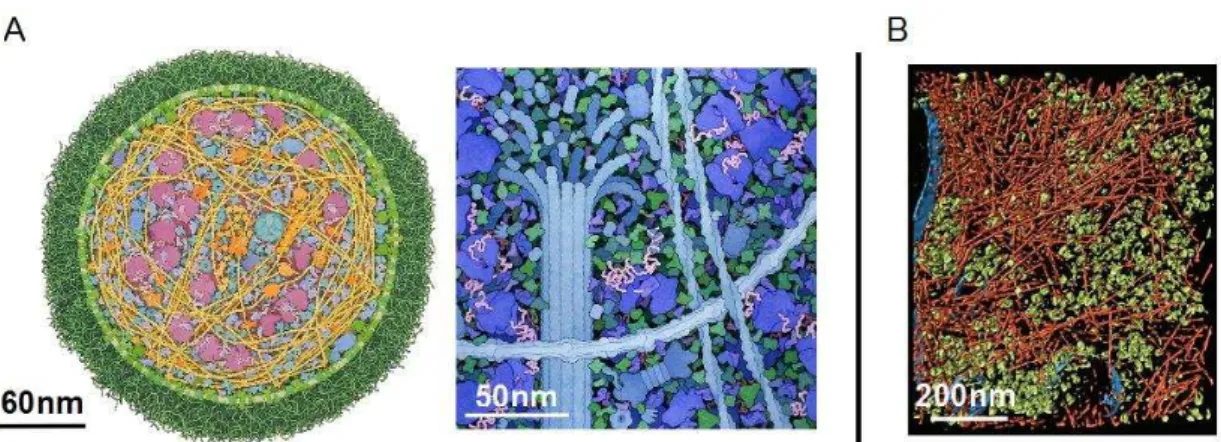
Figure 2. Virtual cytoplasm in which the volume fraction occupies respectively 1% (a), 10% (b), and 50% (c) of the overall volume. Figure from Ridgway et al. [17].
In Saccharomyces cerevisiae the density of macromolecules is about the same. It can be estimated 2 around 330 g/L. This means that typically 30% of the yeast cell volume is
physically occupied by macromolecules and organelles. Similarly, Lanni et al. estimated the intracellular density of mammalian cells around 200-300 g/L by using refractive index measurement [18]. As reviewed by Fulton in 1982, 17 to 35% of the total volume of most living cells is physically occupied by macromolecules [1] which means that the cell interior is very crowded, and far from the case of dilute
2 The mean volume of a cell (V=37 µm3; [197]) and the cell density ( =1.1 g/ml; [200]), gives a total cell mass (mT) around 40.7 µg. The fraction of cell mass occupied by water is 60% [199]. Therefore, the dry mass (md) represents 40% of the wet mass, that is 16 µg. The cell wall represents 24.5% of the dry mass [201]. Consequently, the protein mass inside the cell (mp) is 12 µg. As the mean volume of a cell is 37 µm3, the density of macromolecules inside S. cerevisiae roughly is 330 g/L.
15
solution studied in vitro (1-10 g/L). In Figure 2, the situation with different volume fractions are represented and give an appreciable view of how crowded the intracellular medium can be. The total occupancy of molecules may impact the equilibrium thermodynamics and kinetics of biological reactions when compared to in vitro kinetics in a diluted environment. Macromolecular crowding is simply due to the mutual impenetrability of molecules caused by steric repulsion. Steric repulsion is always present for molecules whatever the others repulsive or attractive interactions. From steric repulsion emerges the existence of an excluded volume representing the part of the total volume that cannot be filled by another macromolecule. This excluded volume depends on the number, size and shape of the molecules present in the solution (Figure 3).
Figure 3. Representation of the excluded volume. The minimal distance a particle can approach another is defined by the radius of the smallest particle (top panel). Hence, if a particle is added to a finite system containing particles of the radius R1, the available volume (shown in green) would be higher for a smaller particle (blue) than a particle of the same radius. Reproduced from Rivas et al. and Minton et
al. [6, 19].
In vitro approaches
Since the 60 s, macromolecular crowding has been studied in the context of deciphering its effects on the thermodynamic equilibrium of chemical reactions, macromolecules stability and association rates. Macromolecular crowding is studied in vitro by the addition of a crowding agent to a set of test molecules. The crowding agent is usually chosen with a molecular mass between 50 and 200 kDa and does not interact with the tested proteins so that it only increases the excluded volume and changes steric repulsion between molecules [20]. Common macromolecular agents are polyethylene glycol [21], polyvinyl alcohol [22], dextrans [5], ovalbumin, albumin or haemoglobin [23]. The thermodynamic stability of protein folding,
molecules association, enzyme kinetics or stability of protein oligomers are frequent subjects of investigations (Table 1). Ogston and Laurent were among the firsts to describe experimentally the physical chemistry effects of macromolecular crowding. They showed that the addition of crowding agents to serum albumin in vitro influenced the thermodynamic activities of the solution. They proposed that the impenetrability of particles, and so volume exclusion, can explain the effects observed when increasing the macromolecular crowding. Subsequent studies mainly involved the coupling of mathematical models with in vitro experiments. The Minton group [3, 4] extended the work of Ogston and Laurent and theoretically demonstrated the importance of volume exclusion on the thermodynamics effects of crowding. Their model described the effects of macromolecular crowding as a shift in the thermodynamic equilibrium in favor of the more compact structure. Several groups have also studied macromolecular crowding and confinement using theoretical approaches. For instance, the Zhou group combined modeling and experimentation to describe the effect of macromolecular agent like dextran on proteins folding and interactions stability [24]. In general, macromolecular crowding is predicted to stabilize compact states relative to less compact unfolded states. For instance, macromolecular crowding is seen to alter the refolding of reduced lysozyme and triggers aggregation in vitro. Yet, aggregation can be prevented by the action of molecular chaperones [25, 26]. Aggregation, in contrast to polymerization, involves proteins in non-native conformations and is irreversible. Amyloid fibrils are insoluble fibrous structured associate with numerous pathologies. The use of crowding agents like random coil polymers, cross-linked polymers, and native proteins accelerates the rate of amyloid fibers formations as observed for alpha-synuclein 3 [27]. In addition, macromolecular crowding enhances
protein association. Among others, it promotes the association of ribosomal subunits [28] and favors fibrous protein formation through polymerization like hemoglobin [23], F-actin [21] and fibrin gels [29]. Finally, macromolecular crowding has also been shown to facilitate the association of DNA with its targeting proteins
3 Alpha-synuclein is a soluble protein that is prominently expressed in the central nervous system. In
pathological conditions, alpha-synuclein aggregates to form insoluble fibrils that are hallmarks of some neurodegenerative diseases (synucleinopathies).
17
and to enhance or favor DNA compaction [30]. Crowding effects on the kinetics of reactions are also non-negligible. Leduc et al. in 2012 analyzed in vitro the effect of macromolecular crowding on the motion of molecular motor on cytoskeleton filaments. They postulated that molecular motors have evolved to operate in crowded cellular environments. However, by increasing the concentration of the motor protein kinesins above physiological conditions, they observed a decrease in its velocity [31]. Similarly, in vitro diffusion of globular proteins are lower in a crowded solution of either hydrophilic polymers [32] or hydrogels [33].
Table 1. Effects of macromolecular crowding; reproduced and modified from [39].
Macromolecular crowding effects on association equilibria
Dextran 10K Enhances the formation of a decamer of bovine pancreatic trypsin
inhibitor
Bovine Serum Albumin (BSA) or ovalbumin
Increases the binding affinity of replication protein RepA for specific DNA sequences
Protein RNase A Promotes the dimerization of tracer apomyoglobin
Reported effects of macromolecular crowding on protein stability with respect to denaturation
Dextran 30K Stabilizes the molten globule conformation of apomyoglobin at
pH 2 with respect to heat and cold-induced unfolding
PEG 20K Refolding rate of Rd-apocyt b562 increases by 30% at 30°C
PEG 4K Increases the melting temperature Tm for thermal denaturation of
DNase I
Reported effects of macromolecular crowding on enzyme activity
PEG 6K Increases enzyme activity of Escherichia coli AspP
Polymeric crowding agents
Enzymatic activity increases and then decreases with increasing concentration of protein crowding agents
PEG 4K to 20K
Enhances activity of DNase I and S1 nuclease, does not significantly affect activity of exonuclease III, and decreases activity of exonuclease I
Reported effects of macromolecular confinement on protein stability and conformation Polyacrylamide gels Increases the melting temperature Tm of several proteins
Mesoporous silica and
addition of 0.4 M urea Confinement of glucose isomerase increases specific activity Cavity of GroEL/GroES Confinement of several proteins accelerates or decelerates rate of
Despite the diversity of experimental conditions (crowding agents, particles concentration, molecular weight) the results evidence that there are quantitatively significant differences between a crowded environment and a dilute solution. It is however difficult to extrapolate from those studies since they are performed in ideal minimalist conditions far from actual biological conditions.
In vivo approaches
Cells are not only densely filled with macromolecules. They are also composed of many different, interacting proteins moving in a heterogeneous, compartmentalized structure. The effects of macromolecular crowding alone on biochemical and biophysical cellular reactions are thus difficult to investigate in living cells. Yet, some groups managed to study these effects on protein stability and folding. For instance, the group of Oas analyzed the stability of the protein 6-85 in E. Coli. Their
method is based on the detection by MALDI 4 mass spectrometry of the amide
hydrogen exchange as a marker of the protein folding stability. While the hydrogens are usually protected from exchange upon native conformation of the protein, unfolded state exposed them to the solvent and led to their release. The authors compared the stability measured in vivo with previous in vitro data and concluded that increasing crowding in vivo enhances the protein stability [7]. The group of Gierasch developed a method to tag the cellular retinoic acid-binding protein I (CRABP). They observed that the folding behavior and properties observed of the protein in E. coli was consistent with in vitro studies [34]. Moreover, the 3D visualization with high resolution of complex physiological environment is now possible using cryo-electron tomography [2]. Also, cell organelles and protein mobility can be efficiently observed using microfluidic techniques coupled to microscopy [35]. In particular, diffusion of proteins is expected to decrease in a crowded environment. This can be checked at the single cell level using
4 The Matrix-Assisted Laser Desorption/Ionization (MALDI) technique is a mass spectrometry method
19
Fluorescence Recovery After Photobleaching (FRAP)5 or Fluorescence Correlation
Spectroscopy (FCS)6. In 2004, Weiss and collaborators analyzed by FCS the diffusion
of fluorescent dextran in the cytoplasm of HELA cells [8]. They observed an abnormal sub-diffusion process 7 of dextran polymers. Using computer simulations,
they demonstrated that macromolecular crowding is implicated in this process. Kao et al. measured the diffusion of fluorescent particle in Swiss 3T3 fibroblasts. They observed a decrease in the cytoplasmic diffusion of the small fluorescent probe BCECF upon cell volume reduction (Figure 4A) [36].
Figure 4. In vivo effects of increasing macromolecular crowding on proteins diffusion. (A) Diffusion of BCECF inside 3T3 fibroblasts measured as a function of the inverse of the relative cell volume (V0/V). The diffusion of the fluorescent probe BCECF is decreased upon
volume reduction. Data are represented as the mean +/- standard error of the mean for three to seven measurements. Taken from Kao et al. [36]. (B) GFP diffusion in E. coli plotted in function of osmotic up-shift. The authors observed the apparition of Visible Plasmolysis Spaces (VPSs) above 280 mOsm/L that correlates the rapid decrease of GFP diffusion. Taken from Konopka et al. [37].
5 Fluorescence Recovery After Photobleaching (FRAP) is a method for measuring the dynamics of 2D or 3D molecular mobility such as diffusion or transport. A defined region is photobleached and the recovery of fluorescence is monitored. The time of recovery is given by the motion of the remaining fluorescence particles.
6 Fluorescence Correlation Spectroscopy (FCS) is a technique in which spatial fluctuations of the fluorescence intensity are measured in a microscopic volume of about 10-15 L (1 femtoliter) defined by a focused laser beam.
7 Sub-diffusion processes are characterized by deviations from the classical Brownian diffusion. The mean square displacement of a subdiffusive particle increases sublinearly with time. The degree of this abnormality depends on the size and conformation of the traced particle and on the total protein concentration of the solution.
Similarly, Konopka et al. performed FRAP experiments in E. coli. FRAP is more difficult to achieve with bacteria than in mammalian cells due to their small size (~ 2 µm). Nevertheless, the authors managed to quantify a decrease in diffusion of the GFP protein when the osmotic stress was increased, and thus the cell size was decreased (Figure 4B) [37]. This is an important result, since it suggests that the cells dynamics can be altered upon volume compression, as we hypothesized in the introduction.
Indeed, applying a hyper-osmotic stress triggers the cell shrinkage and the densification of its intracellular environment. Hence, it increases the level of macromolecular crowding. Hyper-osmotic stress is known to have several physiological consequences on intracellular organization, notably on organelles. For example, osmotic stress induces the transient disintegration of both actin and microtubule cytoskeleton [12]. It also affects the vacuoles morphology in S. cerevisiae. Vacuoles are the most prominent organelle in yeast and have a central role in osmoregulation due to their capacity to stock water. After an osmotic stress, the vacuoles divide in numerous smaller vacuole fragments [38]. In another study, the impact of osmotic stress on the size and morphology of the nucleus in mammalian cells has been computed. The authors predicted that the nucleus shrinks proportionally to the cell size [39]. Petelenz-Kurdziel et al. confirmed these results by measuring in S. cerevisiae the size of both the cell and the nucleus upon various NaCl concentrations [40]. In agreement with modeling, they observed a linear variation of the nucleus size with the overall cell compression notably at low concentration (100 mM NaCl). However, the nuclear volume recovered the osmotic stress faster than the whole cell size, especially at high concentrations (> 400 mM NaCl). Despite those known macrostructures alterations, it is not easy to discriminate between a biological-physiological response and the crowding effect due to the increase of the excluded volume.
21
Cell volume and optimal molecular crowding?
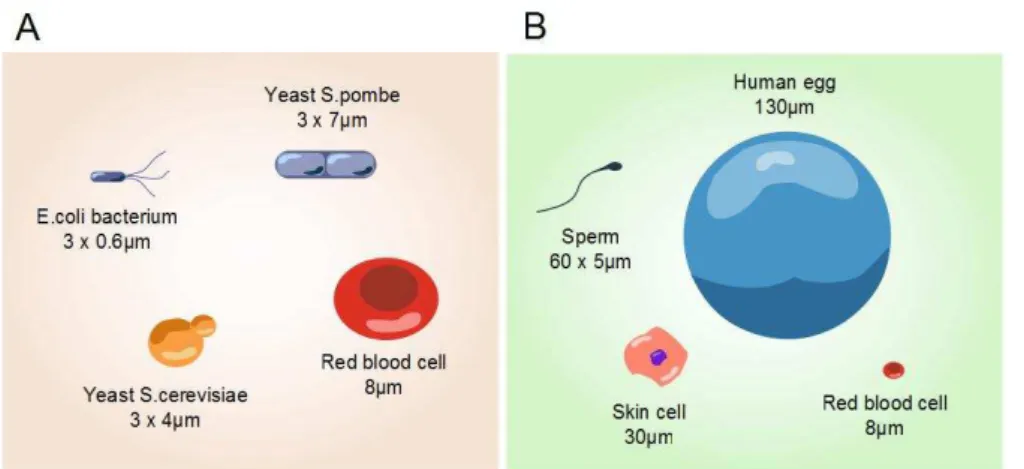
As previously mentioned, the volume fraction occupied by macromolecules may be as high as 30 to 40%. Most eukaryotes present a similarly high crowded intracellular environment even though their typical dimensions vary between 5 and 100 µm (Figure 5 and Table 2).
Figure 5. Cell size heterogeneity. (A) Comparison of cell sizes between different species. (B)
Comparison of cell sizes in same organism (human). Reproduced from:
http://learn.genetics.utah.edu/.
Table 2. Dimensions rates are taken from [41 43].
Species Dimensions Reactions rates
Diameter (µm) Volume (µm3) Genome (Mbp) Diffusion of proteins (µm2.s-1) Cell cycle (min) Escherichia coli 0.7-2 0.5-5 5 7.7 20-40 Saccharomyces cerevisiae 3-6 20-160 12 15 70-140 Schizosaccharomyces pombe 3.7-5 92 13.8 - 90-180 Animal cells 10-100 100-10,000 2000-3000 27 900-1800
To explain the apparent conservation of such a high intracellular density, Dill et al. in 2011 postulated that it has been selected through evolution so that biochemical reaction rates are optimal [44]. They took into account the competitive effects of molecular crowding on diffusion and collision rates of proteins. Decreasing protein diffusion may limit the rate of biochemical processes, while increasing the probability of protein encounters may increase the same biochemical rates. Since
both effects depend on molecular crowding, there should be an optimal of protein density for which the biochemical rates are maximum. In their theoretical framework, they only took into account diffusion-limited reaction. The rate of reaction, , of a stationary reactant of radius with a mobile particle was approximated to be proportional to the concentration and the diffusion constant of the mobile particle:
(1)
The authors used the fact that c varies like the volumic fraction . Increasing increases the frequency of particle encounter but on the meantime decreases their diffusion. Therefore the two effects can equilibrate each other. To link the diffusion to the molecular crowding, they first expressed the cytoplasm viscosity by:
(2)
being the viscosity of water, and ~0.58 the volume fraction where the glass transition occurs. Assuming that the diffusion coefficient, , varies like the inverse of the cytoplasm viscosity, (1/ ), the diffusion rate is given by:
(3)
To find the maximum rate, and so the optimal one, the authors set the derivative of this equation to zero:
(4)
The maximum rate is obtained when = /3. As previously mentioned, =0.58. Thus, the predicted optimal macromolecular density is =0.19. This estimated value is close to the actual cellular volume fraction ( [18, 45]. This optimum, if it exists, corresponds to a fine tuning between the cell size and the intracellular macromolecular content. Above the optimal volume fraction, the diffusion coefficient significantly decreases and affects all diffusion-limited reactions. Rapid
23
protein association is an example of diffusion-limited reactions. In contrast, reactions can also be limited by the rate of conversion of an intermediate. Such reactions are referred to as transition-state or chemically rate-limited. Note that molecular crowding is expected to decrease the rate of diffusion-limited reaction while possibly enhancing chemically rate-limited reactions (Figure 6).
Figure 6. Representation of reactions rate in function of the molecular crowding. The dashed green line represents diffusion-limited rate constant, proportional to the frequency of encounter of the two reactants. The dashed blue line depicts chemistry-limited rate constant. Finally the solid red line corresponds to the overall rate constant. Taken from Ellis [45].
In this simple description, Dill et al. did not take into account the intracellular complexity. The authors disregarded chemically rate-limited reactions and assumed that the intracellular species behave like hard spheres, a crude approximation. Yet a soft colloid framework is more appropriate to describe the cell interior [46]. Colloids are particles of nano- or micro-meter size that are dispersed in a liquid, forming a suspension. Colloidal particles can be either solid (rigid) like glass or plastic, or soft (deformable) like vesicles or micelles and are respectively called hard and soft colloids. These colloidal particles, when present at high density, may alter the ability of the liquid to flow as in a dilute case, ultimately undergoing what is called a glassy transition: the system becomes jammed. Near this transition, the motion of the particles in the suspension becomes slow enough that it can be considered as frozen. In a very recent study, Zhou et al. showed that eukaryotic cells interiors behave as soft colloids upon compression [47]. More precisely, they showed that the cytoplasmic viscosity increased exponentially with the macromolecular volume fraction, a characteristic reminiscent from a soft glassy transition (Figure 7).
Fragility, defined as the derivative of the logarithm of the viscosity with respect to the volume fraction, is used to characterize the behavior of such glassy transition and in particular the ability of a colloidal system to support small perturbations of density [48]. The relaxation time of non-deformable hard colloidal particles is highly sensitive to a change in density which defined them as fragile liquid. On the contrary, soft colloids are deformable particles and are able to go beyond simple contact with surrounding particles. Their glassy transition is more progressive than for rigid particles. They are said to be non-fragile liquids. As shown in Figure 7, the intracellular viscosity is drastically increased when the crowding is increased. Although this model of the viscosity of the cytoplasm is closer to reality than the elementary one used by Dill et al., their conclusion remains valid: increasing the protein density and thus the molecular crowding inside the cytoplasm increases the cytoplasm viscosity and thus decreases the diffusion coefficients of proteins, thereby decreasing their biochemical reaction rates.
Figure 7. Cells behave as soft colloid under compression. (A) The viscosity of different mammalian cells is estimated in function of the relative volume fraction of macromolecules. Cells present an exponential distribution contrasting with the sharp transition observed for hard sphere (black cross). (B) The fragility m is plotted in function of the isotonic stiffness. Figure taken from Zhou et al.[47].
As we have just discussed, cell volume compression induced by osmotic perturbations allows the investigation of diverse biological processes including protein stability and folding [7, 34], sub-cellular diffusion rate [8, 36, 37], or membrane mechanical properties [47]. Importantly, we can wonder how signal transduction mechanisms are affected by macromolecular crowding. Only few groups have analyzed the impact of macromolecular crowding on signaling pathways. Eide and coworker used a computational simulation to investigate the
25
coupling of ligands to the dedicated receptor in the T lymphocytes [49]. Lipkow et al. studied the impacts of macromolecular crowding on the chemotaxis activity of E. coli. They analyzed the diffusion of the protein CheY from the receptors to the flagella motors. When they introduced macromolecular confinement to their simulations, the authors observed a decrease in CheY diffusion [50]. Even if a variety of modeling approaches could be used for such investigation [17, 51], computing the effects of crowding remains difficult [52]. Some studies approached experimentally this question. Rohwer et al. measured in vitro the rate of transfer of a chemical group along a series of carriers [53]. They analyzed a classical bacteria group-transfer pathway called phosphoenolpyruvate (PEP): carbohydrate phosphotransferase system (PTS). Upon glucose uptake by E. coli, a phosphoryl group is transferred along four PTS proteins. The authors measured a decrease in the flux of phosphoryl transfer under macromolecular crowding. Even if this investigation has been successfully conducted in vitro, transferring such analysis in vivo is not trivial. To our knowledge, Van Wuytswinkel et al. are the only one to show a direct macromolecular crowding effects on signal transduction although their study was very preliminary and not conducted in the purpose of investigating the effects of crowding [54]. The authors applied osmotic shocks to the yeast S. cerevisiae and analyzed intermediate reactions kinetics of the High Osmolarity Glycerol (HOG) 8 MAPK pathway. For a severe stress (1.4 M NaCl), they observed
that the HOG cascade was apparently slower than for a gentle stress (0.4 M NaCl). They did not provide any reasonable explanation for this. Volume compaction due to osmotic stresses and the increased in macromolecular crowding is a possible explanation of this counter intuitive effect. In this thesis, we will further explore this and use osmotic compression to study the links between induced molecular crowding and signaling in yeast. However, it is important first to characterize what the effects of osmotic stress are in the cellular context, and then to describe precisely the way the budding yeast cope with it.
8 The High Osmolarity Glycerol (HOG) MAPK pathway is activated by increased environmental osmolarity and results in a rise of the cellular glycerol concentration to adapt the intracellular osmotic pressure.
2. Challenging macromolecular crowding through cell volume
compression
The mechanism of osmosis
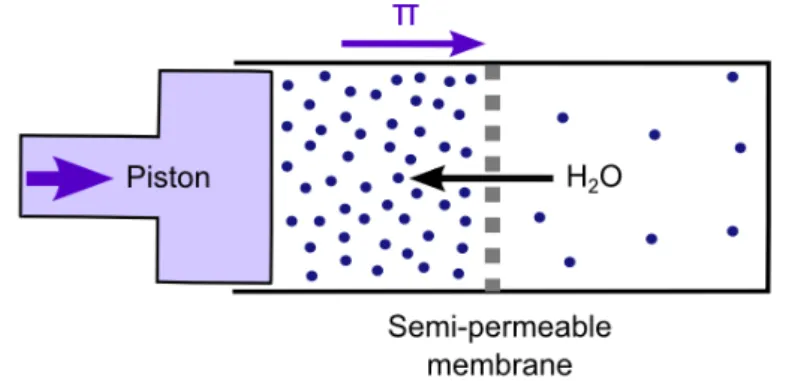
Let s consider a perfect semi-permeable membrane, that is a membrane permeable to solvent, in our case water, but impermeable to solutes. If the concentrations of solutes are not identical on both sides of the membrane, one observes motion of water through the semi-permeable membrane to equilibrate solutes concentrations on both sides. This results in the creation of a pressure acting on the membrane. The osmotic pressure, , measured in Pascal (Pa), is defined as the pressure that one needs to apply externally to counteract the net flow of water (Figure 8).
Figure 8. Osmosis equilibration triggered by water flow through a semi-permeable membrane. Water flows from the area of low solute concentration (blue dots; right chamber) to the area of high solute concentration (left chamber). If a pressure is applied to the plunger, the flow of water is reduced. The pressure necessary to stop the water flow corresponds to the osmotic pressure Reproduced λrom Stranμe et al.[55].
The Van t Hoλλ relation states that the osmotic pressure that is due to the presence of a solute in ideal solution is given by:
(5)
R is the perfect gas constant (8.31 J/K.mol), T the absolute temperature (in kelvin), n is the number of osmotically active moles, V is the volume (m3) and Ci the molar
concentration of solute i. Accordingly, increasing the number of solute molecules in a solution increases its osmotic pressure. If one mole of electrolyte dissociates into several ions, it results in a greater osmotic pressure than in the case of the addition of a simple compound. The osmolarity of the medium is higher. The number of mole has to be multiplied by the number of ions after dissolution (ex: 1 mole of
27
CaCl2 = 3 osmol). The osmol concentration of a solution can be described either in
term of osmolality or osmolarity. Osmolality indicates the total number or moles present in a kilogram of solution, while osmolarity is related to the number of moles present in one liter of solution. Osmometers are dedicated tools for measuring the osmotic pressure. Membrane osmometers are made with a chamber connected to a column and filled with high concentrated solutes (Figure 9). A semi-permeable membrane separates this chamber from the solvent. Due to the differences in osmolarity of the two solutions, water flows inside the chamber and the level of liquid rises inside the column: the level of liquid in the column rises above the level of solvent. The osmotic pressure is equilibrated by the hydrostatic pressure due to gravity.
(6)
in which h is the level difference between the column and the solvent chamber, is the volumic mass of the solution and g the gravity acceleration. Measuring h is a direct measurement of the osmotic pressure. Alternatively, the osmotic pressure can be measured directly by a pressure transducer [56].
Figure 9. Basic representation of a membrane osmometer. A solution (dark blue) is separated from the solvent (light blue) by a semi-permeable membrane. The equilibration of the sum of osmotic pressures and hydrostatic pressure leads to a difference of water levels that can easily be measured.
In terms of thermodynamics, the osmotic equilibrium is reached when the chemical potentials of the solvents are identical on both sides of the membrane. The chemical potential is defined as the change of enthalpy ( G) of a system if some particles are added or removed to a solution when the number of moles of other compounds, the temperature and the pressure stay constant:
(7)
For the case of an ideal gas, the chemical potential is then given by:
(8)
is the chemical potential under the standard conditions and depends on the temperature only, while is the partial pressure of the species i. Similarly the chemical potential for a solute in an ideal, dilute solution is expressed as:
(9)
is the concentration of molecule i. Yet, real solutions differ from ideal situations due to interactions between molecules of solute species i and all other solute and solvent molecules in the solution. To account for this, the chemical potential is then expressed as:
(10)
a is called the thermodynamic activity and is given by:
(11)
i is the activity coefficient. In ideal situation, i=1 and the effective concentration ai
is identical to the concentration. When the concentration increases, the solution is no more in ideal conditions and the activity coefficient decreases due to solute-solute interactions. This is in particular the case when studying highly crowded solutions. On the previous equation, one sees that the Van t Hoλλ relation is analoμous to the law of the ideal gas. With the same analogy one can relate the osmotic pressure to the chemical potential and get a definition even in the case of crowded environments λor which the Van t Hoλλ relation does not hold anymore
Considering the situation of a semi-permeable membrane that separates a diluted solution from a pure solvent, the osmotic equilibrium can be written as,
29
(12)
where is the chemical potential on the side of the pure solvent (water) and the chemical potential on the solute side, where the pressure is augmented by the osmotic pressure dp. We can then write that
(13)
and (14)
Vm is the molar volume, that is to say the volume occupied by a mole of solute. By
combining the last equations and knowing that the pressure differences, dp, is the osmotic pressure, we obtain:
(15)
For diluted solutions, the activity can be written as with the proportion of solute relative to the number of total moles. In highly diluted solutions, is small compared to 1 and one can approximate the ln(1- ) ~ - . Therefore, the osmotic pressure can be expressed as:
(16)
By definition, is equal to the ratio of the number of mole of solute, , on the number of total moles, . For a dilute solution, it is close to the number of mole of solvent, nw. Since Vm.nw is the total volume of solvent, V, we λind the Van t Hoλλ law
for a diluted solution:
Osmotic behavior of biological membrane
Osmotic equilibration often occurs in a cellular context. However, cell membranes are far from the ideal semi-permeable membranes previously described. For instance, water motion directed by osmotic gradients may be enhanced by the presence of water channels, the aquaporins 9 [57]. Moreover, biological membranes
are permeable to electrolytes. Apart from small molecules that diffuse spontaneously, transport through the membrane can be achieved actively through ions channels and carriage processes [58]. Similarly to water, electrolytes move toward their lower concentration and this transport is at play when concentrations on both sides of the cytoplasmic membrane are unbalanced. This is indeed why cells spend some of their energy to maintain concentration of key ions despite their external concentration by constantly pumping them in or out. Note that an ionic flow ultimately helps to decrease the difference of osmotic pressure. Staverman, in 1951, improved the model of cellular osmosis by including the membrane permeability to solute i [59] and introducing the reflection coefficient, i.
(18)
is the observed osmotic pressure and is the osmotic pressure for an ideal semi-permeable membrane. The reflection coefficient ranges from 0 to 1. When the solute is entirely impermeable to the membrane, i =1. On the contrary, if the solute
is entirely permeable to the membrane, the reflection coefficient is equal to zero. This reflection coefficient term is added to the primary osmotic pressure equation.
(19)
Taking into account the membrane permeability to solutes, the flow of water, Jv,
driven by hydrostatic ( P) and osmotic ( ) pressure differences, can be defined as:
9 Aquaporins are water channels involved in the control of the water content of cells [208]. Although
aquaporins are water specific, they may also be permeable to small molecules like glycerol or urea. In the yeast S. cerevisiae, there are two aquaporins, named AQY1 and AQY2. Yeast strains deleted for aquaporin genes, most notably AQY2, show a stronger resistance to rapid osmotic changes [208]. However, many yeast strains, including the parental strains we are using in this study, have a genetic mutation for aquaporin genes and express non-functional aquaporins [209].
31
(20)
Lp corresponds to the hydraulic conductivity of the cell membrane. It defines the
permeability of the membrane to water. Most cells do not actively maintain an osmotic pressure difference through their membrane, although they use their channels and pumps to control the ionic content of their cytoplasm. However, organisms surrounded by a rigid cell wall like plant cells, yeast or bacteria, maintain a significant pressure difference, called turgor pressure [60]. The turgor pressure has an essential role for growth, cell structure and membrane transport. The cell wall surrounding the membrane of such cells is a rigid and dynamic organelle that notably protects cells against external mechanical stresses, including osmotic stress. The turgor pressure is due to the mechanical rigidity of the cell wall. The turgor pressure is measured as the difference between the internal ( int) and the external
( ext) total pressure exerted on the cell.
(21)
Figure 10. Diagram of a pressure probe and its utilization on cell. (A) Pressure probes are composed of a micro-capillary, pressure transducer and spaced filled with
oil (represented shaded). (B) The
penetration of the micro-capillary in the cell triggers the formation of a meniscus at the interface between the cell medium and the micropipette oil. The pressure is measured by positioning the meniscus, thanks to the metal rod, to its location before inserting the micro-capillary. Taken from Boyer [61].
Several methods have been used to estimate the turgor pressure of cell-wall organisms (Table 3). In plants, turgor pressure of single cells was measured experimentally using pressure probes (Figure 10). The device, initially developed for large single algal cells, is essentially composed of a pressure transducer and a micro-capillar filled with oil. The tip of the micro-capillar is inserted inside a cell
and the turgor pressure corresponds to the necessary pressure to stop the flow out of water [61]. However, such method is rarely used in single cell due to the technical difficulty of targeting a specific cell; instead it is applied for whole plant tissues.
The small size of micro-organisms such as bacteria or yeast prevents the use of pressure probes. In prokaryotes, organelles called intracellular gas vesicles are used for turgor estimations [62]. Gas vesicles are intracellular compartments filled with air and impermeable to water. They are found in prokaryotes like cyanobacteria, halophilic archaeo bacteria and some eubacteria. These gas vesicles do not absorb light in the visible spectra but instead they scatter light. Under pressure, the gas vesicles collapse, decreasing the amount of light scattered. Ultimately, the turgor can be measured through quantification of this decline in function of the pressure applied. However, this technique cannot be applied to every cell-walled organism since only some prokaryotes present gas vesicles. Minc and coworkers developed a microfluidic device to extract the mechanical properties of the yeast Schizosaccharomyces pombe [63]. Other technical approaches exist but are usually not very precise [64, 65]. It is indeed a challenge to measure an osmotic pressure in a complex system, densely packed with proteins and macromolecules such as a cytoplasm. The presence of the turgor cell wall that can sustain a difference of osmotic pressure between the internal and external environment is a considerable limitation to internal osmotic pressure estimation. In the budding yeast, there is no experimental method for direct measurement of the turgor pressure. Instead, several studies estimated the turgor value indirectly [65, 66] but unfortunately obtained values that did not compare very well (Table 3). According to the Van t Hoff relation the cell volume and the external osmotic pressure are inversely proportional. Yet, because of the turgor pressure, this equation cannot be applied directly. Under compression, the turgor pressure decreases as the osmotic stress increases and three regimes can be distinguished [66]. During the first one, called the transient phase, the turgor pressure decreases but still presents positive values (Figure 11, left). When the turgor pressure reaches a null value, volume reduction enters the second phase, the steady-state phase. In this case, the cell shrinks in a manner inversely proportional to the external osmolarity (Figure 11). The turgor
33
pressure is null and the internal and external pressures are equal. From this, the turgor pressure can be estimated [65]. Recently, Schaber et al. made a mathematical model of cell-wall organisms under compression [67]. They compiled four experiments conducted on S. cerevisiae in which cell volume variations were measured over a range of osmotic stress. By fitting their model on their experimental data, they extracted a turgor pressure of 0.6 MPa. Such value is supported by previous estimation of yeast turgor in stationary growth phase [68]. After the steady-state phase, the volume reaches a plateau. During this plateau, the cell undergoes plasmolysis which is the physical dissociation of the cell wall from the membrane [67].
Figure 11. Cell volume and osmotic pressure relationship in cell-walled organisms. (A) Cell volume reduction in function of increasing external pressure ext) can be subdivided in
three phases. In the transient phase, the turgor pressure decreases but stays positive. In the steady-state phase, the turgor pressure t reaches a null value and the cell volume variation λollows the Van t Hoλλ law Under extreme osmotic pressure, the cell reaches a minimal volume for which plasmolysis occurs.
b corresponds to the smallest possible size and
is referred as the non-osmotic volume (NOV).
Table 3. Turgor pressure measurements and methods used.
Organisms Turgor
pressures (MPa)
Techniques References
Arabidopsis Epidermal root
cells
0.65 Pressure probe [69]
Bacteria Ancylobacter aquaticus
0.187 Intracellular gas vesicles [70]
Yeast S. pombe 0.85 Microfluidic chamber [63]
Bacteria Bacillus subtilis 1.9 Van t Hoff relationship [65]
Yeast S. cerevisiae 0.05 - 2.9 Van t Hoλλ relationship [71, 72]
Physiological response to osmotic stress
In iso-osmotic conditions, cells are, by definition at an osmotic equilibrium (Figure 12, middle). Whenever a change in osmolarity occurs, a flow of water and electrolytes spontaneously appears, leading to a change of cell volume and a novel mechanical equilibrium, in which the osmotic pressures and the turgor pressure are balanced. One talks about hypo-osmotic stress when the extracellular environment is diluted compared to the iso-osmotic conditions for the cell. Such dilution triggers a net flow of water inside the cell. Consequently, the cell swells. The cell membrane is stretched and this can eventually lead to the rupture of the cell membrane (haemolysis in red blood cells). Cell-walled organisms are more resistant to bursting because of the cell wall that can resist expansion (Figure 12, left) [73]. In such situation, cells are said to be turgid. In contrast, hyper-osmotic stress corresponds to the change from an iso-osmotic to a concentrated extracellular environment. It leads to the loss of cytoplasmic water and the shrinkage of the cells. Consequently, the cell membrane wrinkles and for a too strong stress, plasmolysis appears (Figure 12, right).
Figure 12. Comparison of hyper-osmotic, hypo-osmotic and iso-osmotic conditions in animal (top panel) versus cell-walled organisms (bottom panel). In hypo-osmotic solution (left), water flows in and triggers the cell to swell. At high hypo-osmotic condition, cells could eventually lyse. In hyper-osmotic condition (right), water flows out leading to cell shrinkage. The cell membrane ultimately invaginates. In cell-walled organisms, plasmolysis occurs.
35
Mechanisms of cell volume regulations
We have previously discussed the effect of changing the external osmotic pressure on the cell volume and the cell mechanical integrity. Mammalian organisms usually maintain their cells in a controlled environmental fluid with limited osmotic fluctuations. However, some specialized cells, like the kidney inner medullary cells [11] or chondrocytes cells [74] are subject to rapid and strong variation in their intracellular or extracellular concentration and need dedicated volume regulatory mechanisms [75]. In plant, osmosis has essential functions for cell growth and nutriments uptake by the roots. During these processes, plant cells swell until they become turgid due to the high pressure exerted on their cell wall [60]. Such stress leads to an abnormal cell physiology that may impact the proper functioning of biological processes. Cells should be able to adapt to such stress so as to recover a normal cell size. There are several regulation mechanisms depending on the cell type and their usual ionic environment. For micro-organisms, the predominant strategy for osmoregulation is the production and accumulation of a compatible osmolyte. For instance, E. coli can synthetizes glycine betaine as an osmoprotectant [76]. This osmolyte is said to be compatible as it does not alter, a priori, the intracellular properties even at high concentrations. Other micro-organisms living in extreme environments like halophilic bacteria or archaea, have developed a salt-in strategy [77]. As those organisms are constantly challenged by strong osmotic stress, they can maintain a high intracellular salt concentration.
In its natural environment, S. cerevisiae is exposed to sucrose and hexoses concentrations ranging from 0.1 to 1.5 M [78]. In laboratories, 1 M sorbitol corresponds to the typical concentration to induce an osmotic stress for S. cerevisiae. Many micro-organisms are adapted to extreme environments such as high osmotic conditions, acidic pH, or low temperatures. Organisms that are able to grow under constant stressful conditions are called extremophile. The capacity of a species to grow under low availability of water is termed osmotolerance 10, xerotolerance 11,
10 Osmotolerance is the ability to resist a wide range of osmotic pressures. 11 Xerotolerance is the ability to grow in conditions with low water availabilities.


![Figure 16 , left). By tethering actors of the pathway, Ste5 form a complex that direct the signal to the appropriate MAPK [91]](https://thumb-eu.123doks.com/thumbv2/123doknet/2329008.31205/41.892.111.727.403.856/figure-tethering-actors-pathway-complex-direct-signal-appropriate.webp)
![Figure 16 , the MAPK pathways often share components, but cross-activation, although possible in principle, is not usually observed [97]](https://thumb-eu.123doks.com/thumbv2/123doknet/2329008.31205/42.892.190.787.584.993/figure-pathways-components-activation-possible-principle-usually-observed.webp)