HAL Id: hal-01591717
https://hal-ensta-paris.archives-ouvertes.fr//hal-01591717
Submitted on 21 Sep 2017
HAL is a multi-disciplinary open access
archive for the deposit and dissemination of
sci-entific research documents, whether they are
pub-lished or not. The documents may come from
teaching and research institutions in France or
abroad, or from public or private research centers.
L’archive ouverte pluridisciplinaire HAL, est
destinée au dépôt et à la diffusion de documents
scientifiques de niveau recherche, publiés ou non,
émanant des établissements d’enseignement et de
recherche français ou étrangers, des laboratoires
publics ou privés.
Contactless Physiological Data Analysis for User Quality
of Life Improving by Using a Humanoid Social Robot
Roxana Agrigoroaie, Adriana Tapus
To cite this version:
Roxana Agrigoroaie, Adriana Tapus. Contactless Physiological Data Analysis for User Quality of
Life Improving by Using a Humanoid Social Robot. International Conference on Image Analysis and
Processing, Sep 2017, Catania, Italy. �hal-01591717�
Quality of Life Improving by Using a Humanoid
Social Robot
Roxana Agrigoroaie and Adriana Tapus
Autonomous Systems and Robotics Laboratory, U2IS ENSTA-ParisTech, Universit´e Paris-Saclay, Palaiseau, France {roxana.agrigoroaie;adriana.tapus}@ensta-paristech.fr
Abstract. Robots have increasingly been used for improving the qual-ity of life of people with special needs, such as people suffering from Mild Cognitive Impairment, elderly, people with different physical and cognitive abilities. In this paper, we propose a method for extracting and analyzing physiological data by using contactless sensors (i.e., RGB and thermal cameras). The physiological parameters that can be analyzed are: the respiration rate, blinking rate, and the temperature variation across different regions on the face (i.e., the forehead, the nose, the peri-nasal region, the left and right periorbital regions, and the entire face). These parameters, together with the action units (AUs) can be indica-tors of the current internal state of an user. We analyze data from three different scenarios and report the results obtained.
Keywords: Physiological data; Human-robot interaction; Quality of life
1
Introduction
In the past years, many research works concentrated on developing assistive technology for people with special needs (e.g., children and adults suffering of Autism Syndrome Disorder (ASD), elderly, people with different physical abil-ities, people suffering from Mild Cognitive Impairment (MCI)) [1–4]. One such project is EU Horizon2020 ENRICHME project1. The purpose of this project is
to develop an assistive robot for elderly with MCI. A robot should be aware of the internal emotional and physiological state of the human users so as to better serve them and in the same time to improve their quality of life.
Determining the physiological internal state of a person is a research topic that received a lot of attention in the last decade [5, 6]. Most of the devices used to gather physiological data are invasive. To counteract this, other methods have been developed, which use contactless sensors (e.g., RGB-D and thermal cam-eras). These cameras can be used to extract different physiological parameters that provide valuable information for determining the internal state of a person.
1
The overall goal of the robot is to understand the context and the internal state of the user so as to adapt its behavior for a more natural human-robot interaction (HRI). The novelty of our work consists in combining different al-gorithms for extracting physiological parameters in a non-invasive way with the final goal of adapting the behavior of a humanoid robot for improving the quality of life of an user.
Our paper is structured as follows. Section 2 presents a description of the physiological parameters and why they are important in the context of assistive robotics based on the literature. Section 3 briefly describes the sensors used for data acquisition. Section 4 describes how the data was recorded and analyzed. Section 5 shows the results, while Section 6 presents a short discussion based on the obtained results. Finally, Section 7 concludes the paper and offers a perspective on future work.
2
Physiological parameters
For a better understanding of human behavior, we must look at the underlying physiological activity. Some of the physiological data that we can look at are: the electrocardiogram (ECG), the electroencephalogram (EEG), the pupillary dilation, the electrodermal activity (EDA), the respiration rate (RR), the heart rate, the blinking rate (BR), etc. Moreover, there are some other non-verbal and para-verbal indicators of the current internal state of a person (e.g., facial expressions, prosody). In this paper, we look at the blinking rate, the respiration rate, facial expressions, and the temperature variation on the face during an interaction.
In this context, three types of blinking are identified in the literature [7]: spontaneous (without external stimuli and internal effort), reflex (it occurs in response to an external stimulus), and voluntary (similar to the reflex blink but with a larger amplitude). The type of blinking that is of interest for assistive applications is the spontaneous blinking. The authors of [8] found an average resting BR of 17 blinks/minute, with a higher BR during a conversation (mean BR of 26) and lower BR during reading (mean BR of 4.5). In [9], the authors showed that the BR relates to both the task that an individual has to perform and to the difficulty of that task (e.g., during a mental arithmetic task, the more difficult the task, the higher the BR). Blinking has also been used in a deception detection approach [10].
While performing a certain activity, either physical or cognitive, it is impor-tant to make sure that the individual performing the task is not too stressed. The temperature variation on different regions of interest on the face could in-dicate the presence of different emotions (e.g., stress, fear, anxiety, joy, pain) [11]. In [12], the authors have used a thermal camera to reliably detect stress while interacting with a humanoid robot. The authors in [13] have shown some of the limitations and the problems that can arise when using thermal imaging for determining the temperature variation across different regions on the face.
One aspect in which the quality of life of an individual can be increased is by promoting more physical and cognitive exercises. An important parameter to monitor during these activities is the RR. The number of breaths per minute (BPM) is how RR is measured; where a breath is made up of two phases: inspira-tion and expirainspira-tion. The average resting RR for adults lies between 12-18 BPM [14]. The RR can be measured either by using contact sensors (e.g., respiration belt [15], electrocardiogram [16]), or by using a thermal camera [17, 18].
Emotional responses can be detected on the face as well. The easiest and most natural way of communicating our emotions is by using facial expresssions. Ekman and Friesen [19] have developed the Facial Action Coding System (FACS) for describing these facial expresssions. The coding system defines atomic facial muscle actions called action units (AUs). There are 44 AUs and 30 of them are related to the contractions of specific muscles (12 on the upper face and 18 on the lower face). AUs can occur singly or in combination. The combinations of different AUs define different emotions [20] (e.g., happiness AU6 - cheek raiser + AU12 - lip corner puller).
3
Sensors
For the non-intrusive and contactless acquisition of data necessary for analyzing the physiological features presented in Section 2, we have used two sensors:
– An ASUS Xtion Live Pro RGB-D camera – An Optris PI 640 USB-powered thermal camera
The RGB-D camera provides a 640x480 RGB image at up to 30 Hz. We used the configuration with a frame rate of 25 Hz. The 45x56x90 mm thermal camera has an optical resolution of 640x480 pixels and a spectral range from 7.5 to 13 µm. It is capable of measuring temperatures ranging from -20◦C to 900◦C at a frame rate of 32 Hz.
4
Methodology: Data extraction and analysis
The algorithms that we developed for the extraction and analysis of the phys-iological parameters, and the AUs are described. For the extraction of all pa-rameters previously mentioned, the face of an individual is required. Therefore we developed a Robot Operating System (ROS) [21] package that can detect and track faces in a video feed. The face detection algorithm uses Dlib [22], an open source library with applications in image processing, machine learning, etc. The same library can also be used to determine the location of 68 feature points of interest on a face. We used these feature points to define regions of interest (ROIs) on the face.
4.1 Blink
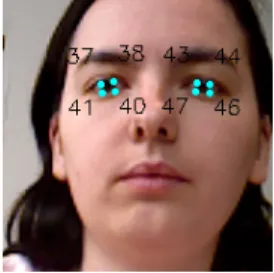
For the detection of blinking we used the RGB data. Our ROS package detected the face and the feature points around the eyes (see Fig. 1a). The only ROI in this case is made up of the eyes. In order to determine if a person blinks or not, we looked at the distance between the eyelids.
As can be seen in Fig. 1b, each eyelid is characterized by two feature points. First, we computed the distance between the upper and lower eyelids for both points (e.g., in Fig. 1b the distance between the feature points 37 and 41). When a person is very close to the camera the face region is very large, but as the distance between the camera and the person increases, the face region decreases. Therefore, the distance between the eyelids can be very small. To counteract this, we squared the sum of the two distances for each eye. As there are multiple eye shapes and sizes, we had a period of 30 seconds in which we recorded the distances for both eyes, at the end of which we computed the mean eyelid distance for each eye. Only after this mean is available, we can detect if a person is blinking or not. We consider that a person has its eyes closed if the current distance is smaller than half the mean distance for that eye. When the person reopens the eyes we consider that he/she blinked. Knowing that a blink lasts for a period of 100-300 ms, our module is capable of making the distinction between a blink and keeping the eyes closed.
(a) Feature points (b) Eyes feature points
Fig. 1: Facial feature points
We developed two methods to detect BR. For both methods, we are using a time period of one minute. In the first one, we simply count the number of blinks that we detected. For the second method, we saved all eyelids distances (see Fig. 3a for input signal) in a file. On the saved values we applied signal processing algorithms to detect the blinks. The steps that we applied are:
– We applied a low pass Butterworth filter with a sampling frequency of 25 Hz (the frame rate of our RGB camera), a cutoff frequency of 1.75 (see (1)) with the purpose of filtering out small variations in eyelid distance.
– We emphasized the moments with the largest change in distance by applying a differences and approximate derivative.
– Finally, all peaks were detected and counted (see Fig. 3b); in case the number of blinks for the left and right eye are different, the minimum of the two is considered to be the BR (a difference can appear in case a person is winking). To compute the optimal cutoff frequency we applied (1) (see Equation 9 in [23]), where fsrepresents the sampling frequency, and fc, the cutoff frequency.
fc= 0.071 ∗ fs− 0.00003 ∗ fs2 (1)
4.2 Temperature variation
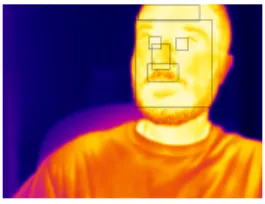
The face detection algorithm was trained with RGB images, as a result the detec-tor does not always work when using a thermal image. Therefore, we developed a program, which enables us to manually select the face region in the first frame and it is then tracked for the entire duration of the interaction. Once the face region was determined, the 68 feature points can be localized on the face and the ROIs can be defined (see also Fig. 2):
– the entire face: a region that covers the entire face.
– the forehead: a region with a width equal to the distance between the middle of the two eyebrows, and a height of 50 pixels.
– the left, and right periorbital region: a region with a size of 15x15 pixels around the inner corner of each eye.
– the perinasal region: a region defined between the corners of the nose and the distance between the tip of the nose and the upper lip.
– the nose: a region defined between the corners of the nose and the distance between the tip of the nose and the root of the nose.
Fig. 2: ROIs in the thermal data. Temperatures range from 20◦C in dark purple to 40◦C in light yellow
From each of these regions the average temperature was extracted. Our pre-vious work [13] shows that there are 3 ROIs that need more consideration when performing the analysis. These regions are: the two periorbital regions and the entire face. One problem that was encountered was the presence of glasses. As the glasses do not transfer the heat from the face, their temperature is lower than the rest of the face. Moreover, in cases when the person turns its head there might be situations when the ROIs include parts of the background. All
these values have to be discarded so that they do not influence the temperature variation. We previously found that all temperatures below 30◦C are associated with either the background or the glasses.
Once these temperatures were removed, we applied a low pass Butterworth filter (fs = 32Hz, fc = 2.24Hz) in order to eliminate temperature variations,
which are associated to the movement of the person.
4.3 Respiration
The RR was determined using the temperature variation in the perinasal region defined in Section 4.2. As previously mentioned, a respiration is composed of two phases: inspiration and expiration. The temperature variation between these two phases is of interest when computing the RR. The following procedure (based on [18]) was implemented.
First, the mean temperature from the ROI was stored in a circular buffer of 30 seconds. Once the buffer was full, the RR could be estimated. As the resting RR lies between 12-18 BPM (0.2 Hz and 0.3 Hz), a Butterworth bandpass filter was applied in order to eliminate all other frequencies. Before applying a Fast Fourier Transform (FFT) on the signal a Hann window function was performed. Using the maximum frame rate of the camera, i.e., 32 Hz, and a duration of 30 seconds, a maximum resolution of 2 BPM (0.033 Hz) can be obtained. In order to improve this resolution, a quadratic interpolation was applied on the maximum magnitude and its neighbors of the frequency spectrum, which resulted after applying the FFT. The RR corresponds to the index of the maximum magnitude after applying the interpolation.
4.4 AUs
The detection of AUs can provide valuable input on the emotional state of a per-son. The module for AU detection was previously developed in our laboratory. The detector was trained using the CMU-Pittsburgh AU-Coded Face Expres-sion Image Database [24]. The database consists of 2105 image sequences from 182 adult subjects of varying ethnicity, which perform multiple tokens of most primary FACS action units. For the training, a support vector machine was used and the OpenCV Viola Jones face detection algorithm. Our detector is capa-ble of detecting the following AUs: AU1 (inner brow raiser), AU2 (outer brow raiser), AU4 (brow lowerer), AU5 (upper lid raiser), AU6 (cheek raiser), AU7 (lid tighten), AU12 (lip corner puller), AU15 (lip corner depressor), AU20 (lip stretcher), AU23 (lip tighten), and AU25 (lips part).
Given a video frame, the detector provides the prediction confidence for each of the previously mentioned AUs. By applying an empirically found threshold we select only the relevant AUs in that frame. Once this is accomplished we can know the emotional state of a person. Given the detected AUs, we are able to detect the following emotions [20]: surprise (AU1 + AU2 + AU5 + AU26 - jaw drop), fear (AU1 + AU2 + AU4 + AU5 + AU20 + AU25), happiness (AU6 + AU12), and sadness (AU6 + AU15).
5
Results
The algorithms previously described have been tested on 3 different data sets. The first data set was recorded during a demo that we performed with two participants at a care facility (Lace Housing, UK), part of the ENRICHME project. The two participants (P1, P2) are older people who interacted with the Kompa¨ı robot through a tablet mounted on the torso of the robot. As the two cameras (RGB-D, and thermal) were mounted on the head of the robot, the participants did not look directly at them.
The second and third datesets were recorded during two experiments that we performed in our laboratory for detecting deception. For the second dataset, the participants (P3 - P5) interacted with the same Kompa¨ı robot, in an interview-like scenario. Therefore, all participants looked directly at the two cameras which were mounted below the head of the robot. The age of the participants varied between 20 and 40 years old. The last dataset used was recorded while the Meka M1 robot gave the instructions for the participants (P6 - P9) in a pen and paper task. The cameras were positioned on the table in front of the participants, while the robot was positioned a little on the participants’ right side. Due to this positioning none of the participants looked directly at the cameras. All participants showed increased head movement during the interactions. Some of them had facial hair, while others wore glasses. We encouraged them to leave the glasses on, as we did not want to induce further stress.
Table 1: Blinking rate and respiration rate results
Participant Recording duration [seconds] BR manual annotation [blinks] BR1 [blinks] BR2 [blinks] RR [BPM] P1 120 16 29 16 16.87 P2 120 24 53 37 17.72 P3 147 95 108 78 11.78 P4 145 141 160 30 19.02 P5 134 29 53 74 27.58 P6 125 35 43 21 13.58 P7 110 23 101 73 12.24 P8 125 17 17 72 18.73 P9 105 12 19 52 22 5.1 Blinking
For testing our blinking algorithms we determined the mean distance for each eye and saved all the distances in a file. The processing was performed offline. We manually annotated the data (column BR manual annotation in Table 1) and compared it with the first blinking detection algorithm (column BR1), as
well as with the second blinking detection algorithm (column BR2). As it can be seen, the first algorithm did not perform as well as the second in the case of older participants (P1, and P2). Neither of the two algorithms was able to detect all blinks, which can be explained by the movement of the participants or by the fact that most of them had the tendency to look downwards. However, for the first algorithm, the mean difference between the ground truth and the detected blinks (18.55) is half of that corresponding to the second algorithm (38.33).
(a) Input signal for the right eye (b) Blinks detected for the right eye
Fig. 3: Blinking results
5.2 Thermal data
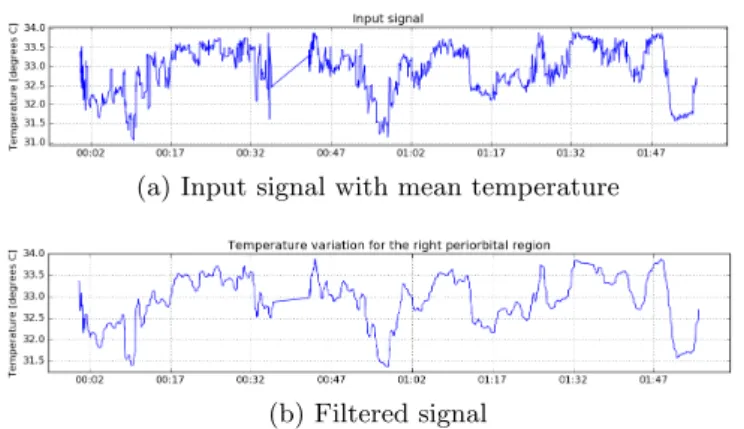
Thermal data variation in different ROIs on the face is a good indicator of the internal state of a person. Given an input signal of the mean temperature in a region (Fig. 4a), by applying a low-pass Butterworth filter, a smoother version of the signal can be obtained. Using a linear regression the general trend of the signal can be obtained. Temperature increase in the periorbital region could be an indicator of anxiety [11].
5.3 Respiration
The results given by the respiration module are shown in Table 1. As no physi-cal sensors were used, these results cannot be compared with the real RR of the participants. Figure 5a represents the input signal composed of the mean tem-perature values in the perinasal region of one of the participants. The output of the algorithm is displayed in Fig. 5b. The index corresponding to the maximum value after applying the interpolation gives the respiration rate. This point is represented in the figure, with the text label “Maximum”.
(a) Input signal with mean temperature
(b) Filtered signal
Fig. 4: Temperature variation analysis
(a) Input signal with mean temperature (b) Interpolated signal
Fig. 5: RR computing steps
5.4 AUs
As the database with which the AU detector was trained was composed of adults, AUs are not properly detected in case of older people. A person can be detected as being sad (due to the presence of AU4 and AU15), when actually the person is neutral. This problem appears due to the presence of wrinkles.
6
Discussion
In a HRI scenario, in order to ensure a natural interaction the robot needs to know the internal emotional state of the person it interacts with. The algorithms presented in this paper enable a robot to estimate that state. All the modules were developed using ROS and have been tested on different robots in our lab-oratory (i.e., Meka M1 and the Kompa¨ı robots). The results of the blinking detection algorithm show that in a real scenario, where a person is not forced
to look directly at the camera, this can be very challenging. The person might move its head, the distance between the camera and the person can change, or the person could be looking downwards. An adaptive algorithm could provide a better performance than the algorithm we have used. Moreover, a mobile pan-tilt platform could be used to enable the cameras mounted on the robot to follow the gaze of a person.
In order to ensure ourselves that the results we get are in accordance with the real physiological parameters we are planning to perform a series of experiments in which to compare the values given by our physiological parameters analysis modules with the values given by physical sensors. However, our camera sensors are not considered medical devices as per the definition given by the EEC Council Directive 93/422
The temperature variation module, in its current state, does not work in a real-time interaction. The analysis can be performed only offline. One way to improve this can be to perform the analysis every 20-30 seconds. This could enable the robot to know if there are important changes in the facial temperature of the person it interacts with.
7
Conclusion and Future work
In conclusion, we have presented a series of algorithms that have been applied to extract and analyze physiological parameters (i.e., BR, RR, temperature varia-tion across different ROIs on the face, and AUs). These algorithms have been used to detect the internal state of participants in experiments carried out in our laboratory. Some of our future work includes to perform a mapping between the RGB-D and thermal cameras, for face detection and feature points detec-tion. Moreover, we plan to train a new AU detector based on the facial features provided by the Dlib library. This could enable us to detect multiple AUs.
Acknowledgments
This work was funded and done in the context of the EU Horizon2020 EN-RICHME project, Grant Agreement No: 643691
References
1. Chevalier, P., et.al.: Impact of sensory preferences of individuals with autism on the recognition of emotions expressed by two robots, an avatar, and a human. Autonomous Robots, Special Issue on Assistive and Rehabilitation Robotics (2016) 2. Tapus, A., et.al.: Exploratory study: Children’s with autism awareness of being
imitated by nao robot. Interaction Studies (2012)
3. Tapus, A., et.al.: Improving the quality of life of people with dementia through the use of socially assistive robots. Proceedings of the 1st International Symposium on Quality of Life Technology Intelligent Systems for Better Living (2009)
2
4. Mataric, M., Tapus, A., Winstein, C., Eriksson, J.: Socially assistive robotics for stroke and mild tbi rehabilitation. Advanced Technologies in Rehabilitation (2009) 5. Hernandez, J., et.al.: Bioglass: Physiological parameter estimation using a
head-mounted wearable device. Proceedings of Wireless Mobile Communication and Healthcare (2014)
6. Hernandez, J., et.al.: Bioinsights: Extracting personal data from ’still’ wearable motion sensors. 12th IEEE International Conference on Wearable and Implantable Body Sensor Networks (BSN) (2015)
7. Hart, W.M.: The eyelids. In: Adler’s Physiology of the Eye. Mosby, ??? (1992) 8. Bentivoglio, A.R., et.al.: Analysis of blink rate patterns in normal subjects.
Move-ment disorders (1997)
9. Tanaka, Y., Yamaoka, K.: Blink activity and task difficulty. Perceptual and Motor Skills (1993)
10. Abouelenien, M., et.al.: Analyzing thermal and visual clues of deception for a non-contact deception detection approach. In: Proceedings of the 9th International Conference on Pervasive Technologies Related to Assistive Environments (2016) 11. Ioannou, S., Gallese, V., Merla, A.: Thermal infrared imaging in psychophysiology:
Potentialities and limits. Phychophysiology 51(10), 951–963 (2014)
12. Sorostinean, M., Ferland, F., Tapus, A.: Reliable stress measurement using face temperature variation with a thermal camera in human-robot interaction. In: 15th IEEE-RAS International Conference on Humanoid Robots, Humanoids (2015) 13. Agrigoroaie, R., Ferland, F., Tapus, A.: The enrichme project: Lessons learnt from
a first interaction with the elderly. ICSR2016 (2016)
14. Fei, J., Pavlidis, I.: Virtual thermistor. 29th Annual International Conference of the IEEE Engineering in Medicine and Biology Society - EMBS (2007)
15. Merritt, C.R., et.al.: Textile-based capacitive sensors for respiration monitoring. IEEE Sensors Journal (2009)
16. Park, S.-B., et.al.: An improved algorithm for respiration signal extraction from electrocardiogram measured by conductive textile electrodes using instantaneous frequency estimation. Medical and Biological Engineering and Computing (2008) 17. Barbosa-Pereira, C., et.al.: Remote monitoring of breathing dynamics using
in-frared thermography. 37th Annual International Conference of the IEEE Engi-neering in Medicine and Biology Society - EMBS (2015)
18. Chauvin, R., et.al.: Contact-free respiration rate monitoring using a pan-tilt ther-mal camera for stationary bike telerehabilitation sessions. IEEE Systems Journal (2014)
19. Ekman, P., Friesen, W.V.: Facial action coding system. In: Palo Alto, CA: Con-sulting Phychologists Press (1978)
20. Ekman, P., et.al.: Facial Action Coding System - Investigator’s Guide, p. 174. Research Nexus, Salt Lake City - USA, ??? (2002)
21. Quigley, M., et.al.: Ros: an open-source robot operating system. In: ICRA Work-shop on Open Source Software (2009)
22. King, D.: Dlib-ml: A machine learning toolkit. In: Journal of Machine Learning Research, vol. 10, pp. 1755–1758 (2009)
23. Yu, B., et.al.: Estimate of the optimum cutoff frequency for the butterworth low-pass digital filter. In: Journal of Applied Biomechanics (1999)
24. Kanade, T., et.al.: Comprehensive database for facial expression analysis. Proceed-ings of the International Conference on Automatic Face and Gesture Recognition, 46–53 (2000)
![Table 1: Blinking rate and respiration rate results Participant Recording duration [seconds] BR manualannotation[blinks] BR1 [blinks] BR2 [blinks] RR [BPM] P1 120 16 29 16 16.87 P2 120 24 53 37 17.72 P3 147 95 108 78 11.78 P4 145 141 160 30 19.02 P5 134 29](https://thumb-eu.123doks.com/thumbv2/123doknet/7772700.257188/8.892.239.681.629.841/blinking-respiration-results-participant-recording-duration-seconds-manualannotation.webp)