Working paper
Effect of a French Experiment of Team Work
between General Practitioners and Nurses
on Efficacy and Cost of Type 2 Diabetes
Patients Care
Julien Mousquès (Irdes, Prospere)
Yann Bourgueil (Irdes, Prospere)
Philippe Le Fur (Irdes, Prospere)
Engin Yilmaz (Drees)
January 2010
DT n° 29
Institut de recherche et documentation en économie de la santé No copying allowed in other websites, but direct link to the document is authorized:
www.irdes.fr • Tél: 01 53 93 43 02 • Fax: 01 53 93 43 07 • E-mail: [email protected]
l Director of publication: Caherine Sermet l Scientific adviser: Thierry Debrand
l Copy editing: Franck-Séverin Clérembault - Anne Evans l Layout compositor: Khadidja Ben Larbi
Effect of a French Experiment of Team Work between General Practitioners and
Nurses on Efficacy and Cost of Type 2 Diabetes Patients Care
Julien Mousquèsa,b*, Yann Bourgueila,b, Philippe Le Fura,b, Engin. Yilmazc
Abstract
This study aims to assess the efficacy and the cost of a French team work experiment between nurses and GPs for the managing of type 2 diabetes patients. Our study was based on a case control study design in which we compare the evolution of process (standard follow-up procedures) and final outcomes (glycemic control), and the evolution of cost. The study is realized for two consecutive periods between type 2 diabetes patients followed within the team work experiment (intervention group) or by “standard” GPs (controlled group).
After 11 months of follow-up, we showed that patients in the intervention group, compared with those in the controlled group, have more chances to remain or to become: correctly followed-up (with OR comprise between 2.1 to 6.8, p<=5%) and under glycemic control (with OR comprise between 1.8 to 2.7, p<=5%). The latter result is obtained only when a visit for education and counselling has been delivered by a nurse in supplement to systematic electronic patient registry and electronic clinical GPs reminder. All these results are obtained without difference in costs between the intervention and the controlled groups.
Finally, this experimentation of team working can be considered both effective and efficient. Our findings may have implications in the design of future larger primary care team work experiments to be launched by French health authorities.
Keywords: Primary health care, Diabetes mellitus, Health care team, Comparative study, Outcome and process assessment, Cost analysis.
Classification/JEL Codes: I12
a
Institute for research and information in health economics (IRDES), Paris.
b
Interdisciplinary Partnership for Research on the Organisation of Primary Care (PROSPERE), Paris.
c
Ministry of Health’ Directorate for Research, Analysis, Evaluation and Statistics (DREES).
* Corresponding author. IRDES, 10 rue Vauvenargues, 75018 Paris, France. Tel.:+33 153934362; fax: +33 153934350. E-mail address: [email protected]
Résumé
Cette étude a pour objectif d’évaluer l'efficacité et les coûts d'une expérimentation de travail en équipe entre des infirmières et des généralistes (l’expérimentation Action Santé Libérale En Equipe (ASALEE)), dans le cas de la prise en charge des patients souffrant de diabète de type 2.
Elle s’appuie sur un design cas/témoin dans lequel nous comparons l'évolution des résultats de soins en termes de processus (procédures standards de suivi) et de résultat final (le contrôle glycémique), ainsi qu’en termes de coûts. Cette comparaison est réalisée entre deux périodes consécutives et entre des patients diabétiques de type 2 suivis dans l'expérimentation (le groupe d'intervention) ou dans le groupe témoin (le groupe contrôle).
Nous montrons qu'après onze mois de suivi, les patients ASALEE, comparés à ceux du groupe témoin, ont une plus grande probabilité de rester ou devenir bien suivis en termes d’indicateurs de processus (OR compris entre 2.1 à 6.8, p < 5 %), ainsi qu’en termes de contrôle glycémique (OR compris entre 1.8 à 2.7, p < 5 %). Ces derniers résultats sont obtenus uniquement lorsque les patients ont bénéficié d’au moins une consultation infirmière d’éducation et de conseils hygiéno-diététiques en complément du rôle classique des infirmières dans le cadre de l’expérimentation ASALEE, c’est-à-dire la mise à jour des dossiers médicaux informatisés avec l’inscription éventuelle de rappels informatiques à destination des généralistes.
Mots-clefs : soins primaires, diabète de type 2, travail en équipe, étude comparative, évaluation des résultats et des processus, analyse de coût.
1. Introduction
The improvement of the quality of care delivered by health professionals and the strengthening of primary care organization are seen as two key elements for increasing the performance of health care systems in a context of increasing demand and constraints in resources [1-6]. Thus, numerous countries have undertaken reforms that aim at improving medical practices or organizing in a different way the provision of primary or ambulatory care and services, especially for chronic patients. This requires the production of medical practice guidelines and the implementation of “evidence based medicine” in daily practice through policy intervention close to doctors and the implementation of primary care and services organisational innovations: chronic care and/or disease management, performance based economic incentives, group practice and team work [7].
Numerous systematic literature reviews are henceforth available [8-15]. Passive intervention policy, which includes the simple provision of educational material and standard education activities (e.g. conferences, congresses,...) are considered to be little effective. On the contrary, more active policy interventions have proved to be more effective. These include more advanced continuing medical education strategies (e.g. academic detailing); therapeutic information systems, audit and feedback as well as electronic reminders; and finally, all “organisational-oriented” policies. Within the latter, our concern is specifically about policies focused on teamwork and cooperation between GPs and nurses, when nurses substitute or supplement physician workforce. Most of the studies converge in their conclusions: nurses adequately trained for specific actions (e.g. prevention, first contact, follow-up of a chronic patient…) can deliver care and services at least from a same level of outcome in terms of quality – indeed superior when the nurse act in complement – and with a greater level of outcome in terms of satisfaction, than of primary care doctors [10,16,17]. The magnitude of cost saving and of efficiency gains depends on salary and productivity differentials between nurses and GPs, and possible duplication.
In France, in spite of a public debate on the levers for performance improvement at the professional or organisational levels [18-22], the recent reforms conserve an “embryonic character”. Our health system still combines a relative free and comprehensive access to care and services for insured [23,24], with a weak regulation both of professional practices and ambulatory care organisations. One can observe that the French health care system has a fragmented ambulatory care system, more than a formal primary care organisation. Most of ambulatory care professionals are self-employed and work in solo practice paid on a fee-for-service basis. They are historically not subject to constraint by any strict mandatory quality regulation, and only recently both continuing medical education and the evaluation of professional practice have become mandatory.
As a consequence, several signs of inefficiency in health care delivery have come to light; especially for chronically ill patients for whom there has been no dramatic improvement in the care delivery –
e.g. for diabetes patients [25-29] – despite their growing place in the burden of disease and the fact
that they currently consume an increasing share of the French health care system’s resources [30,31].
After all, some experiments of networks, GP group practices, skill mix and teamwork (e.g. between GPs and nurses), are supported by an increasing number of stakeholders (sickness funds, state and local representatives…) and professionals’ representatives [32, 33]. A national policy experiment in cooperation and skill mix was carried out between 2004 and 2008 [33,34]. This policy authorized ten experiments which involved mainly the transfer of: technical procedures, follow-up of chronic patients with hepatitis, prevention. Only two of them are related to ambulatory care, and one to general practice: the ASALEE experiment (Action de Santé Libérale en Equipe1).
Our general objective is to assess the efficacy and the cost of the ASALEE experiment regarding the management of type 2 diabetes patients, defined by the fact that they are treated by at least one oral anti-diabetic medication, which represents the bulk of the nurse working time2. The ASALEE experiment began in 2004 with 3 practices clustering 12 GPs and 3 nurses. In 2007, 18 practices
1
Health Action by Teams of Self-employed Health Professionals.
2
Nurses are also involve in: counseling for high blood pressure, screening for cognitive problems and cardiovascular risk factors in individuals over 75 years old, screening campaigns (breast cancer, cervix cancer, cognitive disorder).
involving 41 GPs and 8 nurses participated in the experiment. All the GPs and nurses remained in the experiment from the beginning.
Our specific objectives are: first, to assess the efficacy both regarding process (adequacy of follow-up procedures) and final (glycemic control) outcomes; second, to assess the difference of impact between two levels of nurse intervention in supplement to the GP: systematic electronic patient registry and electronic clinical reminder (level 1) combine or not with patient education and counselling (level 2); third, to assess the impact on direct costs for the National Health Insurance Funds, including additional cost generated by ASALEE experiment (i.e. nurses’ wages,...).
2. Materials and methods
For type 2 diabetes patients, the activity provided by the nurses complements the GPs’ at two levels. The first level (level 1) of intervention by the nurses is a systematic electronic patient registry of type 2 diabetes patients. This list was based on of the GPs’ electronic patient records. For all these patients, the nurses log specific information (mainly requested biological results for the follow up). If require, the nurses can introduce electronic reminders inside electronic patient records. These electronic reminders alert the GP, during the patient’s visit, the examinations to be conducted according to the national guidelines. The second level of intervention (level 2) is patient education and counselling in order to give nutritional-hygienic and treatment compliance advices. They are performed by nurses after a referral from the GP and are conditioned by an agreement from the patient.
Our evaluation design was constituted by three distinctive case control studies which compare the evolution of three dimensions of results between two consecutive periods between the intervention (ASALEE experiment) and the controlled groups (IGs vs. CGs). For the latter no nurses’ assistance in their practice was developed. The three domains assessed were: efficacy regarding process outcomes, efficacy regarding final outcome, costs. Then, IGs cases were based on three subsamples of type 2 diabetes patients followed by GPs and nurses of the ASALEE experiment – depending on the level of nurses intervention they had benefitted – between June 2004 and May 2007 and still followed in May 2007 (intention to treat study). These three IG subsamples were compared, a
posteriori, with those of three CGs. It should be noted that controlled group samples was matched to
intervention group samples at baseline, with at least an equivalent distribution in terms of age and gender. Table 1 gives the distribution of all the variables for IGs compared with the distribution in the CGs; we could observe that characteristics of type 2 diabetes patients in the IGs and in the CGs are similar.
Table1 - Descriptive statistics for ASALEE experiment (intervention group) samples n % n % n % n % Gender Woman 704 41.81 254 43.2 362 43.2 347 43.65 Men 980 58.19 334 56.8 476 56.8 448 56.35 Age* < 50 years 129 7.66 22 3.74 72 8.59 63 7.92 50-60 years 315 18.71 103 17.52 172 20.53 166 20.88 60-70 years 438 26.01 148 25.17 218 26.01 203 25.53 70-80 years 552 32.78 202 34.35 286 34.13 274 34.47 >= 80 years 250 14.85 113 19.22 90 10.74 89 11.19 Age* < 65 years 659 39.13 198 33.67 - ->= 65 years 1 025 60.87 390 66.33 -
-Type of follow-up by Public Health Nurse since
Data management (+/- electronic reminder) 987 58.61 304 51.7 435 51.91 409 51.45 Data management (+/-electronic reminder) and
visit for education and counselling 697 41.39 284 48.3 403 48.09 386 48.55 Location within the Deux-Sèvres department
North - - - - 229 27.33 218 27.42
South - - - - 609 72.67 577 72.58
Type of Mandatory Social Security Funds National Health Insurance Fund for salaried
salaried employees - - - - 611 72.91 572 71.95
National Health Insurance Fund for farmers
workers - - - - 227 27.09 223 28.05
Waves of inclusion (in 4 classes)**
June 2004 to March 2005 348 20.67 - - 188 22.43 185 23.27
April 2005 to January 2006 255 15.14 - - 122 14.56 115 14.47
February 2006 to June 2006 302 17.93 - - 146 17.42 139 17.48
July 2006 to May 2007 779 46.26 - - 382 45.58 356 44.78
Waves of inclusion (in 3 classes)**
June to December 2004 - - 184 31.29 - - -
-February to July 2005 - - 171 29.08 - - -
-January to June 2006 - - 233 39.63 - - -
-Total 1 684 100 588 100 838 100 795 100
Cost Study population regarding the nature of the assessment Efficacy according to
the intermediate outcome measure (glycemic control)
Efficacy according to the process outcomes
measures (follow-up procedures) Eligible Population
* Due to technical consideration number of age classes were dependent on the nature of assessment ** Due to technical consideration number of waves classes were dependent on the nature of assessment
The first efficacy evaluation was based on the analysis of the evolution between two consecutive periods – between July 2005-June 2006 (t-1) and between July 2006-June 2007 (t) –, of process outcome measures, which corresponds to the probabilities of becoming or still be adequately followed-up, over one year, for six standard follow-up procedures recommended by the French National Authority in Health guidelines. According to these guidelines, the rate of HbA1c of patients suffering from diabetes must be controlled at least three times a year and they must also be subjected to a biological examination every year (creatinemia, microalbuminuria, lipid check-up), to an electrocardiogram or to a consultation with a cardiologist, and funduscopy. 838 type 2 diabetes patients in the intervention group were compared with those of 1018 type 2 diabetes patients in the controlled group (i.e. followed by standard GPs, without any nurse intervention in their practice). The ASALEE experiment is considered efficient if the proportion of patients that become or still be adequately followed-up over one year is greater than in the controlled group. We particularly look at the difference of impact between the two levels of nurse’s intervention within the ASALEE experiment.
We have used logistic regressions to model probabilities of becoming or still be followed correctly over one year for the six procedures (HbA1c, microalbuminuria, funduscopy, creatinemia, electrocardiogram, lipid check-up) and between the CG and the IG. For the patient in the latter we take in consideration whether or not the participants have had nurse visits for education and counselling. The results were controlled by: age (less than 49, from 50 to 59, from 60 to 69, from 70 to 79, over 80), gender (female or male), location within the Deux-Sèvres department (north, south), type of Mandatory Social Security Funds (salaried employees, farmer workers), the presence or not of medicated treatments indicating lipid problems and/or diabetes complications, the type of medicine treatment for diabetes (one oral antidiabetic drug, the association of two oral antidiabetic drugs, the association of oral antidiabetic drug and insulin).
The second efficacy evaluation was based on the analysis of the evolution over one year of the efficacy through final outcomes: the probabilities, before and after the intervention, of maintaining one’s glycosylated haemoglobin3 (HbA1c) or reducing it to a level below or equal to three different thresholds: 6.5%, 7%, 8%. Measuring HbA1c before and after the intervention of the nurses was performed for 588 patients of the ASALEE experiment. The evolution of HbA1c was compared to that of a control group of 202 type 2 diabetes patients followed by a panel of standard GPs (with no nurses intervention in their practices)4. The ASALEE experiment is considered efficient if the proportion of patients under glycemic control improve, over one year, greater than in the controlled group. We particularly look at the difference of impact between the two levels of nurse’s intervention within the ASALEE experiment.
We used logistic regressions to model probabilities of maintaining or reducing HbA1c, before-and-after the intervention, regarding the three different thresholds of glycemic control and between the CG and the IG. For the latter we take in consideration whether or not the patients have had nurse visits for education and counselling. The results were controlled by: age (under 65, over 65), gender (woman versus man), the HbA1c status (value at baseline, number of HbA1c tests performed in the year following inclusion, number of months separating the measurements before-and-after) and seasonality (waves of inclusion: June 2004 to March 2005, April 2005 to January 2006, February 2006 to June 2006, July 2006 to May 2007).
Finally, the cost evaluation concerns the analysis of the evolution between two consecutive years – between July 2005-June 2006 period (t-1) and between July 2006-June 2007 period (t) – of the type 2 diabetes direct costs for National Health Insurance Funds both for the IG and for the CG. The costs analyses were based on claims data and we distinguished the total expenditure for all procedures –
i.e. all the direct cost for type 2 diabetes patients (hospital and ambulatory care procedures where
include) reimbursed by the National Health Insurance Funds – and total expenditure specific to type 2 diabetes. These latter included all the direct costs allocated to diabetes by using the coding of medical procedures and services stemming from claims data: all the expenses of following up diabetes, including those related to the risk factors of diabetes (e.g. visits or treatment for smoking cessation) and its complications (e.g. treatment for ischemic cardiopathy).
The evolution of theses costs were compared between the IG, 795 type 2 diabetes patients, and the CG, 956 type 2 diabetes patients followed by “standard” GPs (with no NURSES intervention in their practice). It should be noted first that the cost for ASALEE patients is increased by the expenses specific to the experiment (nurses’ salaries, training expenses, etc.), i.e. €60/yr per patient.
We used a linear regression model in order to compute total and specific to diabetes costs in t according to the t-1 expenditures, between the IG and the CG and controlled by the following confounders: age (< 50 years old, 50-60 years old, 60-70 years old, 70-80 years old, > 80 years old), gender (woman or man), location within the department (north, south), type of Mandatory Social Security Scheme (salaried/employees or farmers people), the presence of treatment indicating lipid troubles and/or cardiovascular complications of diabetes (present or not), type of medicinal treatment
3
Glycosylated haemoglobin, glycated haemoglobin or more simply blood sugar provides the measurement of red blood cells fixing glucose in the haemoglobin of the organism. This concentration depends on cumulated variations of glycemia (rate of glucose in the blood) during the last 3-4 months. HbA1c expresses the glycemic control of a type 2 diabetes patient. This is why it is recommended to dose it every three months. In a non-diabetic individual, less than 6% of haemoglobin is glycated.
4
The panel was called General Medicine Observatory (Observatoire de la médecine générale – http://omg.sfmg.org ) of the French Society of general medicine (Société Française de Médecine Générale – http://www.sfmg.org/).
for diabetes (one oral antidiabetic drug, the association of two oral antidiabetic drugs, the association of oral antidiabetic drug and insulin), hospitalization (at least one hospitalization in t-1, at least one hospitalization in t, at least one hospitalization in t and in t-1, none).
3. Results
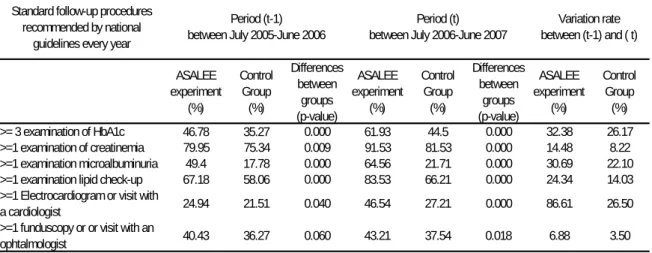
Descriptive statistics show that type 2 diabetes patients included in the experiment ASALEE are significantly better followed than other control patients, for all the process outcomes retained at the two consecutive periods , and that the improvement between the two periods is greater for them (Cf. Table 2).
Table 2 - Descriptive statistics at baseline (t-1) and over one year (t) for efficacy according to process outcomes measures (follow-up procedures) between intervention and control groups
Standard follow-up procedures recommended by national
guidelines every year
ASALEE experiment (%) Control Group (%) Differences between groups (p-value) ASALEE experiment (%) Control Group (%) Differences between groups (p-value) ASALEE experiment (%) Control Group (%) >= 3 examination of HbA1c 46.78 35.27 0.000 61.93 44.5 0.000 32.38 26.17 >=1 examination of creatinemia 79.95 75.34 0.009 91.53 81.53 0.000 14.48 8.22 >=1 examination microalbuminuria 49.4 17.78 0.000 64.56 21.71 0.000 30.69 22.10 >=1 examination lipid check-up 67.18 58.06 0.000 83.53 66.21 0.000 24.34 14.03 >=1 Electrocardiogram or visit with
a cardiologist 24.94 21.51 0.040 46.54 27.21 0.000 86.61 26.50
>=1 funduscopy or or visit with an
ophtalmologist 40.43 36.27 0.060 43.21 37.54 0.018 6.88 3.50
Period (t-1) between July 2005-June 2006
Period (t) between July 2006-June 2007
Variation rate between (t-1) and ( t)
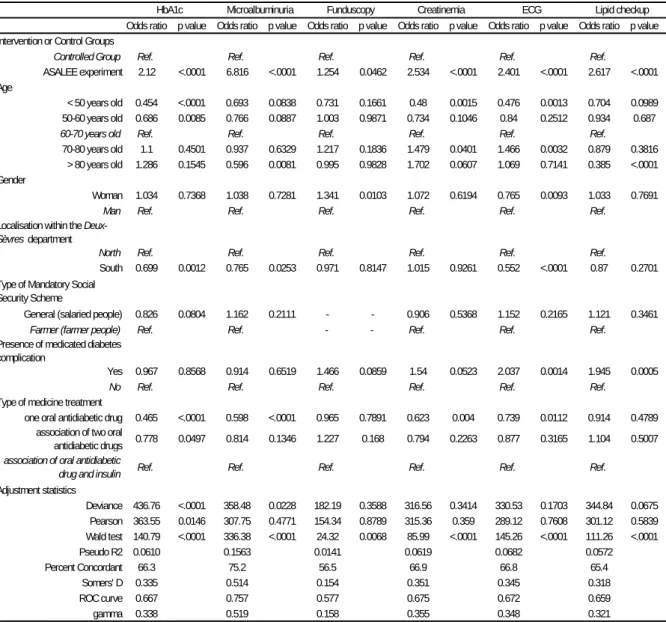
Logistics models confirm this fact (see Table 3) and we therefore observe, ceteris paribus, that a type 2 diabetes patient followed up in the ASALEE experiment has, depending on procedures, 2.1 to 6.8 times more chances than one followed-up by another “standard” GP of remaining or becoming well followed-up over one year (OR equals 2.1 for HbA1c to 6.8 for microalbuminuria tests).
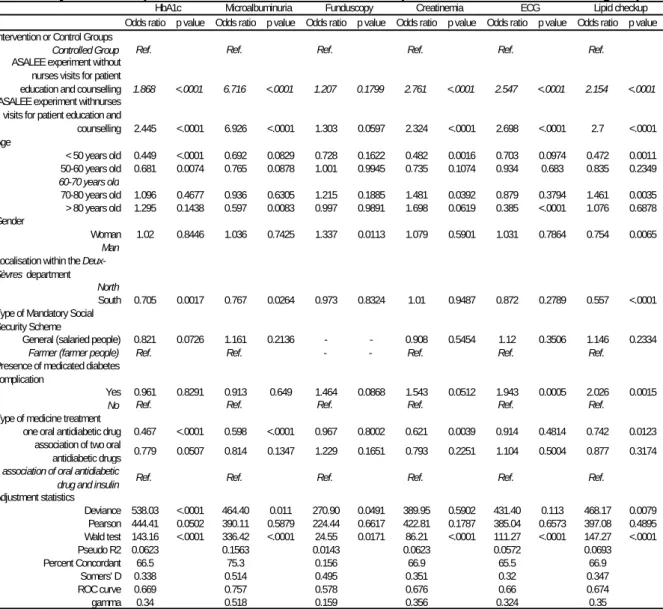
The fact that a type 2 diabetes patient within the IG benefits from a visit for education and counselling provided by nurses – 44% of patients were concerned – does not increase dramatically these odd-ratios, even if they all increase except for carrying out creatinemia measurements (see Table 4).
Table 3 - Modelling of the efficacy according to process outcomes measures (follow-up procedures)
Odds ratio p value Odds ratio p value Odds ratio p value Odds ratio p value Odds ratio p value Odds ratio p value Intervention or Control Groups
Controlled Group Ref. Ref. Ref. Ref. Ref. Ref.
ASALEE experiment 2.12 <.0001 6.816 <.0001 1.254 0.0462 2.534 <.0001 2.401 <.0001 2.617 <.0001 Age
< 50 years old 0.454 <.0001 0.693 0.0838 0.731 0.1661 0.48 0.0015 0.476 0.0013 0.704 0.0989 50-60 years old 0.686 0.0085 0.766 0.0887 1.003 0.9871 0.734 0.1046 0.84 0.2512 0.934 0.687
60-70 years old Ref. Ref. Ref. Ref. Ref. Ref.
70-80 years old 1.1 0.4501 0.937 0.6329 1.217 0.1836 1.479 0.0401 1.466 0.0032 0.879 0.3816 > 80 years old 1.286 0.1545 0.596 0.0081 0.995 0.9828 1.702 0.0607 1.069 0.7141 0.385 <.0001 Gender
Woman 1.034 0.7368 1.038 0.7281 1.341 0.0103 1.072 0.6194 0.765 0.0093 1.033 0.7691
Man Ref. Ref. Ref. Ref. Ref. Ref.
Localisation within the
Deux-Sèvres department
North Ref. Ref. Ref. Ref. Ref. Ref.
South 0.699 0.0012 0.765 0.0253 0.971 0.8147 1.015 0.9261 0.552 <.0001 0.87 0.2701 Type of Mandatory Social
Security Scheme
General (salaried people) 0.826 0.0804 1.162 0.2111 - - 0.906 0.5368 1.152 0.2165 1.121 0.3461
Farmer (farmer people) Ref. Ref. - - Ref. Ref. Ref.
Presence of medicated diabetes complication
Yes 0.967 0.8568 0.914 0.6519 1.466 0.0859 1.54 0.0523 2.037 0.0014 1.945 0.0005
No Ref. Ref. Ref. Ref. Ref. Ref.
Type of medicine treatment
one oral antidiabetic drug 0.465 <.0001 0.598 <.0001 0.965 0.7891 0.623 0.004 0.739 0.0112 0.914 0.4789 association of two oral
antidiabetic drugs 0.778 0.0497 0.814 0.1346 1.227 0.168 0.794 0.2263 0.877 0.3165 1.104 0.5007
association of oral antidiabetic
drug and insulin Ref. Ref. Ref. Ref. Ref. Ref.
Adjustment statistics Deviance 436.76 <.0001 358.48 0.0228 182.19 0.3588 316.56 0.3414 330.53 0.1703 344.84 0.0675 Pearson 363.55 0.0146 307.75 0.4771 154.34 0.8789 315.36 0.359 289.12 0.7608 301.12 0.5839 Wald test 140.79 <.0001 336.38 <.0001 24.32 0.0068 85.99 <.0001 145.26 <.0001 111.26 <.0001 Pseudo R2 0.0610 0.1563 0.0141 0.0619 0.0682 0.0572 Percent Concordant 66.3 75.2 56.5 66.9 66.8 65.4 Somers' D 0.335 0.514 0.154 0.351 0.345 0.318 ROC curve 0.667 0.757 0.577 0.675 0.672 0.659 gamma 0.338 0.519 0.158 0.355 0.348 0.321
HbA1c Microalbuminuria Funduscopy Creatinemia ECG Lipid checkup
Table 4 - Regression results for the logistic model of becoming or still be followed correctly over one year for six procedures between the ASALEE experiment and the controlled groups
Odds ratio p value Odds ratio p value Odds ratio p value Odds ratio p value Odds ratio p value Odds ratio p value Intervention or Control Groups
Controlled Group Ref. Ref. Ref. Ref. Ref. Ref.
ASALEE experiment without nurses visits for patient
education and counselling 1.868 <.0001 6.716 <.0001 1.207 0.1799 2.761 <.0001 2.547 <.0001 2.154 <.0001
ASALEE experiment withnurses visits for patient education and
counselling 2.445 <.0001 6.926 <.0001 1.303 0.0597 2.324 <.0001 2.698 <.0001 2.7 <.0001 Age < 50 years old 0.449 <.0001 0.692 0.0829 0.728 0.1622 0.482 0.0016 0.703 0.0974 0.472 0.0011 50-60 years old 0.681 0.0074 0.765 0.0878 1.001 0.9945 0.735 0.1074 0.934 0.683 0.835 0.2349 60-70 years old 70-80 years old 1.096 0.4677 0.936 0.6305 1.215 0.1885 1.481 0.0392 0.879 0.3794 1.461 0.0035 > 80 years old 1.295 0.1438 0.597 0.0083 0.997 0.9891 1.698 0.0619 0.385 <.0001 1.076 0.6878 Gender Woman 1.02 0.8446 1.036 0.7425 1.337 0.0113 1.079 0.5901 1.031 0.7864 0.754 0.0065 Man
Localisation within the
Deux-Sèvres department North
South 0.705 0.0017 0.767 0.0264 0.973 0.8324 1.01 0.9487 0.872 0.2789 0.557 <.0001 Type of Mandatory Social
Security Scheme
General (salaried people) 0.821 0.0726 1.161 0.2136 - - 0.908 0.5454 1.12 0.3506 1.146 0.2334
Farmer (farmer people) Ref. Ref. - - Ref. Ref. Ref.
Presence of medicated diabetes complication
Yes 0.961 0.8291 0.913 0.649 1.464 0.0868 1.543 0.0512 1.943 0.0005 2.026 0.0015
No Ref. Ref. Ref. Ref. Ref. Ref.
Type of medicine treatment
one oral antidiabetic drug 0.467 <.0001 0.598 <.0001 0.967 0.8002 0.621 0.0039 0.914 0.4814 0.742 0.0123 association of two oral
antidiabetic drugs 0.779 0.0507 0.814 0.1347 1.229 0.1651 0.793 0.2251 1.104 0.5004 0.877 0.3174
association of oral antidiabetic
drug and insulin Ref. Ref. Ref. Ref. Ref. Ref.
Adjustment statistics Deviance 538.03 <.0001 464.40 0.011 270.90 0.0491 389.95 0.5902 431.40 0.113 468.17 0.0079 Pearson 444.41 0.0502 390.11 0.5879 224.44 0.6617 422.81 0.1787 385.04 0.6573 397.08 0.4895 Wald test 143.16 <.0001 336.42 <.0001 24.55 0.0171 86.21 <.0001 111.27 <.0001 147.27 <.0001 Pseudo R2 0.0623 0.1563 0.0143 0.0623 0.0572 0.0693 Percent Concordant 66.5 75.3 0.156 66.9 65.5 66.9 Somers' D 0.338 0.514 0.495 0.351 0.32 0.347 ROC curve 0.669 0.757 0.578 0.676 0.66 0.674 gamma 0.34 0.518 0.159 0.356 0.324 0.35
HbA1c Microalbuminuria Funduscopy Creatinemia ECG Lipid checkup
Ref.: modality of reference
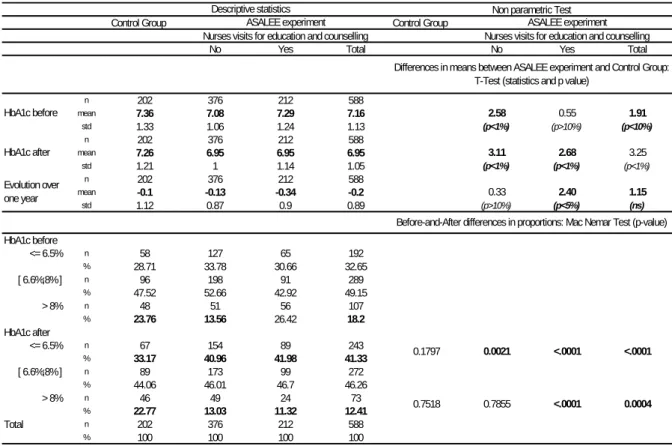
With respect to the evolution of HbA1c value over one year, descriptive statistics and t-test (see Table 5) show that the type 2 diabetes patients enrolled in the ASALEE experiment, and who experienced a visit for education and counselling, had a statistically significant greater percentage point reduction in their HbA1c level (-0.34) than that of ASALEE patient without any nurses visits (-0.13) and of control group patients (-0.1).
Table 5 - Before and after descriptive statistics for efficacy according to the final outcome measure (glycemic control) for the ASALEE experiment and the controlled groups
Control Group Control Group
No Yes Total No Yes Total
n 202 376 212 588 mean 7.36 7.08 7.29 7.16 2.58 0.55 1.91 std 1.33 1.06 1.24 1.13 (p<1%) (p>10%) (p<10%) n 202 376 212 588 mean 7.26 6.95 6.95 6.95 3.11 2.68 3.25 std 1.21 1 1.14 1.05 (p<1%) (p<1%) (p<1%) n 202 376 212 588 mean -0.1 -0.13 -0.34 -0.2 0.33 2.40 1.15 std 1.12 0.87 0.9 0.89 (p>10%) (p<5%) (ns) HbA1c before <= 6.5% n 58 127 65 192 % 28.71 33.78 30.66 32.65 [ 6.6%;8% ] n 96 198 91 289 % 47.52 52.66 42.92 49.15 > 8% n 48 51 56 107 % 23.76 13.56 26.42 18.2 HbA1c after <= 6.5% n 67 154 89 243 % 33.17 40.96 41.98 41.33 [ 6.6%;8% ] n 89 173 99 272 % 44.06 46.01 46.7 46.26 > 8% n 46 49 24 73 % 22.77 13.03 11.32 12.41 Total n 202 376 212 588 % 100 100 100 100 0.7518 0.7855 <.0001 0.0004
Differences in means between ASALEE experiment and Control Group: T-Test (statistics and p value)
HbA1c before HbA1c after Evolution over one year
Before-and-After differences in proportions: Mac Nemar Test (p-value)
0.1797 0.0021 <.0001 <.0001
Descriptive statistics Non parametric Test
ASALEE experiment ASALEE experiment
Nurses visits for education and counselling Nurses visits for education and counselling
Notes: p value in bold are significant (p<10%)
The specific effect of the level 2 nurse intervention on the improvement of the glycemic control, within the ASALEE experiment and compared to the control group, is confirmed by the results of logistic models (see Table 6).
We observe that the probability of maintaining one’s HbA1c or reducing it to 8% or less over one year is 1.8 times greater for the type 2 diabetes patients in the ASALEE group than for those in the control group (OR=1.8 for p<5%), ceteris paribus. Nevertheless, when seeking a more stringent judgement criterion, i.e. when the HbA1c threshold chosen is 6.5% or 7%, no significant differences were observed between the two groups.
That being said, when ASALEE patients are distinguished according to whether they were given at least one visit for education and counselling performed by nurses, there is a very significant improvement of glycemic control in the intervention group compared to the control group. We observed that the highest probability of having a HbA1c rate maintained at the same level or reduced to 8% or less over one year only significantly concerned patients who had had at least one therapeutic education (OR=2.7, p<1%). Moreover, the result is robust when applying a more stringent judgement criterion, i.e. an HbA1c threshold reduced to 6.5% or 7% (OR equal to 1.6 and 1.8 respectively with p≤5%).
Table 6 - Regression results for the logistic model of maintaining or reducing HbA1c, before-and-after the intervention, regarding the three different thresholds of glycemic control, between the ASALEE experiment and the controlled groups
Odds ratio p value Odds ratio p value Odds ratio p value Odds ratio p value Odds ratio p value Odds ratio p value Intervention or Control Groups
Controlled Group Ref. Ref. Ref. Ref. Ref. Ref.
ASALEE experiment 1.335 0.1744 1.199 0.3747 1.753 0.0206 or
ASALEE experiment without patient education and counselling
performed by PHN 1.152 0.5339 1.022 0.9223 1.368 0.2388
ASALEE experiement with patient education and counselling performed by PHN
1.803 0.0258 1.628 0.0572 2.673 0.0022 Age
< 65 years old 1.502 0.0349 1.178 0.389 0.924 0.742 1.538 0.0264 1.19 0.3599 0.899 0.6593
>= 65 years old Ref. Ref. Ref. Ref. Ref. Ref.
Gender
Woman 0.734 0.0907 0.988 0.9477 1.155 0.5319 0.713 0.0661 0.961 0.8243 1.12 0.6237
Man Ref. Ref. Ref. Ref. Ref. Ref.
Hba1c at baseline 0.19 <.0001 0.233 <.0001 0.375 <.0001 0.186 <.0001 0.227 <.0001 0.364 <.0001 Number of Hba1c realized 0.94 0.7525 1.13 0.5272 1.021 0.9342 0.903 0.6044 1.084 0.6786 0.969 0.9027 Number of months of follow up 0.946 0.2002 0.951 0.2362 0.901 0.0576 0.947 0.2091 0.953 0.2526 0.906 0.0716 Seasonality
06/2004 - 12/2004 Ref. Ref. Ref. Ref. Ref. Ref.
02/2005 - 07/2005 0.9 0.6508 1.189 0.4355 1.221 0.4719 1.018 0.9425 1.364 0.1832 1.418 0.2214 01/2006 - 06/2006 1.707 0.0155 1.876 0.0039 1.592 0.0951 1.861 0.006 2.055 0.0013 1.787 0.0427 Adjustment statistics Deviance 715.87 0.8028 743.15 0.5534 506.06 1 720.42 0.826 752.86 0.5357 509.64 1 Pearson 3352.97 <.0001 1107.44 <.0001 646.47 0.9971 3941.26 <.0001 1185.25 <.0001 677.62 0.9821 Wald test 170.81 <.0001 168.79 <.0001 109.94 <.0001 171.50 <.0001 169.23 <.0001 110.53 <.0001 Pseudo R2 0.2974 0.2764 0.2236 0.3009 0.2803 0.2306 Percent Concordant 85.9 84.8 84.2 86,00 85,00 84.9 Somers' D 0.72 0.697 0.686 0.722 0.701 0.702 ROC curve 0.86 0.849 0.843 0.861 0.85 0.851 gamma 0.721 0.698 0.688 0.723 0.702 0.704 <= 6,5% <= 7% <= 8% <= 6,5% <= 7% <= 8%
Ref.: modality of reference
We estimated for type 2 diabetes patients total direct cost (e.g. for all procedures) and total direct cost specific to type 2 diabetes (e.g. only for procedures regarding type 2 diabetes, its risk factors and complications) between two consecutive periods: between July 2005-June 2006 (t-1) and between July 2006-June 2007 (t). It appears that the costs of ASALEE patients are equivalent to those of the patients of the controlled group for the two periods. For the total cost, they are respectively around 3.000 € in t and of 2.400 € in t-1.From the model we could conclude, ceteris paribus, in the absence of statistically significant difference in the progression of expenditure between patients followed up in ASALEE and patients of the control group. Finally, we have estimate the "theoretical" thresholds of additional cost from which we could consider that the differences in the progression of the expenditure would be significant between the ASALEE patients and those of the control group. From a step-by-step modelling and on the basis of our samples, we estimate these thresholds at 640 € for the total cost and at 470 € for the cost attributable to the diabetes, to its risk factors or to the complications.
Table 7 - Regression results for the linear regression of total costs and specific to diabetes costs in t according to the t-1 expenditures and between the ASALEE experiment and the controlled groups
Coefficient p value Coefficient p value
Intercept 2092.24 <.0001 2083.64 <.0001
Intervention or Control Groups
Controlled Group Ref - Ref
-ASALEE experiment -81.28 0.465 -60.75 0.388 expenditures in t-1 0.48 <.0001 0.46 <.0001 Age < 50 years old -504.82 0.026 -178.94 0.212 50-60 years old -111.73 0.496 22.5 0.829 60-70 years old Réf. - Réf. -70-80 years old -65.78 0.65 102.99 0.261 > 80 years old 563.87 0.005 324.13 0.011 Gender Woman -120.57 0.28 -106.51 0.132
Man Ref Ref
Localisation within the Deux-Sèvres department
Nord Ref Ref
Sud 184.18 0.142 163.81 0.039
Type of Mandatory Social Security Funds
General (salaried people) 57.62 0.644 -25.58 0.747
Farmer (farmer people) Ref Ref Presence of medicated diabetes complication
Yes 684.6 0.002 287.73 0.04
No Ref Ref
The type of medicinal treatment for diabetes
one oral antidiabetic drug -1942.58 <.0001 -1920.74 <.0001
association of two oral antidiabetic drugs -1827.36 <.0001 -1749.99 <.0001
association of oral antidiabetic drug and insulin Ref Ref Hospitalization
at least one hospitalization in t-1 -1350.82 <.0001 -517.71 <.0001
at least one hospitalization in t 3757.56 <.0001 1385.47 <.0001
at least one hospitalization in t and in t-1 2524.8 <.0001 927.66 <.0001
none Ref Ref
Adjustment statistics
R² 0.5153 - 0.4772
-R² adjusted 0.5111 - 0.4727
-Total costs in t Total cost in t specific to diabetes
Ref.: modality of reference
4. Discussion and conclusions
The main purpose of this study was to provide some empirical evidence about the efficacy and the efficiency of the French team work experiment ASALEE – mixing GPs and nurses skills – regarding the management of type 2 diabetes patients. More specifically, following a general design of a controlled before–and–after study, some logistic and linear models were estimated to assess: first, the efficacy according to process (adequacy of follow-up procedures) and final outcomes (glycemic control); second, the differential impact between two levels of nurses intervention in complement to the GP (systematic electronic patient registry and electronic clinical reminder with or without patient education and counselling); third, the impact on direct cost including additional cost generated by the experiment.
With regard to the significant greater improvement, both of the follow-up adequacy and of the glycemic control, for the type 2 diabetes patients enrolled in the ASALEE experiment compared with those followed by “standard” GP practices, such an experiment could be considered as globally effective. In other words, the added value of teamwork between GPs and nurses is clearly demonstrated both for glycemic control (with the nurse visits for education and counselling) and process outcomes (with the nurse electronic patient registry and electronic GP reminder).
The improvement of the adequacy with guidelines regarding process outcome indicators calls for some comments. Firstly, it should be noticed that the positive impact on process outcome improvement for the follow-up of diabetes patients is in line with the results of the only evaluation of a French health care network yet published in France [35]. It is also in line with a great number of literature reviews [2,8-12,22,37] with very similar design and method and for various quality improvement programs involving nurses (i.e. disease management, case management, team work or skill-mix experiment…). Secondly, in 2007, the level of adequacy with guidelines for process outcome in the ASALEE experiment were equivalent or not so far from those achieve in UK [37] and much greater than those observed by the French national survey on diabetes patients [28] for all the indicators except for carrying out eye examinations.
The positive results regarding our final outcome, the improvement of the HbA1c rate and then of the proportion of patients be under glycemic control, were rather innovative because the studies that assess this type of outcomes were in a much more restricted number. It has been shown that the rate of Hba1c significantly decreased over one year in the ASALEE experiment with a points percentage reduction of 0.2 for all patients included and of 0.34 for patients who had experienced the nurses visits for education and counselling. Then we observed an increase in the proportion of diabetes patients under glycemic control over a year significantly greater than in the control group.
This should be compared first to the secular trend affecting the HbA1c, and second to what it was observed in other studies. First, the experience of the UKPDS study demonstrated that the natural trend of HbA1c was to be worsened at a rate around 0.2% per year over a 10-year cohort observation period [38]. Second, the relative decrease in HbA1c here are consistent with the results of other studies with a very similar design and method and for various quality improvement programs: most of the studies observed a rather significant reduction of the Hba1c level, comprised between a 0.4 and a 1.0 point percent reduction, and then an increase in the proportion of diabetes patients under glycemic control [36-44].
None of these studies concerned French experiments, and it is only recently that a disease management program lead by the National Health Insurance Fund for salaried people has been experimentally implemented for a targeted population of 140,000 diabetic patients. It is called SOPHIA and the results of its evaluation for final outcomes should not be available before mid-20105. A final set of results concerns the progression of costs over one year. These are not significantly higher in the ASALEE experiment than in the control group even if we take into account the additional cost generated by the experiment (i.e. nurses’ wages,…): €60/yr per patient. These additional costs was estimated by ASALEE on the basis of its accounts and its own records of nurse working time dedicated to the follow-up of diabetes patients. They should be compared to the one estimated by the National Health Insurance Fund for employee for the SOPHIA experimental disease management on a routine basis: €120/yr per patient. Moreover, as has been shown by the sensitive analysis, this is still the truth even if we let up the hypotheses for the additional costs in the ASALEE experiment and if we reached them to a very high threshold (€640/yr per patient for the total cost and €470/yr per patient for the cost attributable to the follow-up or treatment of diabetes, its risk factors or its complications).
It should be mentioned that expenditure over one year is less here than that estimated by the French National Health insurance Fund for types 1 and 2 diabetes patients in long-term disease [25,30]. This difference can mainly be explained by the fact that our sample is made up in the same way and that it is limited to patients covered by health insurance in the Deux-Sèvres department. It does not represent diabetic patients with complications leading to high expenses (e.g. diabetes patients under dialysis). Furthermore, it was not possible to take public hospital expenses fully into account. The
5
See for futher information: http://www.ameli.fr/professionnels-de-sante/medecins/vous-former-et-vous-informer/sophia-un-service-pour-les-malades-chroniques.php ;http://www.apmnews.com/story.php?numero=188739
exhaustiveness of the collection is better in t than in t-1, explaining part of the increase in expenditure between the two periods.
Nonetheless, our results are consistent with the results of existing studies in other countries in terms of cost progression, relatively moderate, on a short-term basis when a quality improvement program for chronic disease was implemented [13,14,40,45]. The progression is due to the fact that the costs saving are expected in long term schedule. The progression is moderate because marginal cost of the procedures that should be run in order to ensure a better follow-up are very low regarding the total expenditure of diabetes patient.
Finally, the model of GP nurse cooperation developed within the ASALEE natural experiment can be considered as efficient. This evaluation contribute to the large national policy experiment of skill mixing which gives place to a series of works, namely a recent national recommendation by the French National Authority in Health (Haute Autorité de Santé, HAS) and the National Observatory of Health Professions (Observatoire National de la Démographie des Professionnels de Santé, ONDPS 2008) in April 2008 (HAS 2008). The recommendation requested a number of reforms on the education and training of health professionals, provided a regulatory framework for developing cooperation and argued in favour of their necessity. At least in France the question remains to modify model of financing primary care organisations who are involved in such quality improvement organisational strategy for chronic disease case management directly implemented by professional compared with disease management program models led directly by the National Health Insurance Funds, like the Sophia experiment.
Some limitations should be taken into account in our study. Firstly, there is no random selection of GPs, nurses and patients and then some selection bias could occur. Secondly, we have a case study design extended to a controlled before-and-after design only for the evaluation of the final outcome but not for the evaluation of process outcomes and cost. Nevertheless, for the latter, we are able to implement a clear controlled before-and-after design, but only for a subsample of type 2 diabetes patient within the ASALEE experiment, those who were included during the final wave of the experiment (respectively 382 and 356 patients). We have run these models and the results still are robust for these subsamples. Thirdly, our patient attrition rate – mainly due to a change of location or because of a death – was about 13%. Fourthly, the evaluation was restricted to a proportion of all the eligible ASALEE patients: 40% for the glycemic control, 47% for the process outcomes and 49% for the costs. Fifthly, we could not include in our analysis some important unavailable variables: clinical and socioeconomic status variables with a broader scope than for those available here (e.g. occupation, income, education); other final outcome (e.g. body mass index, microvascular and macrovascular complications, quality of life). Finally, the conclusions in terms of efficiency are not based on a joint analysis of effectiveness and cost at the individual level and the observation length is limited.
Acknowledgements
This project was co-funded by the French National Authority for Health (HAS – Haute Autorité de
Santé). We would like to thank: the members of ASALEE association and the health care
professionals involved in this experimentation and especially to I. Rambault-Amoros and J. Gautier; the physicians of the OMG (General Medicine Observatory) from the SFMG association and especially to G. Hebbrecht; from IRDES: N. Grandfils, N. Le Guen, C. Ordonneau and G. Haour - for their participation to data management - C. Allonier, N. Grandfils and M. Naiditch - for their comments.
References
[1] Docteur E., Oxley H. (2003). Health-Care Systems: Lessons from the Reform Experience. OECD, Health Working Papers No. 9. Paris.
[2] Hofmarcher M.M., Oxley H., Rusticelli E. (2007). Improved Health System Performance through
better Care Coordination. OECD, Health Working Papers No. 30. Paris.
[3] Atun R. (2004). What are the advantages and disadvantages of restructuring a health
caresystem to be more focused on primary care services? WHO Regional Office for
Europe (HealthEvidence Network report). Copenhagen.
[4] Macinko J., Starfield B., Shi L. (2003). The Contribution of Primary Care Systems to Health
Outcomes within Organization for Economic Cooperation and Development (OECD) Countries, 1970–1998. HSR: Health Services Research; 38:831-865.
[5] Saltman R.B., Rico A., Boerma W. (2006). Primary care in the driver’s seat? Organizational
reform in European primary care. European Observatory on Health Systems and Policies
Series. Open University Press. Berkshire.
[6] World Health Organization. (1998). The world health report 2008: now more than ever. Geneva. [7] Wagner E.H. (1998). “Chronic disease management: what will it take to improve care for
chronic illness?” Effective Clinical Practice; 1:2–4.
[8] Grimshaw J.M., Thomas R.E., Mc Lennan G., Fraser C.R., Vale L. (2004). “Effectiveness and Efficiency of guidelines dissemination and implementation strategies”. Health Technol
Assess; 8 (6).
[9] Renders C.M., Valk G.D., Griffin S., Wagner E.H., van Eijk JThM., Assendelft WJJ. (2003). “Interventions to improve the management of diabetes mellitus in primary care, outpatient and community settings (Cochrane Review)”, In: The Cochrane Library, Issue 3.
[10] Laurant M., Reeves D., Hermens R., Braspenning J., Grol R., Sibbald B. (2004). “Substitution of doctors by nurses in primary care”. The Cochrane Database of Systematic Reviews, Issue 4.
[11] Buchan J., Calman L. (2005). Skill-Mix and Policy Change in the Health Workforce: Nurses in Advanced Roles. OECD, Health Working Papers No. 17. Paris.
[12] Zwarenstein M., Reeves S., Barr H., Hammick M., Koppel I., Atkins J. (2003). “Interprofessional education: effects on professional practice and health care outcomes (Cochrane Review)”, In: The Cochrane Library, Issue 3. Oxford: Update Software.
[13] Knight K., Badamgarav E., Henning J.M., Hasselblad V., Gano A.D. Jr., Ofman J.J. (2005). ”A systematic review of diabetes disease management programs”. Am J Manag care;11: 242-50.
[14] Beaulieu N., Cutler D.M., Ho K., Isham G., Lindquist T., Nelson A. O’Connor P. (2006). “The Business Case for Diabetes Disease Management for Managed Care Organizations”. Forum for Health Economics & Policy; 9:Issue 1.
[15] Tollen L. (2008). Physician organization in relation to quality and efficiency of care. A synthesis of recent literature. Kaiser Permanente Institute for Health Policy, The commonwealth fund. New York.
[16] Midy F. (2003). Efficacité et efficience du partage des compétences dans le secteur des soins primaires, revue de la littérature (1970-2002). IRDES, Question d’économie de la santé N :65. Paris.
[17] Sibbald B. (2009). Skill Mix in Primary Care - the UK experience. Oral communication during the international conference. Politiques et organisation des soins primaires : concepts, outils et pratiques en Europe et aux Etats-Unis. Quels enseignements pour la France ? Octobre 2009.
[18] Agence Nationale de l’Evaluation en Santé. (2000). Efficacité des méthodes de mise en œuvre
des recommandations médicales. Paris.
[19] Haut conseil pour l'avenir de l'assurance maladie. (2004). Rapport annuel. Paris. [20] Haut conseil pour l'avenir de l'assurance maladie. (2009). Rapport annuel. Paris.
[21] Cour des Comptes. (2005). « Les actions sur les comportements des professionnels de santé et des assurés sociaux », in Rapport sur la sécurité sociale. Paris.
[22] Bras P.L., Duhamel G., Grass E. (2006). “Improving the care of the chronically ill: lessons from foreign disease management experience”. Pratiques et Organisation des Soins, 341-356. [23] Naiditch M., Dourgnon P. (2009). The preferred doctor scheme: A political reading of a French
experiment of Gate-keeping. IRDES, working paper n° 22; Paris.
[24] Elbaum M. (2008). « Participation financière des patients et équilibre de l’assurance maladie ». OFCE, Lettre de l’OFCE N°301. Paris.
[25] Detournay B., Brami G., Nachit-Ouinekh F., Eschwege E. (2007). « Prévalence et coût du diabète en France : où en est-on ? » Médecine des maladies métaboliques ;1:1-5.
[26] Germanaud J., Deprez P.H., Delvoye S., Gabach P., Schmitt B., Lasfargues G., Lecomte P., Charlon R. (2003). « Une typologie des pratiques médicales comme outil de l’amélioration de la qualité des soins. Expérience dans la prise en charge des malades diabétiques par les médecins généralistes ». Revue médicale de l’Assurance Maladie ;34: 85-91.
[27] Fagot-Campagna A., Simon D., Varroud-Vial M., Ihaddadène K., Vallier N., Scaturro S., Eschwège E., Weill A. (2003). « Caractéristiques des personnes diabétiques traitées et adéquation du suivi médical du diabète aux recommandations officielles ». Entred 2001. INVS, BEH N°49-50. Paris.
[28] Robert J., Roudier C., Poutignat N., Fagot-Campagna A., Weill A., Rudnichi A., Thammavong N., Fontbonne A., Detournay B. (2009). « Prise en charge des personnes diabétiques de type 2 en France en 2007 et tendances par rapport à 2001 ». INVS, BEH N°42-43. Paris. [29] Schoen C., Osborn R.S., How K.H., Doty M.M., Peugh J. (2008). “In Chronic Condition:
Experiences of Patients with Complex Health Care Needs, in Eight Countries, 2008,” Health AffairsWeb Exclusive (November 13).
[30] Vallier N., Weill A., Salanave B., Bourrel R., Cayla M., Suarez C., Ricordeau P., Allemand H. (2006). “Cost of thirty long-term diseases for beneficiaries of the French general health insurance scheme in 2004”. Pratiques et organisation des soins ; 4:267-283.
[31] Paita M., Weill A. (2008). « Les personnes en affection de longue durée au 31 décembre 2007 ». CNAMTS, Points de repère N° 20. Paris.
[32] Berland Y. (2003). Mission Coopération des professions de santé : le transfert de tâches et de compétences. Rapport d’étape présenté par le Pr Yvon Berland. Paris.
[33] Berland Y., Bourgueil Y. (2006). Cinq expérimentations de coopération et de délégation de tâches entre professions de santé. ONDPS. Paris.
[34] Haute Autorité de Santé. (2008). Délégation, transfert, nouveaux métiers… Comment favoriser les formes nouvelles de coopération entre professionnels de santé. Recommandation de la HAS en collaboration avec l’ONDPS. Paris.
[35] Boyer L., Ohrond C., Fortanier C., Fourny M., Horte C., Loï R., Chanut C., François P. (2007). “Quality, cost and outcome of the coordinated management of type 2 diabetic patients in a healthcare network“. Pratiques et Organisation des Soins ; 38 :111-117.
[36] Loveman E., Frampton G.K., Clegg A.J. (2008). The clinical effectiveness of diabetes education models for Type 2 diabetes: a systematic review. Health Technology Assessment; Vol. 12: No. 9.
[37] Khunti K., Gadsby R., Millett C., Majeed A., Davies M. (2007). “Quality of diabetes care in the UK: comparison of published quality-of-care reports with results of the Quality and Outcomes Framework for Diabetes”. Diabetic Medicine; 24:1436-41..
[38] UK Prospective Diabetes Study (UKPDS) Group. (1998). “Intensive blood-glucose control with sulphonylureas or insulin compared with conventional treatment and risk of complications in patients with type 2 diabetes (UKPDS 33)”. The Lancet;352:837-53.
[39] Shojania K.G., Ranji S.R., McDonald K.M., Grimshaw J.M., Sundaram V., Rushakoff R.J., Owens D.K.. (2006). “Effects of quality improvement strategies for type 2 diabetes on glycemic control: a meta-regression analysis”. JAMA; 26:427-40.
[40] Gertler P., Simcoe T.S. (2006). Disease management. Social science research network, working paper.
[41] Gulliford M.C., Ashworth M., Robotham D., Mohiddin A. (2007). “Achievement of metabolic targets for diabetes by English primary care practices under a new system of incentives”. Diabetic Medicine ; 24:505-11.
[42] Smith S.M., Allwright S., O'Dowd T. (2008). “Does sharing care across the primary-specialty interface improve outcomes in chronic disease? A systematic review”. American Journal of Manage Care; 14:213-24.
[43] Calvert M., Shankar A., McManus R.J., Lester H., Freemantle N. (2009). “Effect of the quality and outcomes framework on diabetes care in the United Kingdom: retrospective cohort study”. BMJ; 339:b2768.
[44] Campbell S.M., Reeves D., Kontopantelis E., Sibbald B., Roland M. (2009). „Effects of pay for performance on the quality of primary care in England”. New England Journal of Medicine; 361:368-78.
[45] Fireman B., Bartlett J., Selby J. (2004). “Can disease management reduce health cost by improving quality”. Health affairs; 23:76-8
l What are the Motivations of Pathways to Retirement in
Europe: Individual, Familial, Professional Situation or Social Protection Systems?/ Debrand T. (Irdes), Sirven N. (Irdes) Document de travail Irdes n° 28, octobre 2009.
l Are Health Problems Systemic? Politics of Access and
Choice under Beveridge and Bismarck Systems/ Or Z. (Irdes), Cases C. (Irdes), Lisac M. (Bertelsmann Stiftung), Vrangbaek K. (University of Copenhagen), Winblad U. (Uppsala University), Bevan G. (London School of Economics) Document de travail Irdes n° 27, septembre 2009.
l Quelles sont les motivations des départs à la retraite en
Europe : situation personnelle, familiale, professionnelle, ou rôle de la protection sociale ?/Debrand T., Sirven N. Document de travail Irdes n° 26, juin 2009.
l Les écarts des coûts hospitaliers sont-ils justifiables ?
Réflexions sur une convergence tarifaire entre les secteurs public et privé en France/ Or Z., Renaud T., Com-Ruelle L. Document de travail Irdes n° 25, mai 2009.
l Income and the Demand for Complementary Health
Insurance in France/ Grignon M., Kambia-Chopin B. Document de travail Irdes n° 24, avril 2009.
l Principes et enjeux de la tarification à l’activité à
l’hôpital (T2A). Enseignements de la théorie économique et des expériences étrangères/ Or Z., Renaud T.
Document de travail Irdes n° 23, mars 2009.
l The Preferred Doctor Scheme: A Political Reading of a
French Experiment of Gate-keeping/ Naiditch M., Dourgnon P. Document de travail Irdes n° 22, mars 2009.
l Evolution 1998-2002 of the Antidepressant Consumption
in France, Germany and the United Kingdom/ Grandfils N., Sermet C. Document de travail Irdes n° 21, février 2009.
l Dynamic Estimation of Health Expenditure: A New
Approach for Simulating Individual Expenditure/ Albouy V., Davezies L., Debrand T.
Document de travail Irdes n° 20, janvier 2009.
l La qualité des soins en France : comment la
mesurer pour l’améliorer ?/ Or Z., Com-Ruelle L. Document de travail Irdes n° 19, décembre 2008.
l A Refutation of the Practice Style Hypothesis: The Case
of Antibiotics Prescription by French General Practitioners for Acute Rhinopharyngitis/ Mousquès J., Renaud T., Scemama O. Document de travail Irdes n° 18, octobre 2008.
l Impact of Health Care System on Socioeconomic
Inequalities in Doctor Use/ Or Z., Jusot F., Yilmaz E. Document de travail Irdes n° 17, septembre 2008.
l Drug Price Setting and Regulation in France/ Grandfils N.
Document de travail Irdes n° 16, Septembre 2008.
l Comparability of Health Care Responsiveness in Europe.
Using Anchoring Vignettes from SHARE/ Sirven N., Santos-Eggimann B., Spagnoli J.
Document de travail Irdes n° 15, septembre 2008.
l État de santé des populations immigrées en France/
Jusot F., Silva J., Dourgnon P., Sermet C. Document de travail Irdes n° 14, juillet 2008.
l The Sooner, the Better? Analyzing Preferences for
Early Retirement in European Countries/ Blanchet D., Debrand T.
Document de travail Irdes n° 13, juillet 2008.
l Social Heterogeneity in Self-Reported Health
Status and Measurement of Inequalities in Health/ Tubeuf S., Jusot F., Devaux M., Sermet C. Document de travail Irdes n° 12, juin 2008.
l Health Status, Neighbourhood Effects and Public
Choice: Evidence from France/ Debrand T., Pierre A., Allonier C., Lucas V.
Document de travail Irdes n° 11, juin 2008.
Rapports 2008-2009
l Volume d’activité et résultats des soins en France : une analyse
multiniveaux des données hospitalières/ Or Z., Renaud T.
Rapport Irdes, décembre 2009, 80 pages. Prix : 21 €.
l Volume d’activité et qualité des soins dans les établissements
de santé : enseignements de la littérature/ Com-Ruelle L.,
Or Z., Renaud T. Avec la collaboration de Ambroise C. et Marek A.
Rapport Irdes n° 1734, décembre 2008, 146 pages. Prix : 30 €.
l Coopération entre médecins généralistes et infirmières pour le
suivi des patients diabétiques de type 2. Evaluation médico-
économique de l’expérimentation Asalee/ Bourgueil Y., Le Fur P., Mousquès J., Yilmaz E.
Questions d’économie de la santé 2009
l Quel lien entre volume d’activité des hôpitaux et qualité des soins en
France ?/ Or Z., Renaud T.
Questions d’économie de la santé Irdes n° 149, décembre 2009.
l Partir à la retraite en Europe : déterminants individuels et rôle de la
protection sociale/ Debrand T., Sirven N.
Questions d’économie de la santé Irdes n° 148, novembre 2009.
l Une évaluation exploratoire des maisons de santé de Franche-
Comté et de Bourgogne/ Bourgueil Y., Clément M.-C., Couralet P.-E.,
Mousquès J., Pierre A.
Questions d’économie de la santé Irdes n° 147, octobre 2009.
www.irdes.fr
Julien Mousquès, Yann Bourgueil, Philippe Le Fur (Irdes, Prospere), Engin Yilmaz (Drees)
This study aims to assess the efficacy and the cost of a French team work experiment between nurses and GPs for the managing of type 2 diabetes patients.
Our study was based on a case control study design in which we compare the evolution of process (stan-dard follow-up procedures) and final outcomes (glycemic control), and the evolution of cost. The study is realized between two consecutive periods between type 2 diabetes patients followed within the team work experiment (intervention group) or by “standard” GPs (controlled group).
After a 11 months of follow-up, we showed that patients in the intervention group, compared with those in the controlled group, have more chances to remain or to become: correctly followed-up (with OR comprise between 2.1 to 6.8, p<=5%) and under glycemic control (with OR comprise between 1.8 to 2.7, p<=5%). The latter result is obtained only when a visit for education and counselling has been delivered by a nurse in supplement to systematic electronic patient registry and electronic clinical GPs reminder. All these results are obtained without difference in costs between the intervention and the controlled group.
Finally, this experimentation of team working can be considered both effective and efficient. Our fin-dings may have implications in the design of future larger primary care team work experiments to be launched by French health authorities.
L’impact d’une expérimentation française de travail en équipe, entre généralistes et infirmières, sur l’efficacité et les coûts du suivi des patients diabétiques de type 2
Julien Mousquès, Yann Bourgueil, Philippe Le Fur (Irdes, Prospere), Engin Yilmaz (Drees)
Cette étude a pour objectif d’évaluer l’efficacité et les coûts d’une expérimentation de travail en équipe entre des infirmières et des généralistes (l’expérimentation ASALEE), dans le cas de la prise en charge des patients souffrant de diabète de type 2.
Elle s’appuie sur un design cas/témoin dans lequel nous comparons l’évolution des résultats de soins en ter-mes de processus (procédures standards de suivi) et de résultat final (le contrôle glycémique), ainsi qu’en termes de coûts. Cette comparaison est réalisée entre deux périodes consécutives et entre des patients diabétiques de type 2 suivis dans l’expérimentation (le groupe d’intervention) ou dans le groupe témoin (le groupe contrôle).
Nous montrons qu’après onze mois de suivi, les patients ASALEE, comparés à ceux du groupe témoin, ont une plus grande probabilité de rester ou devenir bien suivis en termes d’indicateurs de processus (OR compris entre 2.1 à 6.8, p < 5 %), ainsi qu’en termes de contrôle glycémique (OR compris entre 1.8 à 2.7, p < 5 %). Ces derniers résultats sont obtenus uniquement lorsque les patients ont bénéficié d’au moins une consultation infirmière d’éducation et de conseils hygiéno-diététiques en complément du rôle classique des infirmières dans le cadre de l’expérimentation ASALEE, c’est-à-dire la mise à jour des dossiers médicaux informatisés avec l’inscription éventuelle de rappels informatiques à destination des généralistes.