Département de génie civil
ASSESSMENT OF LIQUEFACTION POTENTIAL
USING THE COMBINED TRIAXIAL SIMPLE
SHEAR APPARATUS (T
xSS)
by
Marwan Khashila
A dissertation submitted in partial fulfillment of the requirements for the degree of
Doctor of Philosophy In
Civil Engineering (Geotechnical Engineering)
Sherbrooke (Québec), Canada Dec. 2019
Département de génie civil
Évaluation DU POTENTIEL DE LIQUÉFACTION À
L’AIDE DU NOUVEL ESSAI TRIAXIAL EN
CISAILLEMENT SIMPLE (T
xSS)
Thèse de doctorat Spécialité : génie civil
Marwan Khashila
A dissertation submitted in partial fulfillment of the requirements for the degree of
Doctor of Philosophy (Civil Engineering)
MEMBRES DU JURY: Mourad Karray (directeur) Michael James (membre externe) Alper Sezer (membre externe) Mathieu Nuth (membre interne) Mahmoud Ahmed (membre externe)
À ma mère, à mon père À ma femme et mes enfants
i
ABSTRACT
In recent decades, several total and effective stress constitutive models have been developed in geotechnical engineering practice to perform one-dimensional site response analysis. These constitutive models have been incorporated in either finite difference or finite element dynamic analysis programs. Also, numerous research work has been done to predict more accurately earthquake-induced pore water pressure more accurately. Hitherto, the developed pore pressure models can be classified into stress, strain, and energy-based models. In the current study, strain-based and energy-based pore pressure models were proposed based on a series of strain-controlled cyclic TxSS tests performed on reconstituted specimens of Baie
Saint Paul, Carignan, Ottawa C-109, Ottawa F-65, and Quebec CF6B sands.
The proposed strain-based model was used to investigate the equivalent number of cycles concept and to assess the pore pressure as a damage metric. The energy-based model was combined with the Sigmoidal-model in FLAC 2D to introduce a simplified coupled energy-based pore pressure model. The proposed model was calibrated and verified, in terms of shear stress-strain response and excess pore pressure development, based on a series of strain-controlled cyclic TxSS test results.
On an elemental-level, the model results were validated under cyclic strain-controlled and stress-controlled tests and a fair agreement was observed between the energy-based model and DSS results in terms of liquefaction resistance. In addition, the proposed model was validated by incorporating the energy-model in FLAC3D platform to study the cyclic behavior under triaxial and simple shear conditions. The numerical simulation clarifies the difference between cyclic triaxial and simple shear conditions as well as the load conditions (i.e. stress or strain-controlled conditions).
Further validation was performed by numerical simulation of a centrifuge model conducted by Ramirez et al. (2017) at the University of Colorado Boulder by using the well-established Finn model and by the proposed energy-based model. The comparison shows the capability of the proposed energy-based model in conjunction with the Sigmoidal-model to very well simulate the seismic response in liquefaction analysis.
The proposed simplified coupled energy-based pore pressure model was implemented to assess the compatibility of the liquefaction charts in the eastern and western North America as
compatible with the National Building Code of Canada 2005 (synthetic earthquake) and another incompatible real earthquake from the western region (Northridge earthquake). The comparison in terms of the generated pore pressure, the equivalent number of cycles and incorporated liquefaction charts (CRR-(N1)60CS) highlights the inaccuracy of using current
iii
RÉSUMÉ
Au cours des dernières décennies, plusieurs modèles constitutifs des contraintes totales et effectives ont été devellope dans la pratique de geotechnique pour effectuer une analyse unidimensionnelle de la réponse du site. Ces modèles constitutifs ont en fait été incorporés dans l'analyse dynamique par différence finie ou par éléments finis. De nombreux travaux de recherche ont été effectués pour prédire avec plus de précision la pression d'eau interstitielle induite par le séisme. Jusqu'à présent, les modèles de pression interstitielle développés peuvent être classés en modèles basés sur la contrainte, la déformation et l'énergie-dissipe. Dans le cadre de la présente étude, un modèle de pression interstitielle basé sur la déformation et un autre modèle de pression interstitielle basé sur l'énergie sont proposés à partir d'une série d'essais TxSS cycliques contrôlés par déformation effectués sur des échantillons de sol reconstitué à Baie Saint-Paul, Ottawa C-109, Ottawa F-65 et dans les sables de Québéc.
Le modèle basé sur la déformation proposé a été utilisé pour étudier le concept du nombre équivalent de cycles et pour évaluer la pression interstitielle comme mesure des dommages. Cependant, le modèle basé sur l'énergie est combiné avec le modèle Sigmoidal dans le logiciel FLAC pour introduire un modèle couplé simplifié de pression interstitielle basé sur l'énergie. Le modèle proposé est calibré et vérifié, en termes de réponse contrainte-déformation et de pression interstitielles, sur la base d'une série de résultats d'essais TxSS cycliques à contrainte contrôlée.
Au niveau des éléments, les résultats du modèle ont été validés dans le cadre d'essais cycliques à contrainte contrôlée et d'essais alternatifs à contrainte contrôlée et une concordance a été observé entre les résultats du modèle énergétique et ceux du DSS en termes de potentielle de liquéfaction. De plus, le modèle proposé a été utilisé en incorporant le modèle d'énergie dans la plate-forme FLAC3D pour étudier le comportement cyclique dans des conditions de cisaillement simple et triaxial. La simulation numérique clarifie la différence entre les conditions de cisaillement cycliques triaxiales et les conditions de cisaillement simples ainsi que les conditions de charge (c'est-à-dire les conditions de contrainte ou de déformation contrôlées).
D'autres validations ont été effectuées par simulation numérique d'un modèle expérimental de centrifugeuse mené par Ramirez et al (2017) à l'Université du Colorado Boulder par le modèle Finn bien établi et par le modèle énergétique proposé. La comparaison obtenue montre la
Dans le cadre de cette étude, le modèle simplifié de pression interstitielle couplée basée sur l'énergie a été mis en œuvre pour évaluer la capacité des chartes de liquéfaction dans l'Est et l'Ouest de l'Amérique du Nord. Différents dépôts de sable de niveau hypothétique ayant des périodes fondamentales différentes ont été soumis à deux séismes de grande échelle pour effectuer une analyse 1-D de la réponse du site. L'un est compatible avec le Code Nationale du Batiment 2005 (tremblement de terre synthétique) et un autre tremblement de terre réel incompatible de la région ouest (séisme de Northridge). La comparaison en termes de pression interstitielle générée, de nombre équivalent de cycles et de charte de liquéfaction incorporés (CRR-(N1)60CS) souligne une certaines imprecision de l'utilisation des chartes de liquéfaction actuels dans les régions de l'Est.
v
REMERCIEMENTS
First of all, I am deeply grateful to my supervisor, Prof. Mourad Karray, for his patience, motivation, insight, unbounded support and valuable guidance throughout my PhD. This thesis could not have been accomplished without his scientific support. Prof. Karray gave me much more scientific discussion and his profound practical expertise in soil dynamics and earthquake engineering. It has been a great honor and pleasure for me to study under his supervision.
I am, really, indebted to my post-doctoral, Dr. Mahmoud Nasser for his continuous assistance, enthusiasm, faithful encouragement and extraordinary support since starting my PhD program. In fact, it has not been since starting my PhD program. It has been since my undergraduate study and during my Master program. No word could express my gratitude to you.
Further appreciation is extended to jury members, Prof. Michael James, Prof. Alper Sezer and Prof. Mathieu Nuth for accepting to give me the honor of being the reviewers of my thesis and giving me their constructive, insightful and scientific comments on my thesis.
I wish to thank all my colleagues in our research group for their help and support. The complete list of this wonderful group would be too long to acknowledge here. I would like to acknowledge the laboratory technicians Valérie Dumoulin and Alexandre Sevigny for their appreciated support to do my experimental work in geotechnical and geo-environmental engineering laboratory. I also would like to acknowledge the financial support of Engineering Research Council of Canada (NSERC) and Hydro-Québec research institute.
Special sincere appreciation is expressed to my parents, and my brothers for their extreme patience, support and encourage through my study and for being by my side. My dad and mom, thanks for being my light in this life. Thanks for supporting me since my childhood. Thanks to my beautiful children, Kareem and Carmen for being the light of my world.
vii
TABLE DES MATIÈRES
ABSTRACT ... i
RÉSUMÉ ... iii
REMERCIEMENTS ... v
LISTE DES FIGURES ... xi
LISTE DES TABLEAUX ... xiv
LISTE DES SYMBOLES ... xv
LISTE DES ACRONYMES ... xvi
CHAPTER 1. INTRODUCTION ... 1
1.1 General ... 1
2.1 Objectives of the research ... 2
1.3 Statement of originality ... 3
1.4 Thesis outline ... 4
CHAPTER 2 LITERATURE REVIEW ... 7
2.1 Introduction ... 7
2.2 The difference of seismic response between Eastern and Western North America ... 7
2.3 Liquefaction Assessment ... 9
2.3.1 Stress-based liquefaction evaluation approach ... 10
2.3.2 Strain-controlled liquefaction evaluation approach ... 18
2.3.3 Energy-based evaluation approach ... 21
2.3.4 Numerical modeling analysis ... 24
2.4 Equivalent number concept ... 30
2.4.1 Palmgren-Miner cumulative damage hypothesis (P-M) ... 30
2.4.2 Richart-Newmark cumulative damage hypothesis (R-N) ... 34
2.4.3 Alternative Implementation of Palmgren–Miner Hypothesis for Liquefaction Evaluations ... 37
2.5 Pore pressure build up and energy concept. ... 39
2.6 Comparison between cyclic triaxial and simple shear tests ... 47
2.7 Sample size effect on simple shear test results ... 51
2.8 Summery ... 53
CHAPTER 3. EXPERIMENTAL PROGRAM ... 55
3.1 Introduction ... 55
3.2 Direct Simple Shear device (DSS) ... 55
3.2.1 Variation of lateral stress Coefficient during cyclic DSS loading... 59
3.3 Combined triaxial simple shear apparatus (TxSS) ... 61
3.4 Cyclic Triaxial testing apparatus (CTX) ... 64
3.5 Material and sample preparation ... 66
3.5.1 The used sands in the current study ... 66
3.5.2 Preparation of soil sample ... 68
CHAPTER 4. USE OF PORE PRESSURE BUILD-UP AS DAMAGE METRIC IN COMPUTATION OF EQUIVALENT NUMBER OF UNIFORM STRAIN CYCLES ... 73
4.1.1 Equivalent number concept and cumulative damage: a review ... 77
4.1.2 Pore pressure build-up models ... 80
4.2 Experimental work ... 81
4.2.1 Testing apparatus ... 81
4.2.2 Testing Program ... 81
4.2.3 Experimental results ... 83
4.3 Converting earthquake strain time history to equivalent uniform strain cycles, Neq ... 91
CHAPTER 5. LIQUEFACTION RESISTANCE FROM CYCLIC SIMPLE AND TRIAXIAL SHEARING, A COMPARATIVE STUDY ... 95
5.1 Introduction ... 97
5.2 Experimental work ... 101
5.2.1 Testing Apparatus ... 101
5.2.2 Test program in TxSS, DSS and CTX ... 105
5.2.3 Experimental results ... 107
5.3 Influence of specimen size in TxSS ... 107
5.4 Energy-based pore water pressure model ... 111
5.4.1 Validation of liquefaction potential curves obtained from TxSS tests ... 113
5.5 Analysis and Discussion ... 119
CHAPTER 6. DYNAMIC SOIL BEHAVIOR UNDER SIMPLE AND TRIAXIAL SHEAR MODES ... 125
6.1 Introduction ... 127
6.2 Experimental program ... 129
6.2.1 Testing Device and soil sampling ... 129
6.2.2 Experimental results ... 131
6.3 Numerical simulation ... 136
6.3.1 Numerical model ... 136
6.3.2 Applicability of the proposed energy-based model ... 138
6.4 Discussion ... 140
CHAPTER 7 ASSESSMENT OF COMPATIBILITY OF LIQUEFACTION CHARTS FOR EASTERN REGIONS OF CANADA ACCORDING TO NATIONAL BUILDING CODE (NBCC) PROVISION ... 149
7.1 Introduction ... 151
7.2 Experimental work ... 155
7.2.1 Testing equipment ... 155
7.2.2 The conventional direct simple shear Apparatus (DSS) ... 155
7.2.3 The combined Triaxial Simple Shear Apparatus (TxSS) ... 155
7.2.4 Specimen preparation and testing conditions ... 157
7.3 Liquefaction potential and energy-based pore water pressure model ... 158
7.3.1 Numerical model in comparing with the experimental element-level results ... 162
7.3.2 Comparing the liquefaction potential curves from DSS and TxSS ... 163
7.3.3 Validation of the proposed model with Finn and Centrifuge model results ... 165
7.4 The response of hypothetical uniform level Ottawa sand deposits ... 168
ix
CHAPTER 8. CONCLUSIONS ET RECOMAMMENDATION ... 182
8.1 Conclusions (en français) ... 182
8.2 Recommendations pour la recherche future (en français) ... 185
8.3 Conclusions (in English) ... 188
8.4 Recommendation for future research (in English) ... 191
LIST OF REFERENCE ... 194
APPENDIX A ... 222
xi
LISTE DES FIGURES
Figure 1.1: Organization of the thesis ... 6 Figure 2.1. Spectral accelerations of Western and Eastern earthquakes ... 9 Figure 2.2. Schematic illustration of the simplified stress-based method (from Seed and Idriss
1971) ... 13 Figure 2.3. Cyclic resistance ratio (CRR) correlation from (N1)60cs (from Idriss and Boulanger
2008) ... 16 Figure 2.4. Magnitude scaling factor based on qc1Ncs for cohesionless soil ... 17 Figure 2.5. Boundaries of generated pore water pressure ratio versus shear strain at N = 10
cycles for various sands and densities (from Dobry 1985) ... 20 Figure 2.6. Determination of G/Gmax corresponding to c iteratively (from Green 2000) ... 21
Figure 2.7. Schematic illustration of calculation the dissipated energy form the hysteresis loop (from Karray et al. 2015) ... 23 Figure 2.8. Definition of shear modulus and damping ratio in a shear test ... 26 Figure 2.9. (a) G/Gmax degradation curves (b) damping ratio as a function of shear strain (from
Darendeli 2001) ... 27 Figure 2.10. Loading, unloading and reloading curves based on Masing’s Rule (from Ishihara
1996) ... 28 Figure 2.11. Metal fatigue (S–N curve) and liquefaction potential (CSR-Nliq) curves (from
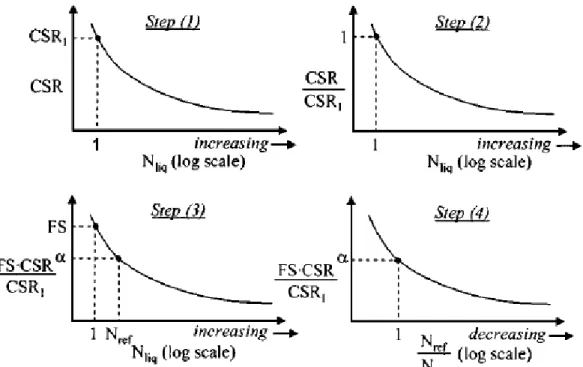
Green and Terri 2005) ... 33 Figure 2.12. The sequence of steps used by Seed et al. (1975) to normalize a CSR-Nliq curve
(from Green and Terri 2005) ... 34 Figure 2.13. Damage-cycle ratio relationship proposed by Richart and Newmark (1948) ... 36 Figure 2.14. Computed Neqɣ and Neqτ for two earthquake motions from the 1992 M7.3 Landers
earthquake using different methods (from Green and Lee 2006) ... 41 Figure 2.15. Scaled velocities at 20% of total displacement in the first loading cycle, (a)
simple shear specimen, and (b) triaxial specimen ... 48 Figure 2.16. Liquefaction potential curves of Monterey No. 0 sand at Id = 60% obtained from
DSS and CTX (from Silver at al. 1980) ... 50 Figure 2.17. The proposed Cr of Fraser Delta sand (from Vaid and Sivathayalan 1996) ... 51
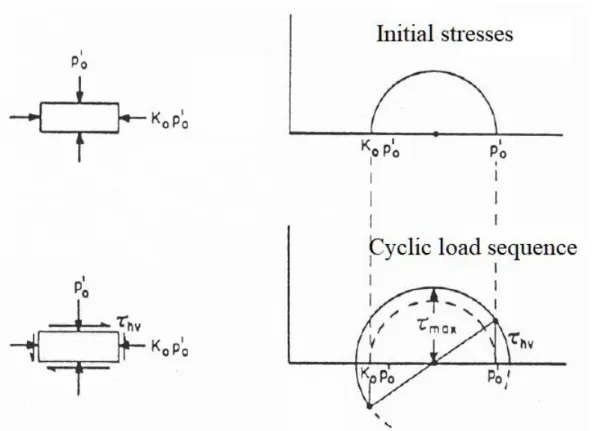
Figure 3.1. (a) Roscoe-type (Rigid wall) (b) SGI-type (stacks of annular plates/rings) (c) NGI-type (Reinforced membrane) ... 57 Figure 3.2. loading conditions in DSS before and during cyclic loading (from Seed and
Peacock 1971) ... 57 Figure 3.3. Schematic illustration of DSS apparatus ... 59 Figure 3.4. Variation of K0 during numerical simulation of cyclic DSS stress-controlled tests
(from Dabeet et al. 2012) ... 60 Figure 3.5. evolution of K0 during cyclic DSS loading (from Youd and Croven 1975) ... 60
Figure 3.6. Schematic sketch of the triaxial simple shear (TxSS) apparatus ... 62
Figure 3.7. soil specimen prepared in (a) latex membrane, (b) latex membrane and annular
rings ... 63 Figure 3.8. Simulation of the induced stresses under cyclic triaxial conditions (from Ishihara
1996) ... 65 Figure 3.9. An automated triaxial apparatus... 66
xii
Figure 3.10. Grain-size distribution of the material used and boundaries for liquefiable soils proposed by Xenaki and Athanasopoulos (2003) ... 67 Figure 3.11. Liquefaction resistance obtained from different preparation methods (Seed 1979) . 69 Figure 3.12. Triaxial sample preparation ... 70 Figure 3.13. Typical cyclic records under DSS: (a) effective stress path; (b) hysteresis loops;
(c) cyclic shear strain; (d) degradation of effective vertical stress (from Wu et al. 2018) ... 72 Figure 4.1. Grain-size distribution curves of sands used ... 82 Figure 4.2. Typical records of TxSS test (Q4) on Quebec sand CF6B (a) hysteresis loop
(CSR-cyc), (b) CSR and Ru versus time, (c) shear strain and vertical deformation versus
time... 83 Figure 4.3 Variation of cyclic shear strain, γcyc with Nliq ... 84
Figure 4.4. Validation of proposed relation: (a) BSP sand, (b) Carignon sand, (c) Quebec sand CF6B, and (d) Ru-Rn relations for all the aforementioned sands. ... 86 Figure 4.5. Calibration of the material parameter, r ... 87 Figure 4.6. Relation between applied γcyc, measured Ruexp, and cumulative damage
computed by P-M and R-N hypotheses for BSP sand: (a) non-uniform (B6), and (b) nonuniform (B7). ... 88 Figure 4.7. Spectra for accelerations used ... 89 Figure 4.8. Acceleration time history used in current study for: (a, b) BSP sand, and (c)
Carignan sand. ... 90 Figure 4.9. Relation between applied γcyc, measured Ru, and cumulative damage by P-M and
R-N hypotheses for (a) BSP sand (B8), (b) BSP sand (B9), and (c) Carignan sand (C1-6). ... 93 Figure 4.10. Excess pore-water pressure ratio versus time required to cause: (a) Ru = 0.6 for
BSP, (b) Ru = 0.42 for BSP, (c) Ru = 0.9 for BSP, and (d) Ru = 0.205 for Carignan sands... 94 Figure 5.1. The new combined triaxial simple shear (TxSS) apparatus ... 102
Figure 5.2. Soil specimen prepared in (a) latex membrane, (b) latex membrane and annular rings (c) constrained latex membrane by fiberglass tape ... 103 Figure 5.3. Grain size distribution and grain shape of the used sands ... 104 Figure 5.4. Typical records of TxSS strain-controlled test (B-S3) on Baie-Saint-Paul sand ... 109
Figure 5.5. Variation of (a) the generated pore water pressure, (b) the induced CSR, and (c) the liquefaction potential of Ottawa sand C-109 prepared at different D/H ratio ... 110 Figure 5.6. Correlations between the genera pore pressure and the normalized dissipated
energy for (a) Ottawa sand, (b) BSP sand, (c) Quebec sandCF6B, (c) α as
functions of shear strain ... 114 Figure 5.7. Typical records of TxSS alternative stress-controlled test (O-SX1) on Ottawa sand
C-109 ... 117 Figure 5.8. Comparison between liquefaction potential curves of Ottawa sand C-109 ... 118 Figure 5.9. CSR – Nliq curve from stress-controlled TxSS and CTX performed on: (a)
Baie-Saint-Paul, (b) Ottawa Sand C-109 and (c) Quebec sandCF6B ... 120 Figure 5.10. γ – Nliq and ε – Nliq curve from strain-controlled TxSS and CTX performed on (a)
Baie-Saint-Paul and (b) Ottawa Sand C-109 ... 121 Figure 5.11. Variation of the induced strains and pore water pressure under stress-controlled
xiii
Figure 5.12. Variation of the induced strains and pore water pressure under stress-controlled
tests ... 124
Figure 6.1. Grain size distribution of the used sands ... 131
Figure 6.2. Comparison between measured and computed BSP sand response in terms of CSR, pore water pressure buildup and stress path in cyclic strain-controlled TxSS and CTX tests ... 134
Figure 6.3. Variation of the accumulated pore pressure ratio with the normalized dissipated energy per unit volume for BSP and Ottawa sands in TxSS and CTX ... 135
Figure 6.4. Numerical mesh and boundary conditions of (a) CTX, and (b) TxSS models ... 137
Figure 6.5. Simulation results of BSP under: (a) (b) TxSS, (c) (d) CTX conditions ... 139
Figure 6.6. Axial strain distribution (z) within CTX specimen ... 141
Figure 6.7. Variation of cyclic axial, ε, and shear strain, γ, with number of liquefaction cycles, Nliq, of (a) BSP sand (b) Ottawa sand ... 143
Figure 6.8. Comparison between generated pore pressure in TxSS, DSS and CTX under strain-controlled loading (a) Ottawa sand and (b) BSP sand ... 145
Figure 6.9. The proposed correction factor of cyclic strain-controlled tests ... 145
Figure 6.10. Comparison between the generated and estimated pore water pressure as well as the induced and corrected axial strain in (a) BSP and (b) Ottawa sand specimen .... 148
Figure 7.1. The combined triaxial simple shear (TxSS) apparatus ... 156
Figure 7.2. Grain size distribution of the used sands ... 158
Figure 7.3. Typical results of TxSS test and numerical model in terms of (a) Hysteresis loops (CSR-γcyc), (b) decaying of CSR time history, (c) Ru time history ... 159
Figure 7.4. Dissipated energy-pore pressure relations (a) for loose sand; (b) for dense sand; (c) the variation of the fitting parameters ... 161
Figure 7.5. Typical records of an alternative stress-controlled test ... 164
Figure 7.6. Liquefaction potential curves for dense and loose reconstituted samples. ... 165
Figure 7.7. Comparison between numerically computed and experimentally measure pore pressure ... 167
Figure 7.8. Acceleration time history of (a) synthetic earthquake; (b) Northridge earthquake; (c) spectra acceleration scaled to design spectrum of Eastern Quebec City ... 169
Figure 7.9. Variation of maximum computed pore pressure and average CSR along with depth ... 170
Figure 7.10. The spectrum of maximum computed pore pressure ... 173
Figure 7.11. Variation of CSRmax, Ru max, and Neq after (a) Synthetic earthquake; (b) Northridge earthquake ... 174
Figure 7.12. Comparison between experimentally measured and numerically computed seismic response to synthetic and Northridge earthquakes at depth 5-6 m ... 175
Figure 7.13. Liquefaction resistance curve after Idriss and Boulanger (2008) ... 176
Figure 7.14. Induced shear strain and computed pore pressure at depth 5-6 m after (a) Synthetic earthquake; (b) Northridge earthquake ... 181
Figure A.1. Scaled time histories of the accelerations used (a) SAG-La Malbaie, (b) Livermore, (c) Syn. west (Atkinson), and (d) Kobe-L earthquakes ... 223
xiv
Figure A.3. Seismic responses of the applied earthquakes ... 225
Figure B.1. Different configurations of DSS tests ... 231
Figure B.2. Typical results of strain controlled- TxSS test ... 233
Figure B.3. Variation of pore pressure ratio and CSR as a consequence of cyclic shear ... 236
Figure B.4. Variation of the number of cycles to produce liquefaction as a function of cyclic strain ... 237
Figure B.5. Variation of normalized energy with H/D for different cyclic strain ... 237
Figure B.5. Shear stress distribution in TxSS specimen at the liquefaction triggering (a) D/H = 3.2, (b) D/H = 2 ... 238
LISTE DES TABLEAUX
Table 2.1. Peak counting methods (adapted from Dowling 1971) ... 36Table 2.2. Summary of the common used pore pressure models ... 42
Table 2.3. Correction Factor, Cr suggested in previous studies ... 50
Table 3.1. Physical properties of sands used ... 67
Table 4.1. Physical properties of sands used ... 81
Table 4.2. Summary of test conditions and results ... 85
Table 4.3. Summary of computing procedure of Neqγ ... 94
Table 5.1. Correction Factor, Cr suggested in previous studies ... 100
Table 5.2. Physical properties of the used sands ... 104
Table 5.3. Summary of experimental work ... 106
Table 5.4. Pore pressure model parameters ... 113
Table 5.5. SIG4 model parameters ... 113
Table 6.1. Physical properties of the used sands ... 131
Table 6.2. Summary of the experimental work ... 133
Table 6.3. Pore pressure model fitting parameters ... 136
Table 7.1. Sig 4 model parameters of Ottawa sand F65 ... 163
Table 7.2. Summary of cases under study ... 171
Table A.1. Summary of earthquake motions ... 221
Table B.1. Examples of experimental and analytical works on different types of simple shear apparatus ... 242
xv
LISTE DES SYMBOLES
Symbole Définition
Average horizontal shear stress
σd Deviator stress
σc Confining pressure
σ′mean initial effective mean confining pressure
σ′v0 initial effective vertical confining pressure
Cu uniformity coefficient
Cc curvature coefficient
eini initial void ratio before consolidation.
econs final void ratio after consolidation
emax maximum void ratio
emin minimum void ratio
ID Relative density of the soil.
’co initial effective confining pressure (kPa).
B Skempton’s pore pressure parameter.
rd stress reduction factor that accounts for the non-rigid response of the soil profile.
Internal angle of friction
D50 mean grain size
volumetric mass of soil (t/m3)
Vs shear wave velocity
Shear strain
th threshold shear strain
Gs specific gravity
Gmax, Ge Secant shear modulus at very low strain (c ≤ 10-4%)
Ke Bulk modulus
KeG elastic shear modulus number
{ü}, { {u} vector of relative nodal acceleration, velocities and displacements, respectively
{üg} acceleration at the base of the soil column
{I} unit vector
N Number of uniform loading cycles
NL Number of liquefaction cycles
Neq Number of equivalent uniform strain cycles
Neq Number of equivalent uniform stress cycles
Ru Generated pore water pressure
xvi
D(R-N) Cumulative damage using R-N hypothesis
Rn Cyclic ratio , Rn = N/NL
Ws Dissipated energy per unit weight of soil
Ws,ru=0.65 Cumulated dissipated energy at Ru = 0.65
r Material parameter
Er rebound modulus of static drained unloading test
K0 Coefficient of earth pressure at rest
α Pore pressure calibration parameter
β Empirical Pore pressure parameter
Pore pressure exponent
C1, C2, C3, C4 Calibration parameters of Martin model
μ Poisson's ratio
Δη change of shear stress ratio
Δp plastic shear strain increment
T0 fundament period of soil deposit
amax maximum induced acceleration at deposit surface (N1)60CS Normalized number of standard penetration blows
qc1 Normalized cone penetration resistance
LISTE DES ACRONYMES
Acronyme Définition
TxSS Combined Triaxial Simple Shear
CTX Cyclic Triaxial
DSS Direct Simple Shear
CSR Cyclic Stress Ratio
CSRt Threshold shear stress ratio
CRR Cyclic resistance ratio
CSR M=7.5 normalized CSRmax to M7.5,
CSR7.5= CSR max/MSF.Kσ
PGA Peak ground acceleration
PEC pseudo energy capacity
ENA Eastern North America
WNA Western North America
INTRODUCTION
1.1 General
In response to earthquake shaking, loose saturated soil tends to contract and decrease in volume. However, as the period of earthquake shaking is too small, drainage is not allowed. The tendency to decrease in volume results in an increase in pore pressure coincident with a decrease in effective stresses. Ultimately, the soil may lose its stiffness and behaves like a viscous fluid which is known as liquefaction (Seed and Lee 1966).
Liquefaction is one of the most important and damaging phenomena in soil dynamics (Castro and Poulos 1977). Following the destructive failure that occurred during the 1964 Alaska and Niigata earthquakes, special attention has been given to liquefaction potential assessment. Numerous experimental investigations have been done under both monotonic and cyclic loading conditions in attempts to better understanding this phenomenon and of soil behavior under seismic loading (e.g. Peacock and Seed 1968; Castro 1975; Vaid and Chern 1985; Vaid and Sivathayalan 1996). Experimental study of liquefaction potential must replicate the site conditions in terms of loading (initial stress state and stress path) and soil depositional (fabric, density) characteristics.
One of the main challenges in geotechnical earthquake engineering is determining the liquefaction potential of a soil deposit. Several procedures have been developed, over the years, to assess the liquefaction potential of a soil deposit subject to a given earthquake. The most widely used procedure is the simplified method which was developed by Professor H. B. Seed and his colleagues of Berkeley (Seed and Idriss 1971). Applying this semi-empirical procedure and its variants allow prediction of the induced cyclic stress ratio based on the maximum acceleration at the ground surface (amax) and the depth reduction factor (rd). This procedure has
been evolved over the years to consider the type of soil and characteristics of seismic events (Filali and Sbartai 2017; Norambuena et al. 2019). It is originally based on compiled earthquake
data from active tectonic seismic zones (e.g. western United States, Japan, and China). However, it is well recognized that there is a difference between the seismicity and geological crust between eastern and western North America (Jacob 1991; Youd et al. 2001; Humar 2015). Therefore, it has been questioned the validity of this method in eastern regions of North America which will be demonstrated in the present work.
1.2 Objectives of the research
The primary goal of this thesis is to establish and validate a coupled energy-based pore pressure model to be integrated into assessing the compatibility of the simplified method and the available liquefaction design charts for the eastern regions of Canada using the Combined Triaxial Simple Shear apparatus (TxSS). Basically, the objectives of this thesis can be listed as follow:
A new combined triaxial simple shear test is used in this study to develop a simple strain-controlled pore pressure damage metric formula and an energy-based pore pressure model. The former is employed in computing the equivalent number of uniform strain cycles for a random earthquake history whereas the latter is implemented in defining a coupled energy-based pore pressure model using FLAC2D and FLAC3D(Fast Lagrangian Analysis of Continua).
Another goal of this study is to apply the proposed energy-based model at the element-level to simulate the new combined triaxial simple shear (TxSS) test under stress and
strain-controlled conditions. Additionally, to simulate cyclic behavior under CTX tests for comparing with the TxSS numerical and experimental results.
Compare the liquefaction potential obtained from different experimental configurations (cyclic triaxial (CTX), TxSS, and direct simple shear (DSS)). Moreover, it emphasizes the
effect of shear loading pattern (i.e., strain-or stress-control).
After confirming the predictive capability in element-level tests performed on different cohesionless soils, another challenge is to validate the proposed model by simulating a dynamic centrifuge-model experiment performed by Ramirez et al. (2017; 2018) numerically using the proposed energy-based model and Finn model (Martin et al. 1975; Byrne 1991). This comparison aims to validate the proposed model to perform one-dimension analysis and estimate the liquefaction initiation in a free–field sand deposit subjected to a seismic event.
In the end, the proposed model is employed in one-dimensional analysis to investigate the difference between eastern and western North America seismic responses. A synthetic earthquake (Atkinson 2009) compatible with 2005 NBCC and another real earthquake from Western North America (Northridge earthquake) scaled-up to design spectrum class-A are excited at the base of hypothetical deposits of Ottawa sand F65 with different depths and densities.
1.3 Statement of originality
To capture these objectives, an experimental program was performed on selected cohesionless soils collected from different sites in Quebec (Baie-Saint-Paul, Carignan, and CF6B Quebec sands) in addition to two commercial clean sands (Ottawa sand C-109 and Ottawa sand F-65). The new combined triaxial simple shear apparatus (TxSS) is incorporated in this research as well as the conventional triaxial and direct simple shear test.
Cyclic strain-controlled TxSS test results are employed to develop an energy-based pore pressure
model. This proposed model is incorporated in a numerical coupled energy-based model to simulate cyclic stress and strain-controlled tests under TxSS and CTX conditions. The capability
of the proposed model to predict the liquefaction potential curve (CSR-Nliq) has been
accomplished by comparing the liquefaction potential curves experimentally obtained from CTX, TxSS, and DSS alongside those from earlier studies with the equivalent numerical results.
The numerical simulation reveals the cyclic difference under both test modes. Further, the proposed model and Finn-model are implemented in one-dimensional analysis to predict the pore pressure generation in response to a seismic event and compared to an experimental centrifuge model performed by (Ramirez et al. 2017).
The quantitative validation of the proposed numeric model defined in this study either in element-level (by comparing the TxSS and CTX tests to equivalent numerical simulations) or in
one dimension liquefaction analysis (by comparing to an experimental centrifuge model) confirms its predictive capability to capture cyclic behavior and liquefaction analysis.
The earthquake-induced cyclic stress ratio values of various hypothetical sand deposits are compared to the inherent cyclic resistance ratio obtained from experimental investigation and available liquefaction charts in terms of standard penetration test blow count (N1)60Cs.
Comparison between eastern and western earthquake responses in terms of pore pressure buildup and the equivalent number of uniform stress cycles reveals that the application of the available liquefaction charts in eastern regions of North America is questionable, as these charts were obtained from data compiled from highly seismic zones.
This thesis includes four papers; the first one was published in the Canadian Geotechnical Journal, the second and fourth papers have been submitted to the Canadian Geotechnical Journal, and the third paper has been submitted to the Journal of Computers and Geotechnics. Additionally, three conference papers resulted from this study.
1.4 Thesis outline
This thesis consists of eight chapters as illustrated in Figure 1.1. The contents of each chapter can be summarized as follows:
Chapter 1: Introduction: This chapter presents a brief review of the liquefaction phenomenon, the objective and the originality of this research.
Chapter 2: A literature review on the seismic difference between eastern and western North America, liquefaction evaluation approaches, the equivalent number of uniform cycles concept, and the most used pore pressure models are presented in chapter 2. The difference between liquefaction potential under different experimental configuration is also illustrated in this chapter.
Chapter 3: Experimental work. This chapter shows the apparatus used in the current study (TxSS, DSS, and CTX). The advantages and limitations of each apparatus are discussed. The
physical properties of the sands used and the preparation methods are described.
Chapter 4: First scientific journal article published: An extensive review of the fatigue-damage hypothesis and equivalent number concept in the metal realm and their adaption to liquefaction assessment is discussed in this chapter. A simple pore pressure formula as a function of the number of liquefaction cycles was proposed, as alternative to the R-N damage hypothesis (Richart and Newmark 1948). The results indicate the validity of using pore pressure buildup as a damage metric to compute the equivalent number of uniform strain cycles of random earthquake motion.
Chapter 5:Second scientific journal article submitted:
A comprehensive discussion on the variation of the cyclic behavior under triaxial and direct simple shear is illustrated. Based on TxSS cyclic strain-controlled tests, a coupled energy-based
pore pressure model was developed and successfully validated by relating to physical element-level tests. The influence of the diameter to height (D/H) ratio is discussed based on the TxSS
results. A comparison between liquefaction potential curves obtained in the literature and obtained from this study using DSS, TxSS and numerical simulation is performed under
stress-controlled conditions. Also, the liquefaction potential under strain-stress-controlled condition is examined in this chapter.
Chapter 6:Third scientific journal article submitted:
This chapter aims to validate the calibrated coupled energy-based pore pressure model to simulate the cyclic behavior in element-level test configurations (i.e. cyclic triaxial (CTX) and new combined triaxial simple shear (TxSS) tests) in FLAC3D. Therefore, a comparative
experimental program and numerical simulation of cyclic behavior under CTX and TxSS tests
were performed. The non-uniformity of shear strain distribution in CTX and TxSS and its effect
on the dissipated energy and triggering of liquefaction were closely examined. An empirical correlation between cyclic axial and shear strain was developed and verified successfully based on CTX stress-controlled results.
Chapter 7:Fourth scientific journal article submitted:
This chapter presents the application of the proposed model in a one-dimensional analysis and liquefaction assessment. At first, the proposed model and Finn model were used to simulate an experimental centrifuge model. Good consistency was observed between the numerical simulation and experimental model which confirm the applicability of the proposed energy-based model to perform one-dimensional analysis with an acceptable degree of confidence. Further, a synthetic earthquake (Atkinson 2009) compatible with eastern Canada seismicity and another real earthquake registered after the 1994 Northridge earthquake (M=6.7) were applied to hypothetical soil deposits having different fundamental periods to investigate the difference of seismic response between eastern and western regions and assess the applicability of the liquefaction charts for the eastern North America regions. The obtained results infer the inaccuracy of using the current liquefaction charts in the eastern regions of Canada.
Chapter 8: Conclusion and Recommendations.
This chapter enumerates the conclusion of the numerical and experimental results discussed throughout the dissertation in addition to recommendations for future work.
Figure 1.1: organization of the thesis
LITERATURE REVIEW
2.1 Introduction
As the soil liquefaction has induced incredible damage to engineering structures and loss of lives, one of the geotechnical engineers' challenges is determining the liquefaction vulnerability of a soil deposit to earthquake ground motions. It could be obtained by comparing the induced cyclic stress ratio, CSR, during seismic loading (demand) with the cyclic resistance ratio, CRR, representing the soil (capacity). In practice, the most widely used procedure in liquefaction assessment was initially developed by H.B. Seed and his colleagues in California termed “the simplified method” based on a compilation of tectonic earthquake data from highly seismic regions such as western North America, Japan, and China (Seed and Idriss 1971). Afterward, extensive work was done to determine CRR experimentally (e.g. cyclic triaxial, direct simple shear and torsional shear tests) or in-situ quantitative assessment by standard penetration test, SPT, (Seed et al. 1971), cone penetration test, CPT, (Seed et al. 1971; Boulanger and Idriss 2014), or shear wave velocity, Vs, (Andrus and Stokoe 2000).
2.2 The difference in seismic response between Eastern and Western North
America
The simplified procedure was incorporated in conjunction with in-situ data to introduce liquefaction charts (e.g. Seed et al. 1971; Cetin et al. 2004; and Idriss and Boulanger 2008). However, these charts are based on screening of actual events data compiled from high seismic regions (e.g., western region of United States) where the ground motions are distinguished by low-frequency content (rich in long-period motions) and lower peak ground acceleration, PGA, comparing to their counterparts in eastern North America at similar magnitude and source to site distance. Figure 2.1 demonstrates the spectral acceleration of two real earthquakes; Southern California (1952) and Saguenay (Quebec) (1988). The difference is evident in the predominated
frequencies of the two earthquakes. Moreover, it is well known that the geological crust between eastern (ENA) and western (WNA) North America are different. The attenuation of earthquake energy in ENA crust is lower with the distance from source compared with those in WNA (Jacob 1991; Adams and Halchuck 2004; Atkinson 1989; Campbell 2013; Humar 2015). Kramer (1996) reported that a higher amplification could occur in the east; due to the harder bedrock in ENA than WNA, i.e. peak ground acceleration is higher in ENA than in WNA, and the applicability of western design criteria in eastern regions is questionable depending on how far equivalent number of cycles is calculated.
In contrary, Youd et al. (2001) indicated that the difference between ENA and WNA is relatively small postulating that to the quick attenuation of earthquake motion throughout soil strata which results in filtering of high-frequency energy during the vertical propagation of shear waves. Moreover, Youd et al. (2001) reported that the difference between the peak horizontal acceleration at the ground surface, amax, in ENA and WNA could be alleviated by computing
PGA using the procedure recommended in the 1996 National Center for Earthquake Engineering Research (NCEER) workshop which considered the type of faulting, site condition, and location. Jacob (1992) summarized the difference between ENA and WNA seismic as (i) unknown of the potential failure surface of future events in ENA (lack of documented data), (ii) maintain the high-frequency content for large distance (lack of attenuation) and (iii) higher amplification in eastern regions. Therefore, a question arises here “are the liquefaction assessment procedures adopted in the western applicable to eastern North America?”
In the same contest, Bashir et al. (2017) and Basu et al. (2017), based on nonlinear liquefaction analysis using DEEPSOIL software v6.0, observed that the adopting of simplified method and incorporated liquefaction charts, in terms of SPT and Vs, in one-dimensional (1-D) liquefaction
assessment is not compatible in the Indian (Asia) seismicity zone. Similarly, Filali and Sbartai (2017) observed uncertainty of the simplified method compared with nonlinear response analysis for four different sites (three in the USA and one in Algeria). It was observed that, at amax=0.3,
the simplified method gives adequate results like the dynamic analysis, however, beyond this value, the simplified method results should be correlated as a function of the maximum ground acceleration as proposed by (Filali and Sbartai 2017).
Figure 2.1. Spectral accelerations of Western and Eastern earthquakes
2.3 Liquefaction Assessment
Over past years, liquefaction causes hundreds billion dollars in damage which devoted research centers around the world to assess soil liquefaction and pore pressure generation. Soil liquefaction results in damage to engineering structures and ground subsidence (NRC 1985). The safety factor against liquefaction is the ratio between the “capacity” of soil to sustain the applied load to the “demand load” imparted to the soil by earthquake ground motion, various recognized methodologies have been used in practice in liquefaction potential assessment to determine the safety factor such as:
1. Stress-based approach (e.g. Seed and Idriss 1971). 2. Strain-based approach (e.g. Dobry 1982)
3. Energy-based approach (Davis and Berrill 2001).
4. Numerical modeling analysis (e.g. Seed and Idriss 1969; Finn et al. 1977) 5. Arias intensity approach (e.g. Kayen and Mitchell 1997).
2.3.1 Stress-based liquefaction evaluation approach
In a stress-controlled test, a uniform stress wave at a significant frequency is applied on representative soil specimens whereas the response in terms of pore pressure buildup and induced shear strain is monitored. The liquefaction potential is obtained as the variation of CSR with the liquefaction cycles number, Nliq. In this approach, the initial liquefaction is defined as
the generated pore pressure ratio reaches unity or the induced shear strain reaches a significant value, single shear strain amplitude of 3.75%, (Seed and Lee 1966). It is common to determine CRR for a magnitude earthquake M=7.5 using the liquefaction potential curve corresponding to 15 cycles which represent the number of equivalent uniform cycles (Seed and Idriss 1982). It is noteworthy that the reconstituted specimen is more affected by many factors such as strain history, fabric, aging, and cementation. Therefore, correlating CRR with in-situ tests parameters such as Vs (Andrus and Stokoe 2000), the number of standard penetration blows, (N1)60cs, (Seed
et al. 1983), and the normalized cone penetration resistance, qc1n (Robertson and Wride 1998) are
advocated to acquire CRR in liquefaction assessment. In this thesis, (N1)60cs is incorporated in the
liquefaction assessment. This may be justified as (N1)60cs correlates much better to relative
density, ID, wherein ID reflects the inherent contractive tendencies of soil under shearing load.
[Note: (N1)60cs is the number of standard penetration blows counted in standard penetration test
(SPT) based on a hammer impact efficiency of 60% correlated to clean sand and an overburden pressure of 1 atm].
Stress-controlled liquefaction evaluation approach was recommended over years particularly after the development of the “simplified stress-controlled method” in the 1960s by H.B Seed and his colleagues and its application in the equivalent number concept. Seed et al. proposed a direct relation between the induced shear stress and maximum acceleration induced at the ground surface as discussed in detail in the next subsection.
2.3.1.1 The simplified stress-based method
Predicting earthquake-induced shear stresses is the challenge of researchers over the years. It may be predicted by numerical 1-D, 2-D or 3-D response analysis or empirically using the simplified stress-based method. The simplified method was established based on a compilation of earthquake data from active tectonic seismic zones such as California, Japan, and New Zealand (Seed and Idriss 1971). This method has undergone updates periodically based on the
evolution in understanding of liquefaction phenomenon and seismic behavior of soil depended on the previous earthquakes records besides experimentally and/or field data (e.g., SPT, CPT, and Vs) (e.g. Seed and Idriss 1983; Youd et al. 2001; Cetin et al. 2004; and Idriss and Boulanger 2008).
The simplified method aimed at computing the safety factor by comparing the induced CSR during seismic loading (demand) with the CRR (capacity) of soil.
MSF CSR CRR FS M . 5 . 7 (2.1)
where CRRM=7.5 is the cyclic resistance ratio corresponding to magnitude earthquake M=7.5,
CSR is the cyclic stress ratio in the response of earthquake shaking, and MSF is the magnitude scaling factor. Generally, susceptibility to liquefaction decreases with increasing the factor of safety.
Based on Newton’s Second Law, Seed and Idriss (1971) proposed the following formulation to compute the CSR at a given depth in the soil deposit:
av v
a g
v v
rdCSR /'0 0.65 max/ 0/'0 (2.2) where av is the average cyclic shear stress; amax is the peak horizontal acceleration at the ground
surface; g is the acceleration of gravity; v0 and ′v0 is the initial total and effective vertical
stress; rd is the stress reduction factor that accounts for the non-rigid response of the soil profile.
Figure 2.2 demonstrates the application of the simplified method as a comparison between the estimated CSR and CRR to ascertain where liquefaction may occur. As demonstrated, if the induced CSR is higher than CRR, i.e. safety factor < 1, liquefaction triggering is expected. The two questionable parameters in Eq. (1) are the value of rd and defining of amax for ground motion.
2.3.1.1.a Stress reduction factor rd
The stress reduction factor is a quantitative value account for the flexibility of the soil deposit during the earthquake shaking. It has the maximum value of unity at the ground surface and decreases by the profile depth, Figure 2.2(c), as a function of ground motion characteristics (magnitude and the frequency content) and dynamic characteristics of the soil profile (Seed and Idriss 1971; Idriss 1999). Cetin et al. (2004) reported that the proposed rd curves of Seed and
estimate rd values (e.g. Liao and Whitman 1986; Robertson and Wride 1998; Idriss 1999; Youd
et al. 2001; Cetin et al. 2004; Idriss and Boulanger 2008).
In the routine practice of geotechnical engineering, the recommended formula, Eq. (2.3), by the NCEER experts, has been used to estimate the average value of rd (Liao and Whitman 1986b;
Youd et al. 2001). z rd 1.00.00765 for z ≤ 9.15 m (2.3a) z rd 1.1740.00267 for 9.15 m < z ≤ 23 m (2.3b) where z is the depth in meters
Cetin (2004) performed an extensive numerical analysis on a compilation of 50 actual stratigraphy soil sites subjected to a wide range of actual ground motions (which cover the range from low to high magnitude and represented near-, mid- and far-field events). Most recently, extending to Cetin’s work, Lasley et al. (2016) performed a large number of equivalent linear site response analyses subjected to different ground motions. Using robustness statistical and regression analysis of response results, Lasley et al. (2016) introduced a modified rd relationship
(Eq. 2.4) having the least bias comparing to the previous preceding models.
1
exp
z
/
r
d (2.4a)
4.373 0.4491.Mw
exp
(2.4b) Mw . 247 . 6 11 . 20 (2.4c) where is limiting value of rd and can be range from 0 to 1; is a curvature coefficient atshallow depths; z is the depth in meters.
2.3.1.1.b Maximum ground acceleration
Another parameter related to the application of the simplified method is defining amax value. In
general, amax has been used to determine from field measurements or numerical analysis. SHAKE
program is one of the most widely used programs to study the nonlinear behavior during the shear wave propagation (Schnabel et al. 1972). Afterward, approximate relations between maximum acceleration on rock and soil surface have been developed (Idriss 1990).
Figure 2.2. Schematic illustration of the simplified stress-based method (after Seed and Idriss 1971)
Youd et al. (2001) recommended using the geometric mean of the two maximum horizontal accelerations (when there is available data). Boulanger and Idriss (2014) reported the difference between geometric mean and amax of horizontal motions is often about 10% for a level ground
surface that may have a relatively small effect on liquefaction analysis. Also, using the geometric mean alleviates the uncertainty of estimating amax particularly for geotechnical structures that
have weak/strong directions. It is noteworthy that, in the liquefaction studies, the amax of the
vertical component is usually neglected because of its very small value relative to the two orthogonalhorizontal components. However, other researchers preferred to consider the vertical component in liquefaction analysis (e.g. Atkinson 1989; Law et al. 1990).
2.3.1.1.c Cyclic resistance ratio (CRR)
Applying the simplified method enables expecting the induced cyclic shear stress profile after earthquake shaking, as shown in Figure 2.2. The variation of inherent CRR with depth can be obtained from the laboratory tests and/or from the correlation with in-situ tests such as SPT (Seed et al. 1985; Boulanger and Idriss 2008), CPT (Boulanger and Idriss 2014), and Vs (Andrus
and Stokoe 2000). In this study, SPT was adopted throughout to investigate the difference between ENA and WNA seismic response (Chapter 7).
The (N1)60CS values were computed within this work using its correlation to relative density, ID,
coefficient of uniformity, Cu, mean grain size, D50, and particles two-dimensional angularity,
A2D, (Ghali et al. 2019) as follows: 5 . 0 002 . 0 22 . 0 50 2 1 140 exp 2 u A D C D I N D (2.5) Based on the screening of extensive review of actual earthquakes from tectonic active seismic zones (e.g., WNA, Japan and Chine), a correlation between CRR and (N1)60cs was driven (e.g.
Youd et al. 2001). The most widely used CRR-(N1)60cs correlation for the clean sand in practical
liquefaction assessment was obtained by Boulanger and Idriss (2008), Figure 2.3, Eq. 2.6.
2.8 4 . 25 6 . 23 126 1 . 14 exp 4 60 1 3 60 1 2 60 1 60 1 1 , 5 . 7 ' cs cs cs cs atm M N N N N CRR v (2.6)2.3.1.1.d Magnitude scaling factors
The available liquefaction resistance curves in terms of (N1)60, qc1N, or Vs1 apply to clean-sand at
earthquake magnitude M7.5. Therefore, proposing a correlation to other magnitudes is needed in the liquefaction assessment framework. Seed and Idriss (1982), based on the limited earthquake data available in the 1970s, proposed a correction factor to correlate the produced CSR by different magnitude earthquakes to its equivalent at M7.5 termed “Magnitude scaling factor, MSF”. This correlation was revised by I. M. Idriss in the form:
56 . 2 24 . 2 / 10 Mw MSF (2.7) In the 1980s, from compiled data of different earthquake magnitude, Ambraseys (1988) proposed a correlation between CRR, (N1)60 and MSF. This correlation reveals the conserve of MSF
developed by Seed and Idriss. Arango (1994 and 1996) proposed a magnitude scaling factor based the largest compiled field data by applying the energy concept and Neq-Magnitude relationships developed by Seed and Idriss (1982). It was observed that the magnitude scaling factor values derived by Ambraseys (1988) and Arango (1996) induce larger MSF values for earthquake magnitude values less than 7. Andrus and Stokoe (1997) adopted the shear wave velocity technique to develop a correlation between Vs and CRR. After applying CRR-Vs to
different magnitude earthquakes another MSF formula was obtained.
Liu et al. (2001) applied a regression analysis on the two horizontal components of a huge earthquake data to introduce MSF relationships for clean sands. It was observed that the MSF is not simple as previously proposed, however, it varies systematically with earthquake characteristics (magnitude and duration), site to source distance, and soil characteristics.
Recently, cyclic behavior and soil characteristics have been considered in MSF relations. Cetin and Bilge (2012) developed MSF relationships that accounted for the dilational behavior as a relative function of relative density and overburden pressure.
Considering the characteristics of liquefaction potential curve, Idriss and Boulanger (2008), and Kishida and Tsai (2014) proposed a MSF relationship as function of soil parameter (b) and correlations of the earthquake magnitude with number of equivalent cycles, wherein soil parameter (b) is the slope of CSR-Nliq curves in log-log scale.
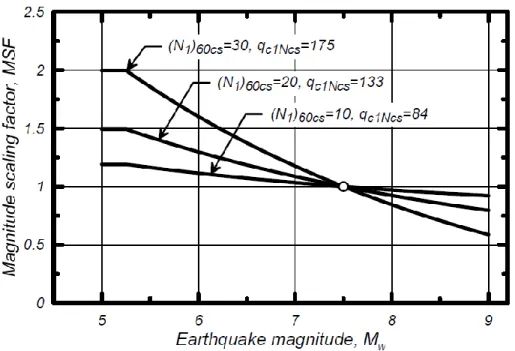
Idriss and Boulanger (2008) relation was revisited by Boulanger and Idriss (2008), as shown in Figure 2.4 for different (N1)60cs and qcaNcs, in general form as:
Figure 2.3. Cyclic resistance ratio (CRR) correlation from (N1)60cs
(from Idriss and Boulanger 2008)
1.325 4 exp 64 . 8 ) 1 ( 1 MSFmax M MSF (2.8)
where MSFmax is the maximum computed value corresponding to M=5.25 wherein its typical
values are 1.8 for sand and 1.09 for clay and plastic silt. It can be obtained by
2 . 2 180 09 . 1 3 1 max qC Ncs MSF (2.9a)
2 . 2 5 . 31 09 . 1 2 60 1 max N cs MSF (2.9b)Although the simple application of the stress-based simplified method and the abundance of empirical correlations between CRR and in-situ tests, the cyclic behavior and cyclic volume change of soils is affected more fundamentally by the cyclic strain amplitude than the cyclic stress amplitude (Wer and Dobry 1982; Dobry and Vucetic 1988; Vucetic 1994) as discussed in details in the following points:
- Undrained cyclic strain-controlled tests produce a quite consistent pore pressure data, regardless of differences in specimen fabric. Such consistent results obtained in strain-
Figure 2.4. Magnitude scaling factor based on qc1Ncs for cohesionless soil (from Boulanger and Idriss 2014)
controlled testing of sands strongly reveals that the shear strain is dominant parameter governing the densification of dry sand and the cyclic behavior of saturated sand in terms of pore pressure generation in saturated soils is the cyclic shear strain amplitude rather than cyclic shear stress amplitude (Silver and Seed 1971; Dobry and Vucetic 1988).
- Silver and Seed (1971) observed that the strain-controlled tests cause less water content redistribution in soil specimens before initial liquefaction occurs and provides more realistic predictions of in-situ pore pressures than those obtained from stress-controlled tests.
- Strain-controlled loading system enables proper characterization of strain-softening materials, although the stress-controlled loading system is generally simpler and permits prescribed stress paths to be followed with ease, (Vipulanantham 2011).
- Strain-controlled tests account for the post-cyclic volume change values to the cyclic shear strain amplitude. Neglecting these values in the stress-controlled test makes it less reliable in determination of shear modulus and damping ratio values, which are the main factors governing the cyclic behavior of soils (Sitharam et al. 2012; Almani et al. 2013).
- In general, cyclic strain-controlled loading directly relates pore pressure generation with the amplitude of shear strains (Martin et al. 1975; Byrne 1991).
2.3.2 Strain-controlled liquefaction evaluation approach
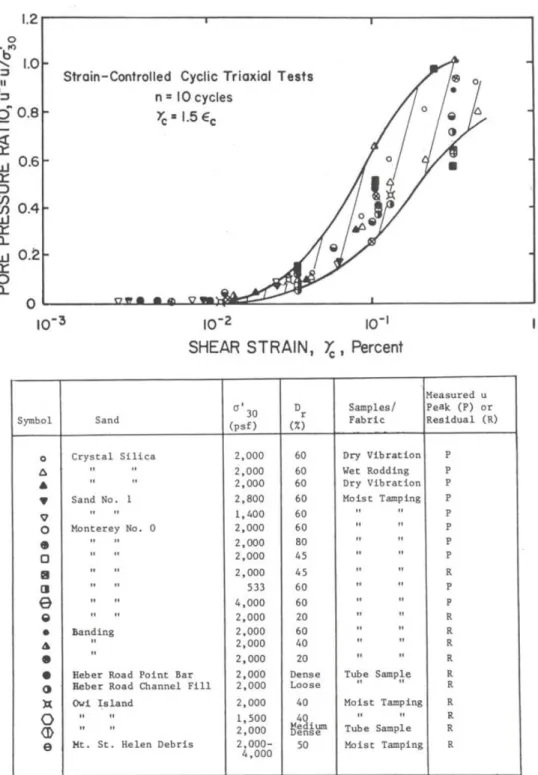
The cyclic strain approach is an alternative to the stress-based approach and considers shear strain rather than shear stress in liquefaction potential assessment (Silver and Park 1976; Dobry et al. 1982;Dobry and Abdoun 2015). Based on cyclic strain-controlled tests, Dobry et al. (1982) discerned a firm relation between cyclic shear strain amplitude and generated pore pressure ratio regardless of specimen fabric, density, deposition method or overconsolidation ratio as opposed to the stress-controlled tests as shown in Figure 2.5. This may be justified as the pore pressure generation is a shear strain phenomenon. In stress-controlled tests, the induced shear strains differ according to the reconstitution methods, wherein reconstitution methods inherently have a significant effect on soil stiffness. As noted by Vaid et al. (1987), the stress-controlled cyclic loading is preferred to simulate earthquake loading whereas similar cyclic strain-controlled loading is recommended in the volumetric strain and pore pressure generation studies.
Moreover, it was observed that no pore pressure can be generated if the shear strain amplitude is lower than the volumetric shear strain threshold value (tv = 0.01%) regardless of the number of
loading cycles, as shown in Figure 2.5. The compiled results of different sand revealed that the tv is independent of specimen fabric and initial effective confining pressure (Dobry et al. 1982;
NRC 1985). Hazirbaba and Rathje (2009) investigated the influence of fines content on the tv
and observed the increase of tv with increasing the fines content. In general, for most clean sand
tv ranged from 0.01% to 0.03%.
Liquefaction assessment using this approach was based on the premise of a volumetric shear strain threshold; if the earthquake-induced shear strain is higher than tv level, pore pressure will
be generated. The cyclic shear strain can be calculated alternatively to the stress-based simplified equation by (Dobry et al. 1982):
G c c
(2.10a)
c G G G r g a v d c max max max / 65 . 0 (2.10b)where Gmax is the secant shear modulus corresponding to very low strain (c ≤ 10-4%); (G/Gmax)c
must be used along with a modulus reduction curve (e.g., Darendeli 2001) to predict the G/Gmax
corresponding to c.
A schematic illustration of the iterative solution of Eq. (2.10b) is shown in Figure 2.6. At first, an assumed value of G/Gmax is used to compute c (iteration1). The value of c is used to calculate
the G/Gmax at the second iteration. This procedure is repeated many times until the difference
between the assumed and computed G/Gmax is within a tolerable error.
The generated pore pressure ratio may be estimated as a function of calculated c, Eq. (2.11), and
the number of equivalent uniform strain cycles, Neq, in conjunction with Ru-c experimental
obtained curves (Vucetic and Dobry 1988). [Note, Number of equivalent uniform strain cycles Neq is calculated corresponding to the assumption of Neq = Neq which is a function of
earthquake characterization (Tokimatsu and Seed 1987; Green and lee 2006)].
s th c eq s th c eq u F N f F N f R ) .( . . 1 ) .( . . . (2.11)
where Ru is the excess pore pressure ratio generated after Neqγ cycles of applied loading; f =1 or
2 for one- or two-dimensional loading, respectively; and p, F, and s are curve-fitting constants. Although there is a consensus on the importance of the strain-based approach in pore pressure buildup and liquefaction assessment, it has not been employed in practice. In an attempt to adopt this approach practically in liquefaction evaluation, Rodriguez-Arriaga and Green (2018) proposed a substitute procedure based on a strain-based pore pressure model. They assessed the efficacy of their approach based on a compiled shear wave velocity (Kayen et al. 2013) and standard penetration (Boulanger et al. 2012) database. Their statistical analysis reveals the accuracy of the stress-based approach rather than the strain-based approach in liquefaction assessment. They postulated the deficiency of their alternative approach to ignoring the inherent softening effect, i.e. decrease of soil stiffness, occurred due to pore pressure buildup during the iteration simulation of the earthquake loading. In contrast, as will be discussed later, the softening effect is re-evaluated through the current study.
It is recognized that the main deficiency of strain-based method is determining the cyclic shear strain compared with cyclic shear stress during earthquake excitation (Seed 1980; Zhang et al. 2015). Castro (1987) proposed that the maximum shear strain experienced by the soil during cyclic loading is equal to the maximum induced displacement divided by the layer thickness.
Figure 2.5. Boundaries of generated pore water pressure ratio versus shear strain at N = 10 cycles for various sands and densities (from Dobry 1985)
Figure 2.6. Determination of G/Gmax corresponding to c iteratively (from Green 2000)
2.3.3 Energy-based evaluation approach
In the 1970s, numerous energy-based liquefaction evaluation procedures have been developed after the pioneer work introduced by Nemat-Nasser and Shokooh (1979). Nemat-Nasser and Shokooh (1979) mathematically linked between the densification of soil in a drained test (infer to the excess pore pressure under undrained condition) to the needed dissipated energy for rearranging sand particles during cyclic loading. In the field realm, Davis and Berrill (1982) and Berrill and Davis (1985) adopted this approach in liquefaction potential evaluation by relating the pore pressure during earthquake loading to its magnitude, epicentral distance, initial effective overburden pressure, and SPT values. As much more, the energy concept was implemented in computing equivalent uniform stress cycles of irregular ground motion (Green and and Terri 2005) as well as in computing magnitude scaling factor (e.g. Arango 1996; Green 2001).
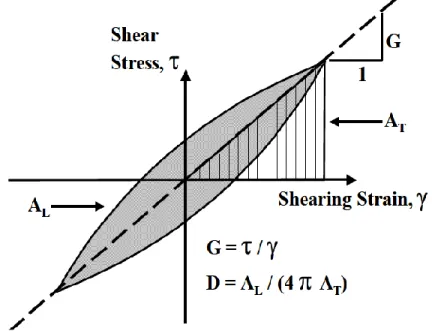
The normalized dissipated energy, Ws, is estimated by integrating the area bounded by hysteresis
loops (CSR-shear strain relation). Under cyclic direct simple shear test, Ws can be indicated by
the trapezoidal rule as schematically shown in Figure 2.7 and formulated as: ) )( ( 2 1 1 1 -n 1 i 1 i i i i s CSR CSR W