Forthcoming, Electronic Markets, 2005, vol. 15, n°3
Contrasted paths of adoption:
is e-business really converging toward
a common organizational model?
1Eric Brousseau
FORUM, University of Paris X Bruno Chaves
FORUM, University of Paris X
Abstract: This paper seeks to provide a clearer understanding of discrepancies observed in the level, pace and style of e-business development across countries and industries. It is based on an original survey performed on 1100 firms in five developed countries. Through in-depth analyses of the adoption, use and impact of e-business technologies and methods we highlight contrasted paths of adoption across countries and industries that cannot be explained by institutional and business factors alone. The dynamic of adoption or various types of technologies engages business networks on contrasted self-reinforcing paths that do not necessarily converge toward a common way of using ICTs to buy and sell or coordinate on-line. There are clearly two contrasted strategies. The first is to adopt e-business technologies and methods to enhance coordination with business partners. Such a strategy is aimed at saving costs. The second consists in adopting e-commerce technologies to buy and sell on-line. The latter strategy aims at increasing sales, but does not systematically do so. Success is linked to re-engineering and to the adoption of automated methods of coordination. Contrasted initial conditions result in businesses taking one of these two paths or blocking adoption at some point.
Keywords: Adoption, Use, Path Dependency, Barriers and Drivers to Commerce, e-Commerce Impacts, e-Business
1This research is part of the Globalization and E-Commerce Project of the Center for Research on Information
Technology and Organizations (CRITO) at the University of California, Irvine. The material is based upon work supported by the National Science Foundation under Grant No. 0085852. Any opinions, findings, and conclusions or recommendations expressed in this material are those of the author(s) and do not necessarily reflect the views of the National Science Foundation. We thank in particular Kenneth Kraemer for providing us with the data on which this paper is based. We thank the referees of this journal for their useful comments.
1. International contrasts in e-commerce adoption: Differentiated paces or
contrasted paths of adoption?
While e-commerce, and more generally e-business, is developing at a rapid pace in most developed and developing countries, the pace of development of these technologies and related business practices are quite contrasted across countries and industries. Most of the literature dedicated to the subject focuses on documenting the phenomenon (e.g. OECD [2004]). There have been a wide number of policy reports and papers dedicated to the subject, yet there has been very little research to really explain why there are such strong cross-national contrasts. In the MIS literature, cross-national wealth, the price of ITs and related services (in particular telecommunications), the dynamics of the local IT industry, the ‘globalization’ and openness of the economy, the existence of lead users, and pro-e-commerce governmental policies are all seen as strong drivers for the rapid adoption and intensive use of Information and Communication Technologies (ICTs) (e.g. Gibs et al., 2003, 2004; Zhu et al., 2003; Kramer and Dedrick, 2005). However, most studies on the diffusion of the Internet and related digital technologies and adoption of e-business methods are qualitative, and focus on a single country. Quantitative assessment of e-commerce needs to be qualified, and are therefore hardly comparable across industries and across countries since they rely on heterogeneous methodologies and since what is relevant may strongly differ from one industry to another (see Brousseau, 2000). It is then difficult to really explain differences among countries and to disentangle the possible explanations.
Understanding the determinants of the contrasted pace and path of e-commerce development across countries is essential, because differences in rate and pace of adoption can be explained either as being various stages along a common S shaped logistic curve of diffusion, or as being the result of differentiated paths of development across countries. For some analysts, e-business methods are a set of practices congruent with the ‘modern’ way of organizing economic activities. The global economy is converging toward a common and integrated organizational model. Fewer analysts consider national traditions to still matter a lot, not only because they explain ‘readiness’ and ‘starting date’, but because processes of change are qualitatively contrasted across industries and countries. ICTs are indeed quite flexible and do not ‘impose’ any organizational model (Brousseau & Rallet; 1998, 1999). Given contrasted initial conditions and differentiated processes of adoption and use, the type of technology that is implemented and used, and the related learning processes, leads to very contrasted paths of change across countries (see the literature on technology competition and diffusion: Arthur, 1989; David, 1985; Farrell and Saloner, 1986; Liebowitz and Margolis, 1994, 1995). Understanding whether we are facing convergent or differentiated processes of evolution is essential to set user strategies, to make decisions about design and implementation of various technical options and to design public policies.
This paper draws from a unique database developed in the framework of the Global Electronic Commerce (GEC) project funded by the National Science Foundation and coordinated by the Center for Research on Information Technology and Organizations (CRITO) at the University of California, Irvine. The project brought together researchers from 12 countries and was aimed at comparing the development of e-commerce in contrasted national environments. These efforts led to a survey to assess the motivations and uses of firms using the Internet to support business activities. The result is a unique database of firm-level data describing, on an internationally consistent basis, the adopted technologies, the type of uses, the costs (difficulties) and the benefits (impact) of e-business technologies and methods.
Basing ourselves on this database, and concentrating our investigations on developed countries only, we show that:
The contrasted pattern of e-commerce adoption and use across countries stems primarily from the fact that the proportion of firms using the various e-business methods differs across countries. Put another way, it is not the use of the individual adopters which is significantly different, but the proportion of adopters and users.
There are clearly two patterns of use and adoption. The first one relies on technologies aimed at setting deals on-line (i.e. at allowing the meeting of buyers and sellers, the negotiation of deals, and the management of operations related to commercial transactions: billing, payment). The second one relies on technologies aimed at enhancing and automating coordination among business partners once a deal has been negotiated. The later seeks to lower the cost of management of the ex-post part of inter-firm exchanges — when referring to the categories proposed by Williamson (1985) to analyze the performance of ‘transactions’ — , while the former category of technologies aims at supporting the ex-ante aspect of a transaction, especially to benefit from more competitive supply and to be more competitive on downstream markets. These two patterns do not necessarily converge toward a generalized use of ICTs to manage both the ex-ante and ex-post operations related to market transactions. Clearly there is a contrast between ‘commercial strategies’ aimed at increasing sales (and lowering supplying costs) and ‘coordination strategies’ aimed at reducing coordination costs. The perceived barriers to adoption evolve with the degree of use. Most advanced users see fewer obstacles to the development of e-business than less advanced users do. This reinforces the network effect (Katz & Shapiro, 1985; Shapiro & Varian, 1999) inherent to e-business methods, whose productivity directly follows from the adoption of these methods by the business partners. In an environment where there are more advanced users, the propensity to adopt and to increase the rate of use is higher, both because it is more profitable and because there are less perceived barriers.
We will detail these observations and interpretations in the following sections devoted to the description of the contrasted patterns of adoption and use (Section 3), to the perceived drivers and inhibitors (Section 4), and to the analysis of impact (Section 5). First, we will describe the database and the sample we have chosen to study. (Section 2).
This paper focuses on the uses by firms of various types of ITs to support various types of operations upstream or down-stream in the value chain. Throughout this paper, e-business (technologies or uses) will refer to the use of ICTs to perform any type of business related operation. E-commerce will refer to technologies and uses related to the performance of market transactions (getting in touch, negotiating, agreeing deals, paying). E-commerce is therefore a sub-category of e-business, the other aspect of e-business technologies and use being to support coordination between business partners (either non-market coordination or coordination between business partners; e.g. exchanging operational data, forecasts, sharing technical information, etc.). The relationship between technologies and uses is analyzed in section 3.2. Details about technologies included in the survey and their uses are given in section 2.2; the exact wording of the questions is indicated in the tables.
2. Data and research design
2.1 Explanatory factors for e-commerce contrasted paths of development
There are many possible factors to explain cross-country differences in the adoption and use of ICTs and e-commerce technologies. The GEC project is one of the first systematic attempts to explain these.
The first candidate factor is the level of development: richer countries have the means (wealth, infrastructure, and know-how) and the incentives (labor cost makes it worthwhile to introduce labor saving technologies and human capital allows to leverage their productivity) to invest in ICTs (Caselli & Coleman, 2001; Shih et al., 2005).
The second candidate factor is the economy’s degree of globalization. Kramer and Dedrick (2005) point out the national strategies of small and dynamic countries (Scandinavia, Asian Dragons, etc.).
The third candidate factor is the institutional environment. It is however important to be more precise and to point out the factors that potentially play a role and to really asses the influence of various ‘informal’ and ‘formal’ institutions (North, 1990).
The fourth candidate factor is incentives and the ability to implement technological and organizational innovations. They relate, on the one hand, to the strategic positioning of firms (which depends upon market structures, type of competition, etc.), and, on the other hand, to costs and the ability to manage organizational change.
In-depth case studies, such as those performed in the framework of the GEC project, point out the role played by many other factors, like the leading role of IT firms and of Government, the emergence of centers of attraction where the IT initiatives develop, the existence of specific weaknesses ─ either within the regulatory framework, or in the distribution channels, or linked to the geographic distribution of activities, etc… ─ that stimulate/inhibit the use of ITs by some players (Kraemer & Dedrick, 2005).
In this exploratory paper we would like to more precisely identify contrasted pattern of adoption at the firm level and how they relate to national and industrial specificities. Because our data set is not longitudinal, it is in fact difficult to precisely describe trajectories of adoption and use. Nevertheless, our exploratory study allows us to point out that different types of firms clearly do not implement the same technologies because they do not target identical uses. In particular there are clearly contrasted rationalization and market development strategies.
2.2. Data
The GEC project was carried out using multiple methods -- including analysis of secondary data, historical case studies, cross-country comparisons, survey -- to analyze the development of e-commerce in ten countries, namely: Brazil, China, Denmark, France, Germany, Japan, Mexico, Singapore, Taiwan and the United States of America. For each country, a historical case study and a qualitative analysis of the environmental and policy factors influencing
e-business adoption were performed, as well as a quantitative study of the nature of e-e-business use and the impacts of e-business2.
The present paper is based on the quantitative survey of e-business use. We decided to focus on developed countries only, to avoid the biases of mixing observations that do not correspond to the same representativeness. Indeed, the respondents were screened by the following question: ‘Do you use the Internet to buy, sell or support products or services?’. So, the final sample represents firms actually using the Internet for e-business, rather than the full population of firms in each country. This is an important distinction as it means that the firms are among the lead users in a country. It is probably acceptable to assume that these lead users represent similar percentages of firms across developed countries and across developing countries, respectively, but it is clear that the proportion differs strongly between developing and developed economies. Moreover, we can also speculate that the various factors impacting on users’ behaviors are quite contrasted between developing and developed countries. The present analysis focuses therefore on Denmark, France, Germany, Japan, and the United States. In-depth cases studies are also available on each of these 5 countries (respectively Bjorn-Andersen & Viborg Andersen, 2004, Brousseau & Chaves, 2004; Koenig
et al., 2004; Tachiki et al., 2004; Kraemer et al., 2002).
Data was gathered, from February to April 2002, through a telephone survey of 2,139 establishments worldwide. A stratified random sample was used; drawing from company lists representative of each local market and stratified by industry and firm size within each country. The overall response rate was 13%. Establishments were selected from three major industry sectors: manufacturing, distribution (wholesale and retail), and finance (banking and insurance). The sample breaks down into approximately 300 establishments in the U.S. and 200 in each of the other countries, and is evenly split by industry as well as firm size (from 25 to 250 and 250 or more employees) in each country. Respondents were primarily CIOs, CEOs, or IS managers who were responsible for making the firm’s IT-related decisions. A predetermined number of interviews were completed in each establishment size and industry category to ensure an adequate sample reporting on each country’s establishment size and industry group with a 95% confidence interval. The strategy to collect data at the establishment level is explained by the desire to ensure reliability in data collection.
The survey covers a number of topics related to the adoption, use and impact of the Internet and e-business.
Firm characteristics: Industry sector, size of the establishment, and size of the company
(number of physical locations, number of employees).
E-business readiness:
• Use is assessed through the existence of websites accessible to the public, and the use of e-mail, intranet, extranet (accessible to suppliers or business partners, by consumers), EDI (whether standard or ‘Internet’ EDI), EFT, or call centers.
• Use is qualified by the following types of business oriented applications: advertising and marketing, online sales, after-sales customer service and support, online purchases, exchanges of operational data with suppliers, exchanges of operational data
with business customers, and integration of business processes with suppliers/business partners.
Key barriers and incentives: The surveyed companies are asked their opinion on what they
consider to be key drivers and inhibitors to the use of the Internet and e-business in their specific case. This was performed though a five point Likert scale measure:
Drivers are customer demands, pressure from major competitors, requests from suppliers or government for public procurement, incentives provided by government, the need to reduce costs, to expand market for existing products/services, to enter new businesses or markets, or to improve coordination between customers and suppliers.
Potential barriers are the need for face-to-face interaction, concerns about privacy of data or security issues, the fact that customers do not use the technology, the difficulty in finding staff with e-commerce expertise, the costs of implementing an e-commerce site, the required organizational changes, the low ability to use the Internet as part of a business strategy, the cost of Internet access, business laws that do not support e-commerce, the taxation of Internet sites, and the inadequate legal protection for Internet purchases.
Impact of online business: The impact of online business is also measured by a subjective
Likert-ranked assessment of the influence of the Internet on various variables such as the efficiency of internal processes, staff productivity, the evolution of sales, the scope of sales, the quality of service to the customer, the internationalization of sales, the level of procurement costs, inventory costs, the quality of coordination with suppliers, the competitive position, the intensity of competition, or the number of distribution channels, suppliers, and competitors.
2.3. Methodology
Our paper is based on data-analysis performed over these variables describing 1130 firms in 5 countries3. To contrast various groups of firms featured by their behavior, we performed
several hierarchical and non-hierarchical classifications based on Principal Components Analyze (PCA; see Jolliffe, 2002). This procedure -- using the score of the individuals in the PCA rather than the value of initial variables -- eliminates most of the random fluctuations that generally account for most of the variance of the less discriminatory items (Lebart, Morineau, Piron, 2002, pp. 185-188). This results in more consistent clusters.
These clusters result from a two-step procedure using both hierarchical and non-hierarchical automated classifications. First, we perform a Hierarchical Ascendant Classification (HAC) using Ward’s criterion on the principal components scores to define the number of clusters. Then, we rely on the k-means procedure to actually form the clusters on the principal
3Data is gathered at the ‘establishment’ level and refers, in principle, to the establishment only. We decided to
use the direct measures provided by the establishment instead of weighing them on the basis of the company size. Weighted measures can be difficult to interpret. Indeed, if an establishment maintains a single central website, the weighted measure will multiply its data by the number of establishments in the company or by a ratio linked to its share of total employment. This can overweight the number of websites of the firm, or its IT expenditures, etc. On the contrary, if the interviewed establishment is not the one that operates the Internet-based operations, this company’s propensity to use the Internet and e-commerce will be underestimated. These biases can be significant if one compares sub-population (e.g. sector or countries) with different structures in terms of a firm’s size.
components scores4. This procedure allows us to benefit from the reliability of the k-means clustering method without having to specify arbitrarily the number clusters.
2.4. The sample
About 200 firms ─ 300 in the US ─ were questioned in each country. The survey was designed to guarantee balance among various categories of firms given their industry and their size. Our sample is therefore well balanced across countries and industries.
Table 1: The Surveyed Population by Nationality and Industry
Site's Primary Industry Denmark France Germany Japan USA Total
Manufacturing 69 68 68 95 100 400
Retail/Wholesale Distribution 67 64 66 66 100 363
Banking/Insurance/Other Finance 64 69 68 66 100 367
Total 200 201 202 227 300 1130
Source: CRITO Global E-Commerce Survey 2002
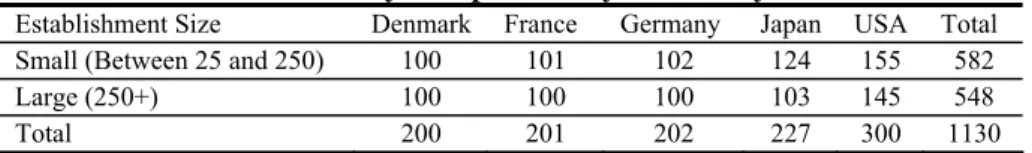
Table 2: The Surveyed Population by Nationality and Size
Establishment Size Denmark France Germany Japan USA Total
Small (Between 25 and 250) 100 101 102 124 155 582
Large (250+) 100 100 100 103 145 548
Total 200 201 202 227 300 1130
Source: CRITO Global E-Commerce Survey 2002
Given the number of items, a significant number of firms did not answer all questions. Questions related to the more advanced uses of ICTs, which request a minimal technical expertise, were the most ‘unanswered’. Missing data may induce biases. It may be the case that less advanced users have a lower knowledge of the technology than more advanced ones. We checked and found that the respondents who did not answered the most technical questions, show a significant lower propensity to sell on-line that those who replied technical questions, whatever their answer is. We used listwise deletion as a data imputation method for missing values5. However, because of the possible biases we then decided not to include in our analysis the questions for which there are more than 10% of missing values in the sample.
3. Contrasted patterns of adoption and use
3.1. The misleading national or sectoral ‘means’
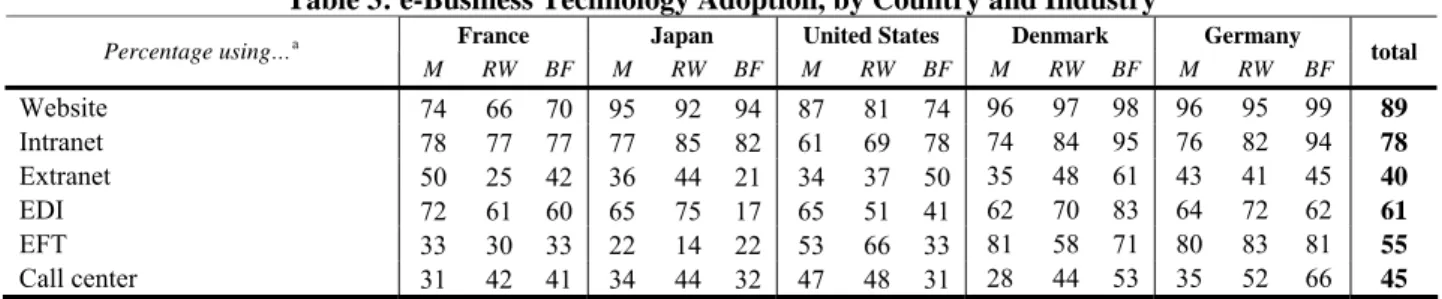
A first look at the data seems to suggest that there is a common trend of adoption and use of ICTs and related business methods. Table 3 and 4 state clearly that simpler technologies are more widely diffused. Firms use of e-business technologies follows an evolutionary pattern. The pattern is from (generic) customer-oriented applications (web-site), to employee oriented applications (intranet), to business partners oriented technologies (extranet) and, finally, to e-commerce per se. Firms therefore make multiple uses of Internet for business, but clearly selling on-line is the least frequent one. Double as many firms (68%) use Internet for advertising and marketing as for selling line (36%). This is of course because selling on-line is more complex, not only because it requires more complex technologies (essentially to
4 We used the k-means procedure and the Ascending Hierarchical Clustering based on the Ward criterion
(available on SPSS v.13).
manage security and payments), but also because it requires a re-engineering of the company’s downstream operations. As pointed out below, there may also exist ‘natural’ barriers to selling on-line, in particular when the provision of a good or a service require ‘face-to-face’ interactions because it is complex, because there are uncertainties about quality, etc. There are however operations that are easier to ‘digitize’, like the provision of customer service or support, which is widespread in the sample (48%).
At the same time, there are significant differences across industries and countries.
• First, there is no general relationship between adoption and use. While it is clear that banks and financial companies in Japan and in France are both low adopters of ITs in general and low users of e-business technologies (as compared to their foreign counterparts), manufacturing industries in both countries rank first as users of technologies to coordinate with their business partners while they are low adopters of several (Internet related) technologies. This justifies focusing on uses, and not only on technology adoption when analyzing the development and impact of e-business.
• Second, these figures suggest that contrasted paths of adoption and use exist across countries. Clearly, the five surveyed countries are not contrasted by a level of e-business adoption that would be either homogeneous across industries, or that would result in a homogeneous ranking of the country for each industry and usage considered. Most countries in our sample rank first at least for one type of adoption or use in a specific industry, suggesting that various subsets of national industries, in relation to factors that require explanation, follow contrasted strategies of adoption, leading to contrasted behaviors within countries.
Table 3: e-Business Technology Adoption, by Country and Industry
France Japan United States Denmark Germany
Percentage using…a M RW BF M RW BF M RW BF M RW BF M RW BF total Website 74 66 70 95 92 94 87 81 74 96 97 98 96 95 99 89 Intranet 78 77 77 77 85 82 61 69 78 74 84 95 76 82 94 78 Extranet 50 25 42 36 44 21 34 37 50 35 48 61 43 41 45 40 EDI 72 61 60 65 75 17 65 51 41 62 70 83 64 72 62 61 EFT 33 30 33 22 14 22 53 66 33 81 58 71 80 83 81 55 Call center 31 42 41 34 44 32 47 48 31 28 44 53 35 52 66 45
Source: CRITO Global E-Commerce Survey 2002, own calculations, unweighted M = Manufacturing, RW = Retail & Wholesale, BF = Banking – Finance
a Exact wording of question: Does your establishment use…? Percent answering Yes.
Table 4: e-Business Uses, by Nationality and Industry
France Japan United States Denmark Germany
Percentage using…a
M RW BF M RW BF M RW BF M RW BF M RW BF total
Advertising and marketing 40 37 51 51 51 58 70 68 85 71 92 86 74 82 93 68
Making sales on-line 13 23 25 24 28 35 28 62 40 23 45 63 26 48 49 36
After sales customer service and support 25 20 29 39 34 37 54 66 68 46 56 65 45 44 68 48
Making purchases on-line 29 22 32 43 41 32 81 74 76 75 71 80 55 59 41 56
Exchanging operational data with suppliers 61 39 40 57 66 29 52 49 48 45 55 62 52 66 31 50 Exchanging operational data with customers 62 27 36 65 58 32 67 54 71 46 43 53 55 52 45 52
Integrating business processes 29 22 27 18 27 13 40 38 45 31 46 46 28 46 30 33
Source: CRITO Global E-Commerce Survey 2002, own calculations, unweighted M = Manufacturing, RW = Retail & Wholesale, BF = Banking – Finance
3.2 A typology of e-business technologies
It seems more productive therefore to consider the relationship between adoption and use at a subtler level by considering various patterns and/or stages of adoption. A cluster analysis of the variables highlights how they relate to each other. On the basis of the Ward criterion, it is possible to contrast four groups of technologies and uses.
Table 5 : Technology adoption and e-business usages
Group Technology adoption / usages technology Web-site
technology Intranet Group 1
usage Advertising and Market Purposes usage Exchanging operational data with suppliers usage Exchanging operational data with business customers Group 2
usage Integrating the same business processes with suppliers or other buyers technology Call center
usage Making sales online
usage After sales customer service and support Group 3
technology Extranet technology EFT
usage Making purchases online Group 4
technology EDI
• The first one corresponds to the adoption and use of standard Internet technologies. It is however a somewhat light level of adoption and use, in the sense that here Internet technologies are just used as an additional communication medium6 and as an on-line show-window that does not allow on-line selling.
• The second group of technologies and uses consists in integrating upstream and downstream operations. It corresponds to an advanced stage of adoption and use, since it relates to the integration of information systems and the operations of business partners. We will see later on that this type of use corresponds either to an independent strategy aimed at using on-line tools to coordinate more efficiently, or to a strategy combined with the development of on-line sales
• The third group of technologies and uses consists in deploying means to sell on-line. It is important to note that these technologies do not consist in web-based technologies alone, and that various complementary technologies are combined both to sell and to provide after-sale services at a distance.
• The fourth group relies on the web to perform basic coordination on-line. Clearly, this does not correspond to advanced uses since EFT are generally performed by using means provided by financial establishments, since purchases are operated on-line by accessing to other companies’ web sites, and since EDI in this survey encompasses both web and traditional EDI.
6 In this survey the definition of intranet is quite extensive, since it covers any system used to share and to
exchange internal information. It is therefore not a really discriminatory technology and less advanced users have a tendency to over-estimate their use of Intranet. This is why it appears to be a technology as common as websites. Exact wording: ‘An intranet is a private, internally-accessible Website that provides information about the firm to employees. Does your establishment use an intranet?’.
If one ranks the various groups of technologies/uses by degree of advancement, standard Internet technologies adoption and use (group 1) corresponds to a first stage; it is followed by basic coordination on-line (group 4) which does not require significant technical investments and organizational changes. There are then two types of development. One consists in automating coordination with business partners (group 2). The other consists in selling on-line (group 3). In both cases the technical investments are significant, and the re-engineering of business processes is required. We will show below that these two strategies are quite contrasted leading to different paths of development. Often, firms choose one or the other strategy. In the following sections we try to understand why various strategies are followed. To do so we need to more clearly describe patterns of adoption.
3.3 A typology of adoption and uses
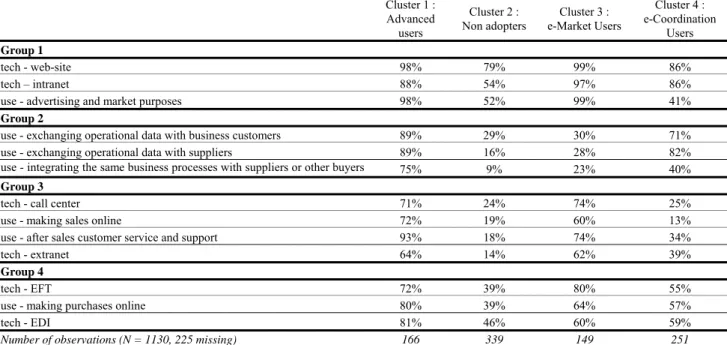
To identify patterns of adoption, we run a cluster analysis of adoption and use of e-commerce technologies on individuals. Our clusters are based on the Ward method with binary Euclidean distances as the dissimilarity measure, which fit for dichotomic variables. This methodology allows us to contrast four patterns of adoption:
• Cluster 1 groups Advanced Users that have a higher rate of adoption and use of e-commerce technologies and practices.
• Cluster 2 groups firms who are poor adopters and users of most of e-business related technologies and practices. They are in fact users of standard Internet technologies (those belonging to group 17), but do not use them to support any innovative practice. They can therefore be qualified as Non-Adopters of e-business.
• Cluster 3 groups firms that can be qualified as e-Market Users since they implement technologies to sell or buy on-line. Compared to the members of cluster 1 they are poorer users of all technologies, but they clearly focus on technologies and uses of group 3 and 4 aimed at selling and purchasing on-line.
• By contrast Cluster 4 gathers firms that use e-business technologies to automate coordination with their partners and their clients by relying on group 2 technologies and uses. We will qualify them as e-Coordination Users.
7EFT may appear as an exception. However, while it refers to group 4 (buying on-line) we already mentioned
that EFT does not refer to advanced use since it is provided by a third party. Less advanced users can easily implement EFT.
Table 6 : A Cluster Analysis of e-Business Technologies Adoption and Use Cluster 1 : Advanced users Cluster 2 : Non adopters Cluster 3 : e-Market Users Cluster 4 : e-Coordination Users Group 1 tech - web-site 98% 79% 99% 86% tech – intranet 88% 54% 97% 86%
use - advertising and market purposes 98% 52% 99% 41%
Group 2
use - exchanging operational data with business customers 89% 29% 30% 71% use - exchanging operational data with suppliers 89% 16% 28% 82%
use - integrating the same business processes with suppliers or other buyers 75% 9% 23% 40%
Group 3
tech - call center 71% 24% 74% 25%
use - making sales online 72% 19% 60% 13%
use - after sales customer service and support 93% 18% 74% 34%
tech - extranet 64% 14% 62% 39%
Group 4
tech - EFT 72% 39% 80% 55%
use - making purchases online 80% 39% 64% 57%
tech - EDI 81% 46% 60% 59%
Number of observations (N = 1130, 225 missing) 166 339 149 251
This typology suggests several patterns of adoption. Indeed it is not clear whether e-Market Users and e-Coordination Users are called to converge toward the category of advanced users. It may be the case that e-Coordination Users are operating on markets on which long term cooperative relationships are prevalent, or that they are purchasing/selling goods that require face-to-face interactions to be traded. In such cases, they have no reason to use e-business technologies to agree deals on-line. On the contrary, e-market users operate on markets where spot transactions are prevalent. Internet based techniques are very useful to search vendors and clients and to sell on-line, but there may be few incentives to manage on-line coordination among firms when deals have been made (e.g. because most operations are already described and scheduled and ex-post adjustments are useless or impossible to manage on-line). Cluster 3 and 4 could therefore correspond to transitory stages of adoption (whose end would be the pattern of adoption/use of the advanced users; group 1), or to two different types of e-business use/adoption linked to contrasted transaction and coordination needs. It should be pointed out that these contrasted needs can depend both upon the very nature of the activity (i.e. the type of good/service transacted) and upon the behaviour of business partners (e.g. it is irrelevant to try to sell on-line if potential clients are not on-line, as it is hopeless to develop digital coordination means if business partners do not have the same adoption strategy).
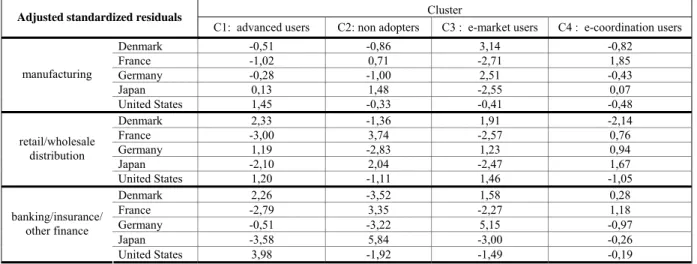
It is also interesting to compare how these various categories spread across industries and countries. Table 7 provides the ‘adjusted standardized residuals’, which is the residual for a cell (observed minus expected value) divided by the square root of the expected value and adjusted for the row and column totals (see Haberman, 1978, p. 111). The resulting standardized residual is expressed in standard deviation units above or below the mean, and expresses therefore the impact of the nationality of the industry on the behavior of firms. First, all types of adopters/users are present in all the countries and industries, but their proportions differ. The most noticeable over/under representations are the following:
• Advanced users are over represented in all the industries in the US, while they are concentrated in some specific industries in the other countries (in the Danish distribution and financial sectors and in the German distribution industry).
• E-market users are essentially concentrated in Denmark and Germany, especially in the manufacturing industries, and in the German banking industry.
• E-coordination users are concentrated in the Japanese distribution industry and in the French manufacturing and banking industries.
• Non-adopters are clearly over-represented in the French and Japanese distribution and banking industries
However, this distribution especially highlights the lack of homogeneous industry profiles across countries, or national profiles across countries. Means observed either in industries or on countries result from aggregating very contrasted patterns of behaviour, which do not necessarily result in a consistent picture. Sectoral and national factors by no means explain everything.
Table 7: e-Business Technologies Adoption and Use, by Country and Industry
Cluster
Adjusted standardized residuals
C1: advanced users C2: non adopters C3 : e-market users C4 : e-coordination users
Denmark -0,51 -0,86 3,14 -0,82 France -1,02 0,71 -2,71 1,85 Germany -0,28 -1,00 2,51 -0,43 Japan 0,13 1,48 -2,55 0,07 manufacturing United States 1,45 -0,33 -0,41 -0,48 Denmark 2,33 -1,36 1,91 -2,14 France -3,00 3,74 -2,57 0,76 Germany 1,19 -2,83 1,23 0,94 Japan -2,10 2,04 -2,47 1,67 retail/wholesale distribution United States 1,20 -1,11 1,46 -1,05 Denmark 2,26 -3,52 1,58 0,28 France -2,79 3,35 -2,27 1,18 Germany -0,51 -3,22 5,15 -0,97 Japan -3,58 5,84 -3,00 -0,26 banking/insurance/ other finance United States 3,98 -1,92 -1,49 -0,19
4. Drivers and Inhibitors as revelators of contrasted strategies
To pursue this analysis, we begin by examining the drivers and inhibitors of e-business technologies and uses. We will show that there are contrasted strategies and constraints behind the development of e-commerce.
4.1 The Drivers of e-Business
The main drivers for the adoption and use of e-business technologies and methods can be ranked in the following order (Table 8). First and foremost, e-business is developed to improve coordination with partners, then to expand markets, then to increase competitiveness, in particular to react to a move by partners (the willingness to reduce cost ranks lower than these considerations). The last set of reasons to adopt e-business is the pressure of business partners, the pressure of clients being the most significant (the pressure of the government being the least mentioned).
The actual intensity of these various criteria slightly differs across industries and countries, while their hierarchy remains quite stable.
Table 8: e-Business Drivers, by Nationality and Industry
France Japan United States Denmark Germany
% indicating it as a
significant factor a M RW BF M RW BF M RW BF M RW BF M RW BF
Improve coordination 36 38 37 48 48 32 56 48 51 57 55 54 50 58 37 Expand market 26 23 34 49 40 45 51 56 65 38 42 44 38 38 37 Major competitors on-line 23 22 33 36 34 41 30 40 63 30 37 46 33 36 67 Customers demanded it 22 13 22 52 55 29 35 39 47 45 47 55 34 26 46 To reduce costs 21 19 16 47 41 28 38 39 43 45 54 56 24 23 26 Enter new markets 23 18 25 21 42 31 44 45 44 32 36 37 37 44 34 Suppliers required it 11 6 8 33 38 14 27 16 13 24 17 15 22 15 3 Gov. procurement 15 14 18 24 3 5 13 6 5 11 18 5 9 8 6 Gov. provided incentives 1 10 6 6 0 0 4 2 2 3 8 7 5 2 6 Source: CRITO Global E-Commerce Survey 2002, own calculations, unweighted
M = Manufacturing, RW = Retail & Wholesale, BF = Banking – Finance
a Exact wording of question: Using a 5-point scale where 5 is ‘a very significant factor’ and 1 is ‘not a factor at all’, please rate how
significant each of the following was to your organization’s decision to begin using the Internet for business. A score of 4 or 5 was classified as ‘a significant factor’.
To better understand the differences across countries and industries, it seems useful, however, to contrast various patterns of drivers by firm and to see how they are distributed.
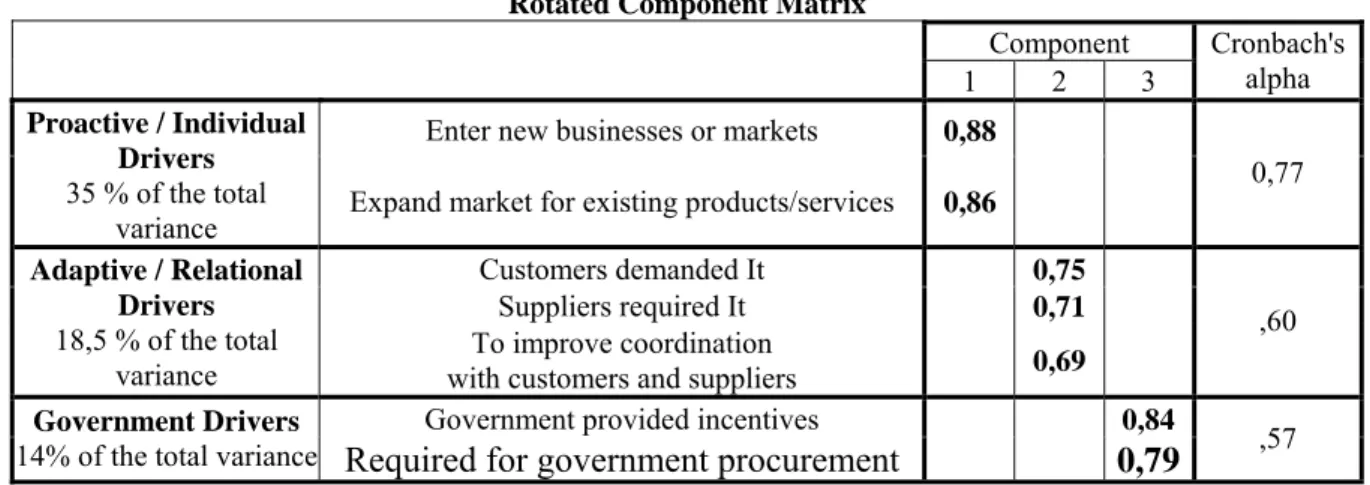
First, we perform, a Principal Component Analysis (PCA). Results (Table 9) can be interpreted along the following line. Three main factors differentiate firms. First there are firms that are clearly driven by the will to increase sales, either by penetrating new markets or by expanding their market share. Second, firms can be adaptive and adopt e-business methods because their partners desire for it, in particular to improve coordination efficiency. The third most discriminating factor, is government pressure through incentives or legislation. The latter factor is however less significant than the two first ones.
This allows us to contrast two main motivations for adoption, which can be combined in some cases. On the one hand, there are pro-active motivations oriented toward enhancing one’s performance on the market. On the other hand, there are adaptive strategies linked to the necessity to rationalize coordination with business partners.
Table 9: The Most Discriminating e-Business Drivers Rotated Component Matrix
Component
1 2 3
Cronbach's alpha Enter new businesses or markets 0,88
Proactive / Individual Drivers
35 % of the total
variance Expand market for existing products/services 0,86 0,77 Customers demanded It 0,75 Suppliers required It 0,71 Adaptive / Relational Drivers 18,5 % of the total
variance with customers and suppliers To improve coordination 0,69 ,60 Government provided incentives 0,84 Government Drivers
14% of the total variance Required for government procurement 0,79 ,57
Extraction Method: Principal Component Analysis. Rotation Method: Varimax with Kaiser Normalization. Only absolute values superior to 0,4
67,5% of the total variance is explained
On the basis of this PCA, we run an automated clustering. The analysis of the aggregation pattern based on the Ward criteria indicates that the most relevant number of clusters is four. We then run a non-hierarchic clustering on the basis of the k-means criteria. Results are shown in the appendix (table 14).
• Cluster 1 is made of firms that are poorly incited to adopt and use;
• Cluster 2 consists of firms that are essentially reactive to partners’ wishes (adaptive); • Cluster 3 groups firms that are strongly incited by the will to expand their markets
(proactive);
• the firms in Cluster 4 are concerned by government drivers;
We analyzed how firms belonging to these various classes are represented across countries8. Differences across countries clearly lie in significant distribution divergences among them. While the four patterns of behaviors are well balanced throughout the whole sample, France is clearly different because there are very few firms that are motivated both by market expansion and business partners, while more than half of the firms are poorly incited to adopt. Japan is characterized both by the frequency of strongly adaptive firms and the scarcity of proactive ones, while it is almost the opposite in the US. Germany has a similar profile to France, except that there are less poorly incited firms and more firms showing mixed incentives. Denmark is characterized by the lowest share of poorly incited firms. These confirm that the differences among national patterns of adoption do not mean that all the firms in a country are less incited to adopt, but that the proportion of firms incited to adopt is contrasted across countries. Furthermore, the firms that adopt are incited by different motivations.
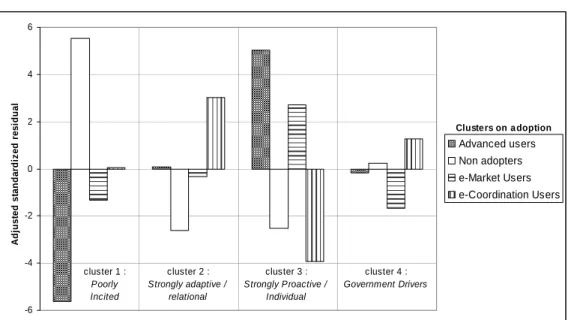
It is also stimulating to analyze how the motivations relate to pattern of adoption and use of commerce. Figure 1 show clearly that adaptive firms are more likely to be oriented toward e-coordination, while pro-active firms are more likely to be either e-market users or advanced users. To the opposite, an important proportion of non-adopters is poorly incited. Those who are driven by government factors coordinate, but do not sale on-line.
Figure 1: Drivers for e-Business and Adoption
Cross Tabulation between Clusters on Drivers and Adoption of e-Commerce Technologies
-6 -4 -2 0 2 4 6
Clusters on drivers of doing business on the Inte rne t
Ad ju st e d st a n d a rd iz ed r esi d u a l Advanced users Non adopters e-Market Users e-Coordination Users cluster 1 : Poorly Incited cluster 2 : Strongly adaptive / relational cluster 3 : Strongly Proactive / Individual cluster 4 : Government Drivers Clusters on a doption
4.2. Barriers to e-Business evolving with the types and degree of use
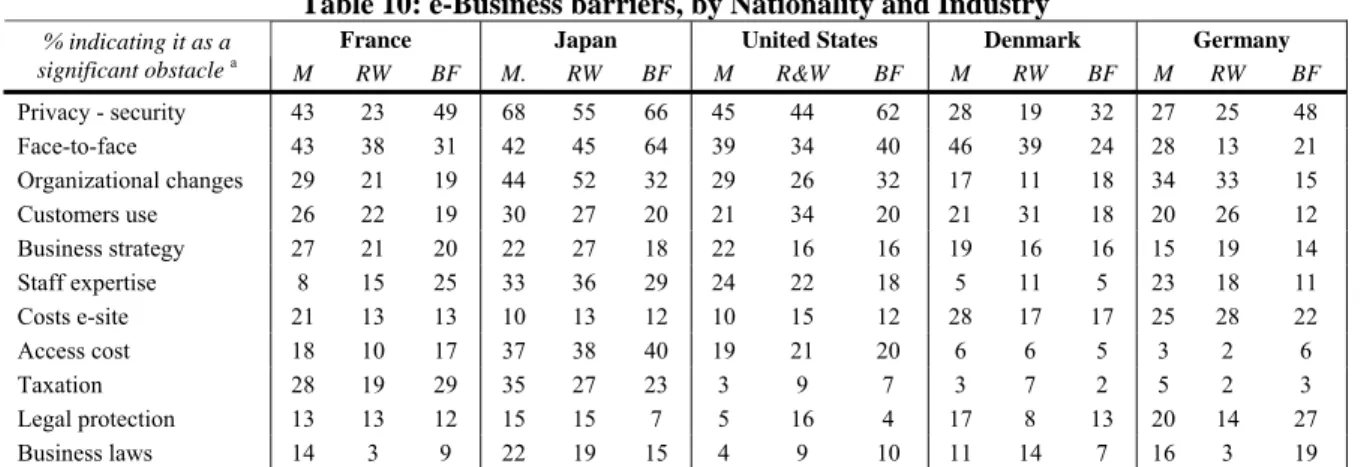
When one examines the factors that are considered by respondents as inhibitors of e-commerce development, there is, again, a convergence to rank the various factors along the same hierarchy, although it is less homogeneous than for drivers (Table 10). Relational constraints (need for privacy and face-to-face meeting, but also the necessity to manage organizational change or to benefit from customers’ awareness) rank first, especially in France and in Japan. It has to be pointed out, however, that the hierarchy among the various factors pertaining to this category can change across countries/industries. The availability and costs of resources (in a wide sense from the cost of a web-site to the lack of staff expertise) rank second. Again there are internal variations. The cost of site matters more in Europe, while staff expertise is more a concern in the US and in Japan. Imperfect institutional design (taxation, legal protection, business laws) is clearly considered as less sensitive. There are however noticeable exceptions. Institutional barriers are considered relatively more significant in France and Japan as well as in manufacturing industries in Denmark and Germany.
Table 10: e-Business barriers, by Nationality and Industry
France Japan United States Denmark Germany
% indicating it as a
significant obstacle a M RW BF M. RW BF M R&W BF M RW BF M RW BF
Privacy - security 43 23 49 68 55 66 45 44 62 28 19 32 27 25 48 Face-to-face 43 38 31 42 45 64 39 34 40 46 39 24 28 13 21 Organizational changes 29 21 19 44 52 32 29 26 32 17 11 18 34 33 15 Customers use 26 22 19 30 27 20 21 34 20 21 31 18 20 26 12 Business strategy 27 21 20 22 27 18 22 16 16 19 16 16 15 19 14 Staff expertise 8 15 25 33 36 29 24 22 18 5 11 5 23 18 11 Costs e-site 21 13 13 10 13 12 10 15 12 28 17 17 25 28 22 Access cost 18 10 17 37 38 40 19 21 20 6 6 5 3 2 6 Taxation 28 19 29 35 27 23 3 9 7 3 7 2 5 2 3 Legal protection 13 13 12 15 15 7 5 16 4 17 8 13 20 14 27 Business laws 14 3 9 22 19 15 4 9 10 11 14 7 16 3 19 Source: CRITO Global E-Commerce Survey 2002, own calculations, unweighted
M = Manufacturing, RW = Retail & Wholesale, BF = Banking – Finance
a Exact wording of question: Using a 5-point scale where 5 is ‘a very significant obstacle’ and 1 is ‘not an obstacle’, please rate how
significant the following obstacles are to your establishment’s ability to do business on-line.
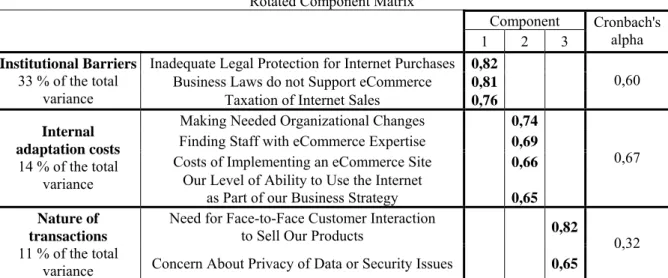
Principal component analysis confirms the existence of three categories of barriers (Table 11). The most discriminating dimension groups the institutional barriers. Assessments of barriers are also strongly discriminated by variables that refer to the costs borne by firms to implement e-commerce activities, including the cost of organizational changes. Lastly, the very nature of the relationships among economic agents matters. There are clearly firms that consider that some aspects of their interactions with their clients or partners cannot be performed on-line. It is interesting to note that the ranking of the various categories of barriers is strictly inversed when one considers their discrimination power or their relative importance for users. This simply means that there is a consensus among the users in identifying the most inhibiting barriers, while they do not share the same judgments on less important ones, either because they face different constraints (for instance contrasted national institutional frameworks), or because they do not have the same vision (for instance because some of them already overcame these barriers of lesser importance).
Table 11: The Most Discriminating e-Business Barriers
Rotated Component Matrix
Component
1 2 3
Cronbach's alpha Inadequate Legal Protection for Internet Purchases 0,82
Business Laws do not Support eCommerce 0,81 Institutional Barriers
33 % of the total
variance Taxation of Internet Sales 0,76
0,60 Making Needed Organizational Changes 0,74
Finding Staff with eCommerce Expertise 0,69
Costs of Implementing an eCommerce Site 0,66 Internal
adaptation costs
14 % of the total
variance Our Level of Ability to Use the Internet
as Part of our Business Strategy 0,65
0,67
Need for Face-to-Face Customer Interaction
to Sell Our Products 0,82
Nature of transactions
11 % of the total
variance Concern About Privacy of Data or Security Issues 0,65 0,32 Extraction Method: Principal Component Analysis.
Rotation Method: Varimax with Kaiser Normalization. Only absolute values superior to 0,4
58,5% of the total variance is explained
The last principal component -- the nature of the transaction -- is however weaker than the first two ones. The Cronbach’s alpha is low and the explained variance is also much lower than for the two first dimensions. This is probably because the two items that build this dimension do not perfectly fit together. We therefore build the clusters from the first two discriminating dimensions, only. Table 15 (appendix) contrasts three groups:
• One is made of firms that consider themselves to be facing strong institutional barriers.
• The second group is made of firms that insist on the costs of implementing e-business and e-commerce.
• The third cluster is made of firms that do not face strong barriers.
The analyzed distribution of these clusters by industries and by countries shows that different categories of firms that should objectively face the same barriers, either because they belong to the same industry (‘nature of the transaction’ barrier) or because they operate in the same country (institutional barriers) put forward contrasted barriers to the adoption and use of e-business technologies and methods. In an earlier paper, Brousseau & Chaves (2004) suggested that it may be the case that the perceived barriers to adoption evolve with degree of adoption and use (or maturity). Most advanced users do not see institutional barriers as major obstacles to the development of e-business, while less advanced users focus on such issues. Most advanced users have already solved the problems caused by inefficiencies in the institutional environment. For them, the costs of implementation and re-engineering are clearly the major barrier to the development of e-commerce. When these reorganization costs have been borne, the only remaining barrier is the impossibility to digitize some aspects of the business relationship, which can be considered as a ‘natural’ barrier to the unbounded expansion of e-business.
If our hypothesis was correct, it would reinforces the network effect inherent to e-business methods, whose productivity stems directly from their adoption by business partners. In an environment where the proportion of advanced users is higher, the propensity to adopt and to
increase the rate of use is higher, both because adoption and use are more profitable and because there are less perceived barriers.
To verify this we perform two cross tabulations. The first one is between the clusters established on barriers and those established on inhibitors (Figure 2), the second one is between the clusters established on barriers and adoption and use (Figure 3).
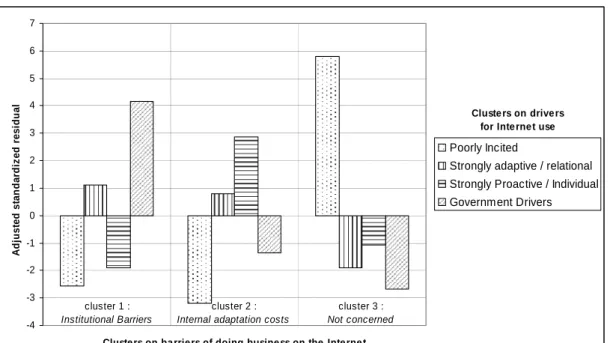
• Figure 2 shows that those firms for whom institutional barriers matter are active adopters, but mostly adaptive or with moderate incentives. Strongly proactive companies essentially consider the costs of implementation and re-engineering. Those who do not identify any barriers are also those who are poorly incited to adopt.
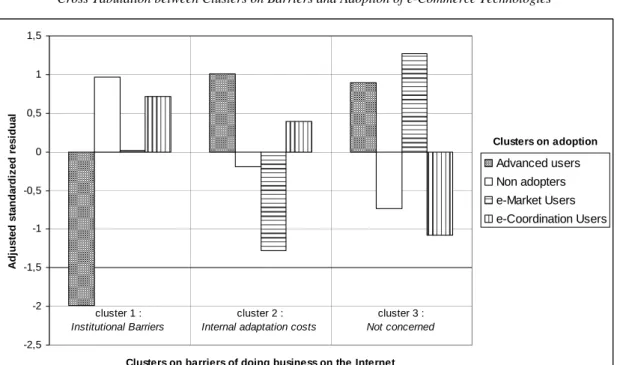
• Figure 3 establishes that those who consider internal adaptation costs as major barriers are the advanced users or those who automate coordination with partners (e-coordination users). Those who do not express concern about barriers are either advanced users or e-market users; who therefore overcame most barriers. Those who point out the existence of institutional barriers are either non-adopters or e-coordination users (which fits with the fact that they are partly driven by institutional factors).
Figure 2: The Relationship Between the Perception of Barriers and Drivers
Cross Tabulation between Clusters on Drivers and Barriers
-4 -3 -2 -1 0 1 2 3 4 5 6 7
Clusters on barriers of doing business on the Interne t
Ad ju s ted s tan d a rd iz ed r e si d u al Poorly Incited
Strongly adaptive / relational Strongly Proactive / Individual Government Drivers
cluster 1 :
Institutional Barriers
cluster 2 :
Internal adaptation costs
cluster 3 :
Not concerned
Cluste rs on drivers for Inte rnet use
Figure 3: The Relationship Between the Perception of Barriers and Adoption of e-Commerce Technologies
Cross Tabulation between Clusters on Barriers and Adoption of e-Commerce Technologies
-2,5 -2 -1,5 -1 -0,5 0 0,5 1 1,5
Clusters on barriers of doing business on the Internet
A d ju st ed s tan d a rd iz ed r esi d u al Advanced users Non adopters e-Market Users e-Coordination Users cluster 1 : Institutional Barriers cluster 2 :
Internal adaptation costs
cluster 3 :
Not concerned
Clusters on adoption
These various elements, combined with the cross-analysis of impacts and perception of barriers in the next section (see figure 5) converge to confirm that the perception of barriers is strongly related to maturity. Potential adopters overestimate the importance of institutional barriers, while adopters experienced that the essential barriers are the difficulty of implementation and the cost of re-engineering. Most intensive users either no longer identify barriers, or see barriers in the nature of their relationship with their partners and clients. In addition, we show that the style of adoption matters. E-market and e-coordination users do not focus on the same barriers.
5. Impact
The impact reported (Table 12) shows above all that intangible impact is higher than tangible impact. Most users assess that customers have benefited from improved service, that processes are more efficient, that staff productivity increased or that coordination is more efficient. Fewer proportions of users really identify measurable impact in term of sales and there is only a tiny minority that experienced cost reduction. It is worth noting that almost no companies benefited from increased sales abroad. E-Commerce is used to target the domestic market. At this stage of development, it is clearly not a significant driver of globalization.
Table 12: Impacts of Internet use, by Country and Industry
(% indicating it as a significant impact)
France Japan United States Denmark Germany
% indicating it as a significant impact a
M RW BF M RW BF M RW BF M RW BF M RW BF
Customer Service Improved 29 23 31 22 23 10 39 43 46 43 36 48 28 30 52 Internal Processes More Efficient 32 36 27 40 31 26 36 32 40 35 33 33 29 25 27 Coordination with Suppliers Improved 28 31 20 35 35 13 35 34 32 28 34 30 33 22 21 Our Competitive Position Improved 15 19 13 8 19 10 35 37 44 25 25 33 25 22 38 Staff Productivity Increased 19 19 14 29 20 17 28 35 33 21 21 20 16 18 15 Sales Area Widened 23 14 15 11 17 18 35 43 37 19 15 19 14 23 17 Sales Increased 6 12 3 7 6 13 24 32 22 18 11 25 8 18 19 Procurement Costs Decreased 9 2 7 17 6 3 20 14 17 18 28 13 9 18 6 Inventory Costs Decreased 8 2 8 7 6 5 7 17 14 11 9 6 7 7 12 International Sales Increased 13 8 4 11 0 0 13 10 7 12 7 4 13 12 3
Source: CRITO Global E-Commerce Survey 2002, own calculations, unweighted M = Manufacturing, RW = Retail & Wholesale, BF = Banking – Finance
a Exact wording of question: Using a 5-point scale where 5 is ‘a great deal’ and 1 is ‘not at all’, please rate the degree to which your
establishment has experienced the following impacts since it began using the Internet for business. A score of 4 or 5 was classified as ‘a
significant impact’.
The principal component analysis (Table 13) brings clear results (high percentage of variance explained, high Cronbach’s alpha). As for the barriers, the most discriminating factors are not those which are reported the most often by respondents to the questionnaire. Intangible impact is frequently reported but does not really differentiate firms. Significant differences are found on the ability to increase sales (45% of the variance) and to reduce costs (13%) thanks to the use of e-commerce. It has to be pointed out that the enhancement a firm’s competitive position is linked to the ability to expand the firm’s sales, rather than on the ability to reduce costs.
Table 13: The Most Discriminating Impacts
Component
1 2
Cronbach's alpha
Sales Area Widened 0,84
Sales Increased 0,79
Our Competitive Position Improved 0,72
Customer Service Improved 0,65 Increase Sales
45 % of the total variance
International Sales Increased 0,56
0,81
Procurement Costs Decreased 0,80
Coordination with Suppliers Improved 0,77
Inventory Costs Decreased 0,71
Internal Processes More Efficient 0,69 Reduce Costs
13 % of the total variance
Staff Productivity Increased 0,61
0,81
Extraction Method: Principal Component Analysis. Rotation Method: Varimax with Kaiser Normalization. Only absolute values superior to 0,4
58% of the total variance is explained
By following the same methodology as above, it is easy to build a typology on the basis of this PCA. It leads to the identification of three clusters (Table 16 in the appendix)
• The first one groups firms that do not report any tangible impact.
• The second one gathers firms that essentially benefit from cost reduction. • The third one is made of firms in which sales increased.
The distribution of these three patterns of impact across countries and industries shows that both the nationality and even the industry are not sufficient to explain impact. We thus cross the analysis of impact with the one on adoption. By comparing the use of e-commerce technologies with the reported impact (Figure 5), it is easy to see that the contrasted pattern of impact relates well with the various patterns of adoption:
• The firms that do not report important impact are non adopters.
• The firms that report cost reduction are either advanced users or e-coordination users. • The firms that report increased sales are above all the advanced users and the e-market
users as well.
It is interesting to note that those who really succeed in increasing sales are the advanced users. Simple e-market users less often report growth of their sales. This suggests that success in selling on-line is partly linked to the ability to reorganize its relationships with its partners and to reengineer its processes. This is confirmed by the analysis the relationship between barriers and impacts. Those whose sales increase identify re-engineering costs as essential barriers.
Figure 4: The Relationship Between Impacts and Adoption
Cross Tabulation between Clusters on Impacts and Adoption of e-Commerce Technologies
-8 -6 -4 -2 0 2 4 6 8 10
Clusters on im pacts of doing business on the Internet
Ad ju s ted s tan d a rd iz ed r e si d u al Advanced users Non adopters e-Market Users e-Coordination Users cluster 2 : enhanced procurement cluster 1 : no significant impact cluster 3 : increased sales Clusters on adoption
Figure 5: The Relationship Between Impacts and Barriers
Cross Tabulation between Clusters on Impacts and Barriers of e-Commerce Technologies
-4 -3 -2 -1 0 1 2 3 4
Cluste rs on impacts of doing busine ss on the Inte rne t
A d ju st ed st an d a rd iz ed r e s id u a l Institutional Barriers Internal adaptation costs Not concerned cluster 1 : no significant impact cluster 2 : enhanced procurement cluster 3 : increased sale Cluste rs on ba rrie rs for Inte rne t use
Concluding Remarks
Data analyses performed on our sample seem to confirm the idea that there are contrasted patterns of adoption or e-business technologies; patterns that can be related to contrasted impact. These patterns of adoption and impact are partly explained by the objective opportunities/constraint faced by firms given their business and institutional environment. They are however also explained by path dependency phenomena. Since e-business technologies and uses are relational, their productivity depends upon adoption by potential business partners (and by consumers). There are therefore strong network externalities as well an increasing return from adoption, which do play at the level of business networks. These effects are reinforced in dynamics by the strong learning effects. By using the technology and the business methods linked to e-business, firms learn to overcome barriers. However this does not mean that they are all converging toward the same pattern of adoption.
There are clearly two contrasted strategies
• The first is to adopt e-coordination technologies and methods to enhance coordination with business partners. Uses are oriented toward the management of coordination once a deal has been agreed (the ex-post aspect of the transaction). Such strategies are preferred in these industries and institutional environments where long term (co-operative) relationships are favored. Such strategies are aimed at saving costs. The search for clients, suppliers or partners and the negotiation of contracts continue to be performed off-line because it allows solving the many transactional problems inherent to the provision of complex goods and services, whose quality is difficult to assess and which have to be customized.
• The second is to adopt e-market technologies to buy and sell on-line, the latter operation being the actual bottleneck since it clearly requires re-engineering the organization. Uses are oriented toward the matching of demand and supply and agreement of deals (the ex-ante aspect of the transaction). Such a strategy is aimed at increasing sales, but does not systematically increase them substantially. In fact to be really successful the path of
adoption requires re-engineering, and if possible adoption of automated methods to manage the ex-post part of the transaction. The logical continuation of this path of adoption is therefore to adopt technologies aimed at automating coordination with business partners (so as to become an advanced user).
There are however barriers that can prevent the completion of both paths of adoption. Both strategies are submitted to strong constraints at the individual level. Using e-business technologies to automate the management of the ex-post part of the transaction with business partners requires the adoption of compatible technologies and methods by them. Selling on-line depends essentially on the fact that clients are buying on-on-line. Contrasts across countries and industries therefore not only depend upon general and static factors, in particular institutional characteristics. The pre-existing organization of the industry and the dynamic of adoption of various type of technologies may engage business networks on contrasted self-reinforcing paths of adoption that do not necessarily converge toward a generalized use of ICTs in which most pre-sale and post-sale operations would be managed on-line.
References
Arthur, W. B. (1989), ‘Competing technologies, increasing returns, and lock-in by historical events’, Economic Journal, 99, 116-131.
Bjorn-Andersen N., Viborg Andersen K., (2004) ‘Diffusion and Impacts of the Internet and E-Commerce: The Case of Denmark’, Report for the Center for Research on Information Technology and Organizations (CRITO), University of California at Irvine, and the U.S. National Science Foundation (CISE/IIS/CSS), Globalization and E-Commerce Project. Available from: http://crito.uci.edu/pubs/2004/DenmarkGECIII.pdf [Accessed 21st May 2005].
Brousseau, E., Chaves, B., (2004) ‘Diffusion and Impact of E-Commerce: The French Specific Path’, Report for the Center for Research on Information Technology and Organizations (CRITO), University of California at Irvine, and the U.S. National Science Foundation (CISE/IIS/CSS), Globalization and E-Commerce Project. Available from: http://crito.uci.edu/pubs/2004/franceGECIII.pdf [Accessed 21st May 2005].
Brousseau, E. (2003) ‘E-Commerce in France: Did Early Adoption Prevent Its Development?’ Information Society, 19(1), 45-57.
Brousseau, E., Kraemer, K. L. (2003) ‘Globalization and e-commerce: the French environment and policy’, Communications of the Association for Information Systems, 10, 73-127.
Brousseau, E. (2000). Commerce électronique: Ce que disent les chiffres et ce qu'il faudrait savoir. Economie et Statistiques. 339-340 (2000-9/10):147–170 (English translation at
http://www.insee.fr).
Brousseau E., Rallet A. (eds.), (1999), Technologies de l’Information, Organisation et
Performances Economiques. Commissariat Général du Plan, Paris.
Brousseau E., Rallet A. , (1998), ‘Beyond Technological or Organizational Determinism: A Framework to Understand the Link Between Information Technologies and Organizational Changes’, in S. MacDonald, G. Madden (eds), Telecommunications and
Socio-economic Development, North Holland, Elsevier Science, 1998, pp. 245-262
Caselli, F., and Coleman, II, W. J., (2001) ‘Cross-country technology diffusion: The case of computers’, The American Economic Review, 91(2), 328-335
David, P. A. (1985), ‘Clio and the economics of QWERTY’, American Economic Review, 75, 332-337.
Farrell, J., Saloner, G. (1986), ‘Installed Base and Compatibility: Innovation, Product Preannouncements, and Predation’, American Economic Review, 76(5), 940-955.
Gibbs J. and Kraemer K. L. (2004) ‘A Cross-Country Investigation of the Determinants of Scope of E-commerce Use: An Institutional Approach’, Electronic Markets, 14(2), p124-137.
Gibbs, J., Kraemer, K. L. and Dedrick J., (2003) ‘Environment and policy factors shaping global e-commerce diffusion: a cross-country comparison’, The Information Society, 16(1), 5-18.
Haberman, S. J. (1978), Analysis of qualitative data: Vol 1 Introductory topics, New York: Academic Press.
Jolliffe, I., (2002), Principal Component Analysis, 2nd edition, Springer series in Statistics, Springer Verlag.
Katz, M. L., C. Shapiro (1985), ‘Network externalities, competition, and compatibility’,
American Economic Review, 75(3), 424-440.
Koenig W., Wigand R. T., Beck R. (2004) ‘Globalization and E-Commerce: Diffusion and Impacts of the Internet and E-Commerce in Germany’. Report for the Center for Research on Information Technology and Organizations (CRITO), University of California at Irvine, and the U.S. National Science Foundation (CISE/IIS/CSS), Globalization and E-Commerce Project. Available from: http://crito.uci.edu/pubs/2004/GermanyGECIII.pdf [Accessed 21st May 2005].
Kraemer, K.L. Dedrick, J. (2005), ‘Globalization, the Internet and E-Business: Convergence Or Divergence In Cross-Country Trends’, in Brousseau E. and N. Curien (eds), Internet
Economics, Digital Economics, Cambridge University Press, forthcoming.
Kraemer K.L., Dedrick J., Dunkle D., (2002), ‘E-Commerce in the United States: Leader or
One of the Pack?’, Report for the Center for Research on Information Technology and
Organizations (CRITO), University of California at Irvine, and the U.S. National Science Foundation (CISE/IIS/CSS), Globalization and E-Commerce Project. Available from: http://www.crito.uci.edu/publications/pdf/GIT/GEC/USsnapshot.pdf [Accessed 21st May 2005].
Lebart, L., Morineau, M., Piron M., (2000), Statistique exploratoire multidimensionnelle. 3rd edition. Paris, Dunod.
Liebowitz, S. J., S.E. Margolis (1995), ‘Path Dependence, Lock-in and History’, Journal of
Law, Economics & Organization, 11(1), 205-226.
Liebowitz, S. J., Margolis, S. E. (1994), ‘Network Externality: An Uncommon Tragedy’,
Journal of Economic Perspectives, Spring, 133-150.
North, D.C. (1990), Institutions, Institutional Change and Economic Performance, Cambridge. Cambridge University Press.
OECD, 2004, OECD Information Technology Outlook 2004, Directorate for Science,
Technology and Industry. Paris, France
Shapiro, C., Varian H., (1999) Information Rules: A Strategic Guide to the Network Economy. Harvard Business School Press, Boston, MA.
Shih, C.-F.; Dedrick, J., Kraemer K.L., (2005), ‘Rule of Law and the International Diffusion of E-Commerce’, Communications of the ACM (accepted).
Tachiki, D., Hamaya, S., Yukawa, K. (2004) ‘Diffusion and impacts of the Internet and e-commerce in Japan’. Report for the Center for Research on Information Technology and Organizations (CRITO), University of California at Irvine, and the U.S. National Science Foundation (CISE/IIS/CSS), Globalization and E-Commerce Project. Available from: http://crito.uci.edu/pubs/2004/GEC3Japan.pdf [Accessed 21st May 2005].
Williamson, O. E., (1985), The Economic Institutions of Capitalism. New York: Free Press. Zhu, K., Kraemer, K. L. and Xu., S. (2003) ‘E-business adoption by European firms: A
cross-country assessment of the facilitators and inhibitors,’ European Journal of Information
Systems, 12(4), 251-268.
Apendix
Table 14 : Four Patterns of Motivations
Cluster Final Cluster Centers
1 2 3 4 Factor 1 : Proactive / Individual Drivers -0,89 -0,45 0,97 0,11 Factor 2 : Adaptive / Relational Drivers -0,97 0,95 -0,26 0,15 Factor 3 : Government Drivers -0,22 -0,36 -0,37 1,97 Number of observations
(N = 1130, 131 missing) 226 300 330 143
Table 15 : Three Categories of Identified Barriers
Cluster Final Cluster Centers
1 2 3 Factor 1 : Institutional 1,18 -0,35 -0,68 Factor 2 : Internal adaptation costs -0,16 0,91 -0,85 Number of observations
(N = 1130, 283 missing) 254 309 284
Table 16 : Contrasted Pattern of Impacts
Cluster Final Cluster Centers
1 2 3 Factor 1 : Increased Sales -0,71 -0,28 1,17 Factor 2 : Reduced Costs -0,76 1,03 -0,18 Number of observations