This is an Accepted Manuscript of an article published by Taylor & Francis in Population Studies on 3 August 2018, available online:
http://www.tandfonline.com/10.1080/00324728.2018.1490450
Please cite as :
Gauvreau, Danielle, Sabourin, Patrick, Vézina, Samuel & Laplante, Benoît. 2018. "The mechanics of the baby boom: Unveiling the role of the epidemiologic transition". Population Studies [Advanced online publication]. doi: 10.1080/00324728.2018.1490450.
1
The mechanics of the baby boom:
Unveiling the role of the epidemiologic transition
Danielle Gauvreau1, Patrick Sabourin2, Samuel Vézina2 and Benoît Laplante2
1
Concordia University, 2Institut national de la recherche scientifique
Abstract
Recent research on the baby boom and its causes has shown that common explanations, such as the recuperation of births following the Great Depression or Second World War, are not sufficient to account for the phenomenon. However, that research has stressed the role of increasing nuptiality. In this paper, we argue that the increase in survivorship of children and young people that resulted from the epidemiologic transition accounted for a large portion of the increased number of births during the baby boom. We use a microsimulation model to assess the respective roles of mortality, nuptiality, fertility, and immigration on the size and dynamics of the boom in Quebec, Canada. Results show that decreasing mortality contributed significantly to the baby boom, along with immigration and nuptiality changes, while fertility rates attenuated the phenomenon. These results substantiate the hypothesis that the epidemiologic transition was an important cause of the baby boom.
Keywords: baby boom; epidemiologic transition; microsimulation; Quebec–Canada; retrospective projection
2 Introduction
The baby boom was the unexpected increase in the number of births that took place in many developed countries between the mid- to late 1930s and either the late 1960s or early 1970s. It was probably the most surprising demographic phenomenon to have occurred in these countries during the twentieth century. Its long-lasting consequences are still apparent today as baby boomers reach retirement age, giving an even more acute edge to population ageing. Yet, as Van Bavel and Reher (2013) point out, there are many aspects of the baby boom that we still do not fully understand. The evidence they review concerning its timing in different countries shows that ‘the baby boom cannot be understood solely as a post-war phenomenon’ (2013, p. 279). Similarly, the idea of a recuperation of births following the Great Depression can serve only as a partial explanation for it. The two authors stress that the central role of marriage in the unfolding of the baby boom has not yet received all the attention it deserves. It is also clear from their analysis of a variety of countries that, although there are features common to all baby booms, each boom is distinct in its ‘timing, magnitude, and volume’ (2013, p. 279). Undoubtedly, further fine-grained work is required to shed light on this major demographic shift.
Since the publication of Van Bavel and Reher’s seminal paper, researchers in many countries have tackled some of the issues highlighted by the two authors (Duvoisin and Oris 2013; Requena and Salazar 2014; Sandström 2014; Van Bavel 2014; Gauvreau and Laplante 2016a, 2016b). Using micro-level data from various sources—censuses, population registers, and surveys—these authors have shown that fertility differentials according to women’s educational levels narrowed significantly during the baby boom. This came mainly as a result of the decrease in celibacy, especially among well-educated women, at a time when educational achievement was on the rise everywhere. Work on Sweden (Sandström 2014 and 2017), Belgium (Van Bavel
3
2014), and Canada (Kempeneers and Van Pevenage 2015; Gauvreau and Laplante 2016b) has also emphasized the significant reconfiguration of reproductive labour during the baby boom that resulted in much larger proportions of women marrying and giving birth. These findings point to the driving force of transformations in marriage patterns during the boom, with fertility changes playing a more heterogeneous role, dependent on the levels observed before the onset of the boom, as suggested by Van Bavel and Reher (2013). In order to better understand the causes of the baby boom, it is thus crucial to analyse the impacts of transformations in marriage and of changes in marital and non-marital fertility separately.
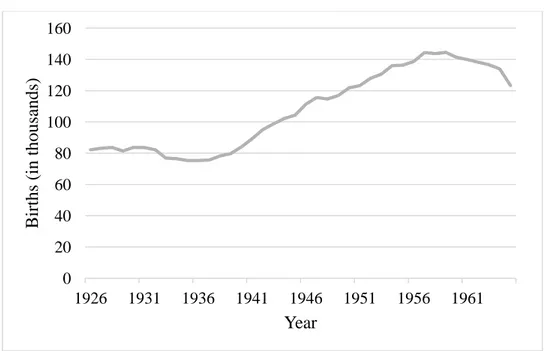
The Canadian case can be used to illustrate the importance of this statement. According to Van Bavel and Reher’s index of the volume of the baby boom, Canada occupies the top of the list of countries with the largest baby booms along with countries like the United States (US), Australia, and New Zealand (2013, p. 265). But when we look at specific Canadian provinces, a more contrasting picture emerges. Figure 1 reproduces the trend in the crude birth rate in Canada used by these two authors to determine the surplus of births during the baby boom, and thus the magnitude of the baby boom. It also provides comparable information for Quebec and Ontario, the two Canadian provinces with the largest populations in 1941: 3.3 and 3.8 million inhabitants, respectively, together accounting for 62 per cent of the Canadian population in that year (Statistics Canada 1999). It shows that although the timings of the baby booms were the same in both provinces, their magnitudes differed: it was higher in Ontario, which displayed much lower birth rates than Quebec at the onset of the boom. The Canadian trend thus appears to be an average of diverse provincial trends.
4
The difference between Quebec and Ontario can largely be attributed to the cultural diversity of the Canadian population, especially as concerns its ethno-religious attributes. Cultural diversity in Canada follows clear geographical patterns, a legacy of the successive French and British regimes that governed the first centuries of European colonization in North America. The majority of the population living in Quebec at the onset of the baby boom were Catholics of French descent (over 80 per cent), while the majority in the rest of Canada were British Protestant (over 60 per cent). During the baby boom women in both groups experienced significant increases in their probabilities of getting married and of doing so at a young age (Gauvreau et al. 2015), but marital fertility trends in the two groups diverged significantly (Henripin 1968; Lapierre-Adamcyk and Lussier 2003; Gauvreau and Laplante 2016b). As would be expected during the baby boom, marital fertility rates increased among British Protestant women, whose fertility had dropped close to replacement level before the baby boom. However, marital fertility decreased among French-Catholic women whose fertility transition was not yet complete at the onset of the boom (Gauvreau and Laplante 2016b and Figure 6 in our paper). This rather counter-intuitive finding, which seems inconsistent with increasing crude birth rates (seen in Figure 1 for Quebec) and a much larger number of births than seen in previous years (Figure 2), raises a simple but very important question that is at the core of this paper: were the transformations in marriage patterns, however real and significant, sufficient to account for the large increase in the number of births that occurred during the baby boom in Quebec, considering that these married people were to have, on average, fewer children than their own parents?
[Figure 2]
Other factors may have prompted the increase in the number of births (Figure 2): significant changes in non-marital fertility rates could be one; an unexpected increase in the number of
5
women of reproductive age (15–49) during the baby boom could be another. The first factor has to be ruled out since the proportion of births that were non-marital remained pretty low during the baby boom, at below 5 per cent of all births in Quebec (Henripin 1968, p. 60). The second factor, an increase in the number of women, could have resulted from increased survival rates or a sudden influx of women due to immigration. At first glance, the most appealing explanation is that the number of young women of reproductive age increased significantly due to decreasing mortality. In other words, the epidemiologic transition could have led to significant increases in the size of cohorts of young women of reproductive age, who were to become the mothers of the baby boomers. Immigration could also have played a role, as it rose in Canada after the Second World War, but the overall impact of immigration trends during the first half of the twentieth century is difficult to assess without a closer examination.
This paper is an attempt at substantiating the explanations above by modelling the mechanics of the baby boom as a way to ascertain the respective contributions of mortality, nuptiality, fertility, and immigration to the increase in the total number of births in Quebec during the baby boom. In the first section of the paper, we look at the epidemiologic transition and especially how it relates to decreasing mortality rates and increased survivorship of children and young women, both theoretically and in the specific context of Quebec. In the second section we introduce the microsimulation approach used to model the mechanics of the baby boom and use ‘what if’ scenarios to ascertain the respective contributions of mortality, nuptiality, fertility, and immigration to the increase in the total number of births. We present these results in the third section, before discussing their broader scope in the conclusion.
This demonstration is framed within the context of Quebec because it is the peculiar nature of the baby boom in this province (increasing births despite falling marital fertility) that prompted
6
the formulation of the research question at the core of this paper. The novel approach proposed here was indeed less likely to emerge from more typical baby boom patterns where the impact of marital fertility changes was consistent with the increase in the number of births. Additionally, the microsimulation approach used in this paper is very data intensive and could not readily be applied to other regions of the world. However, as the effect of the epidemiologic transition on the size of the cohorts of women is ‘mechanical’, results similar to our own are likely to be found in other countries where a baby boom occurred during the twentieth century.
The epidemiologic transition
The epidemiologic transition and population growth
The epidemiologic transition theory (Omran 1971, 2005) links decreasing fertility to decreasing mortality by focusing on the details of the changes in mortality. It rests on a series of propositions, of which the most relevant for our purposes is that the most profound changes in health and disease patterns during the epidemiologic transition affect children, especially children aged one to four years, and women in the adolescent and reproductive age groups. This implies that the number of children of a given cohort surviving up to their fifth birthday will increase and, among the survivors, the number of young women of reproductive age will increase as well. Omran suggested that, assuming completed fertility to be constant (i.e., nothing more than a lag in the adjustment of fertility to the new lower mortality rates he was trying to model), lower mortality rates among children and young women would lead arithmetically to larger cohorts of women of reproductive age, and thus to higher numbers of births and larger new birth cohorts. Omran thought of this increase as temporary, as he assumed that fertility patterns would eventually adjust and lead to lower fertility. He was not interested in the baby boom and
7
apparently did not see that his suggestion was actually of utmost importance in understanding the mechanics of the baby boom.
Public health and the epidemiologic transition in Quebec
In Omran’s view, the epidemiologic transition is not a ‘natural’ process. It occurs as a consequence of socioeconomic, political, and cultural factors (such as standards of living, health behaviours, hygiene, and nutrition) and of medical and public health factors (such as preventive and curative measures used to combat disease, including improved public sanitation, immunization, and the development of decisive therapies). One might argue that changes in health behaviours, hygiene, and nutrition may be the consequence of the development of public health or reach the people through the same channels as the elements that can be classified among the public health factors. Whatever the theoretical argument, these factors led to the epidemiologic transition unfolding in Quebec in the early twentieth century.
Following the implementation of the vital statistics system in 1926, data showed that during the five-year period from 1926 to 1930, average infant mortality was 127.1 per 1,000 in Quebec and much higher in its most populous city, Montreal. Only about 80 per cent of newborns in Quebec were reaching the age of 15, when they could envisage forming their own family. Maternal mortality was high too, with a rate of 5.2 maternal deaths per 1,000 live births on average between 1926 and 1930 (Bourbeau and Smuga 2003; Baillargeon 2004, pp. 34–35 and p. 60).
The new statistical knowledge helped to promote changes in health behaviours, hygiene, nutrition, public sanitation, and immunization, while other measures like adding chlorine to the water and pasteurizing milk had already been implemented shortly beforehand. The mobilization
8
against infant and child mortality proved successful. By 1936–40, infant mortality in Quebec had dropped to 82.7 per 1,000 and nearly halved to 44.2 per 1,000 by 1946–50. The proportion surviving to age 15 had increased to 90 per cent by 1940 and continued its upward trend. Maternal mortality in Quebec was still at 4.5 per 1,000 live births in 1940, but the introduction of blood transfusions and the discovery of antibiotics soon contributed to its significant drop to a low of 0.6 per 1,000 live births in 1960 (Gauvreau 1993; Baillargeon 2004, pp. 34–35 and p. 60). Overall, newborns, children aged one to fifteen, and women of reproductive age were the groups whose mortality rates decreased the most during this period in Quebec, as elsewhere (Bourbeau and Smuga 2003).
Infant and child mortality both probably started to decrease before the implementation of the vital statistics system and the impulse it gave to the fight for the survival of newborns and young people. These mortality rates kept decreasing throughout the twentieth century. The increase in survivorship accomplished by the end of the 1940s was such that it increased the number of potential mothers throughout the years of the baby boom, as can be seen in the narrowing gap between the number of female births and the number of these women surviving to age 30 (Figure 3). Thus, the first stage of the epidemiologic transition provided one important contributing factor to the baby boom as it happened in Quebec, and probably elsewhere.
[Figure 3]
Microsimulation of the mechanics of the baby boom The general framework
Our approach is based on the simple but fundamental idea that the number of births occurring during a baby boom can be modelled as an outcome of the evolution of four underlying
9
demographic components. Formally, the number of births is the product of fertility rates and the size of the population at risk of giving birth—women aged 15 to 49 during the boom—by marital status. While marital (or non-marital) fertility itself cannot be broken down into other demographic factors, the size and age structure of the population at risk (the cohorts of women who became the mothers of the baby boomers) can be. The population at risk is shaped by four demographic factors: the sizes of the birth cohorts of women at risk of having children during the baby boom and the levels of mortality, nuptiality, and migration they experienced. In theory, the sizes of the birth cohorts of these women could themselves in turn be further decomposed into the same demographic elements (marital fertility rates, nuptiality, etc.) but this would require complete biographical data on the cohorts of the baby boomers’ grandmothers. Such extension of the analysis further into the past was not possible due to the lack of adequate data, and thus the size of the birth cohorts of the women who became the mothers of the baby boomers are dealt with as ‘givens’ in our model. As our main motivation is to ascertain the contribution of the mortality rates that affected these birth cohorts, dealing with their size as a given is of no consequence.
This decomposition approach allows us to develop a microsimulation model whose main objective is to replicate the demographic biographies of women residing in Quebec and at risk of giving birth to a child during the baby boom, with a focus on their fertility outcomes. Using this model and alternative scenarios, it is possible to assess the impacts of mortality, nuptiality, fertility, and immigration on the total number of births observed during the baby boom. Appendix A provides a brief overview of the microsimulation model.
10 The model
The model was developed to simulate the demographic biographies of women born between 1896 and 1949 who were residing in Quebec during the baby boom. In Canada, the number of births started to increase at the beginning of the Second World War and receded to lower levels in the middle of the 1960s. Thus, one could argue that in Canada, the baby boom truly started around 1940. Women of reproductive age during the baby boom would therefore have been born between approximately 1890 and 1950. Unfortunately, estimates based on vital statistics and census data are only available for cohorts born from 1901 onwards. To minimize the use of extrapolated parameters, we decided to fix the beginning of the baby boom in the most usual fashion: in our model, the baby boom occurs over the period stretching from 1945 to 1964.
The model simulates the demographic events—marriage, births, migration, and death—that make up the biographies of women born between 1896 and 1949 until the end of the baby boom or until their death if sooner. Births are counted only during the baby boom period (1945–64). The sizes of the birth cohorts of women born between 1896 and 1949 are taken from vital statistics (Institut de la statistique du Québec 2018) and are shown in Figure 3. Women born between 1945 and 1949 were baby boomers themselves although they may also have had children during the baby boom: their own births are counted as births occurring during the baby boom, as well as the births of their children born before 1965. The increasing proportion of women surviving across cohorts (Figure 3) illustrates the importance of mortality in shaping the age structure of the population of women who will be the baby boomers’ mothers.
The model is organized using four different demographic modules—mortality, nuptiality, fertility, and migration—each of which is fully described next.
11 Mortality
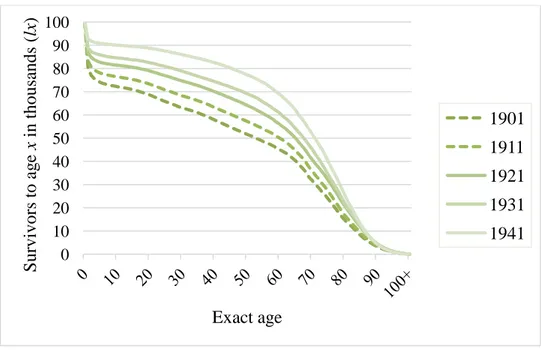
We took the cross-sectional age-specific mortality rates for 1921–64 from the Canadian Human Mortality Database (2014). Age-specific mortality rates for 1896–1920 were extrapolated backward from the 1921–40 period using linear regressions on log rates. The corresponding survival curves (lx) for 1901, 1911, 1921, 1931, and 1941 are shown in Figure 4.
[Figure 4]
The first decades of the twentieth century were characterized by a significant drop in mortality, particularly at young ages. The probability of survival to age one increased from 0.802 in 1901 to 0.926 in 1941. Youth and adult mortality also decreased significantly: the probability of a 15-year-old woman surviving during her entire reproductive period—from 15th to 50th birthday, measured on a period basisincreased from 0.729 in 1901 to 0.863 in 1941 and reached 0.948 in 1961. The extrapolated mortality rates for the first two decades of the twentieth century are consistent, especially for young people, with mortality rates derived from vital statistics when these were first systematically collected in 1926 (Bureau de la statistique du Québec 1976a).
Nuptiality
Marital status takes one of two different values: single or married. Women are born single and once married cannot go back to single. Divorce was almost non-existent in Quebec until the enactment of the Divorce Act of 1968 (Péron 2003) and is not allowed in the model. Since the model only projects the complete life histories of women born between 1896 and 1949, deaths of husbands are not modelled and widowhood is not taken into account. Census data show that the proportions of widows were rather small, especially in age groups where fertility rates were at their maximum (less than 2 per cent of women aged 25–29 in 1941 were widowed; Dominion Bureau of Statistics 1946, Table 7) and these proportions tended to decrease as adult mortality
12
continued its downward trend during the period. Moreover, the depleting effect of widowhood on women’s fertility is implicitly taken into account in the age-specific fertility rates by year and is unlikely to have affected the results significantly.
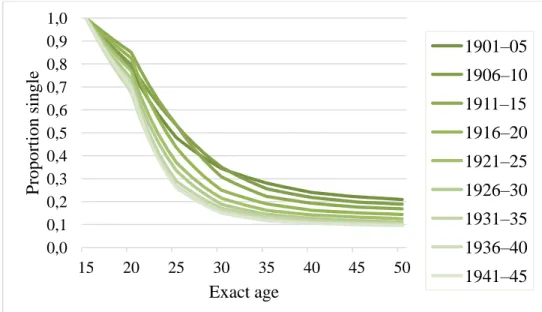
We took the cohorts’ age-specific nuptiality rates from Gauvreau and Laplante (2016a). These rates were estimated using the Kaplan–Meier estimator of the survivor function from the answers to the question about age at first marriage that was asked of all ever-married people in the 1981 Census. The survival curves for women remaining in the single state are shown in Figure 5.
[Figure 5]
As can be inferred from the graph, nuptiality rates increased significantly during the first half of the twentieth century. Forty-eight per cent of women born between 1901 and 1905 were still single at age 25, compared with 26 per cent of those born in 1941–45. Proportions never married at age 50 also went down from 21 per cent of women born in 1901–05 to below 10 per cent for women born during the Second World War. Women born between 1896 and 1900 are assumed to follow the same nuptiality pattern as women born in 1901–05.
Fertility
We took the cross-sectional age-specific fertility rates from 1945 to 1964 from the Quebec vital statistics (Bureau de la statistique du Québec, 1976b). Fertility rates by matrimonial status were further derived by assuming that 97 per cent of births occurred within wedlock, a reasonable assumption derived from statistics provided by Henripin (1968). Using marital fertility rates rather than overall fertility rates allowed for the separate modulation of fertility and nuptiality in scenario building. As shown in Figure 6, fertility rates tended to decrease for married women
13
between 1945 and 1964. It is well known that the fertility transition within Quebec was delayed, especially among the majority French-Catholic women, which is consistent with such a pattern (Gauvreau and Laplante, 2016b).
[Figure 6]
Migration
There are no reliable age-specific data for net international migration for the 1896–1964 period. We do know that after about two decades of low immigration due to the Great Depression and Second World War, Canada received large numbers of immigrants from 1947 to well into the 1960s, with at least one-fifth of these immigrants landing in Quebec (McInnis 2000; Piché 2003). These immigrants increased the size of the population from the time of their arrival onwards and also increased the number of births in the following years. Emigration is generally low in Canada and this is even more the case for Quebec, which represents a cultural enclave within the North American continent. One notable exception occurred during the first decades of the twentieth century when thousands of Quebecers emigrated to the US (Ramirez 2001). We took care of this using the adjustment described next.
In order to generate emigration rates and immigration headcounts, we compared the size of the simulated cohorts with the size of the observed cohorts of females during the baby boom using the estimates of the population by age group and sex published by Statistics Canada (2016b). The sizes of the cohorts of potential mothers during the years of the baby boom— generated by the model from the sizes of the birth cohorts of women born in Quebec before 1945 and the mortality module—were larger than the corresponding observed cohorts of women.
14
However, as the simulation moved further towards the end of the period of the baby boom, the sizes of the simulated cohorts were smaller than the observed numbers.
In theory, this gap represents the contribution of net migration to the size of the cohorts of women of reproductive age during the baby boom. In fact, the gap is consistent with net migration figures available for Quebec during this period, which suggest a negative migratory balance up until 1930, switching to a positive migratory balance by the end of the 1940s (Bureau de la statistique du Québec, 1976c; Desrosiers et al., 1978). As is often the case, young adults were particularly affected by these trends. We thus calibrated the emigration rates and immigration headcounts so as to maximize the match between the sizes of observed and simulated cohorts.
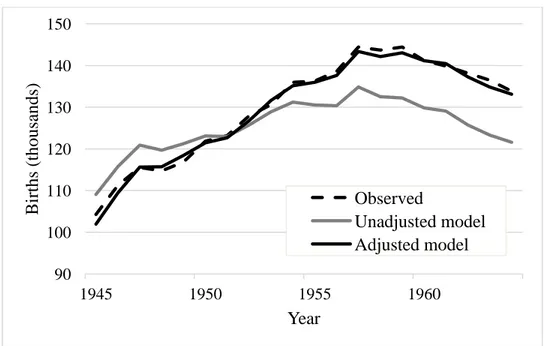
The lack of appropriate data forced us to deal with migration as if it were a residual. Thus, our handling of migration assumes that all other demographic factors are ‘accurate’. In other words, in our model, emigration rates and immigration numbers account for migration, but also correct any error attributable to the data and parameters used elsewhere in the model. Nevertheless, as can be seen in Figure 7, the numbers of births each year, generated from the size of the birth cohort of women and the mortality, nuptiality, and fertility modules, are close to the observed data. Without the adjustment for migration, the model appears to be missing mainly the contribution of post-war immigration, a significant component of population growth in Canada. In other words, the model without the migration module simulates what the baby boom would have been like, had there been no migration, and our migration module, despite the lack of appropriate data, adds to the model what can rightfully be attributed to post-war migration.
15 Results
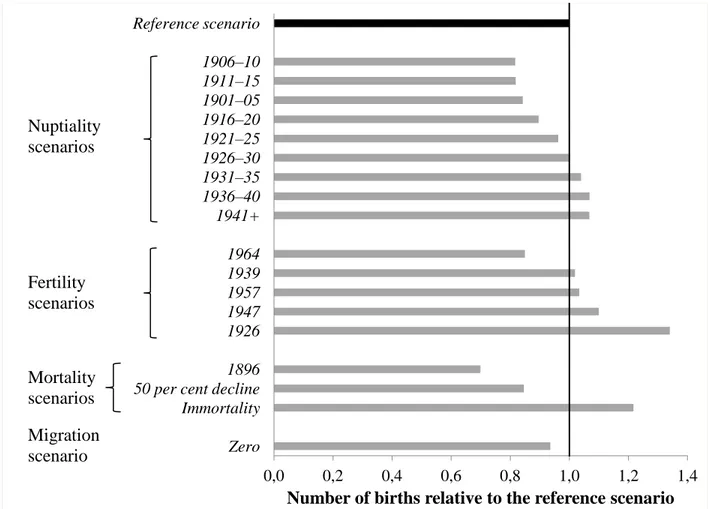
In order to understand the mechanics of the baby boom better, we generated two types of analyses. First, we built and simulated various scenarios whose outcomes are compared with those of the reference scenario, which is based entirely on observed data and represented by the adjusted model in Figure 7. Results for these scenarios are presented in Figure 8. Second, we present our analysis of the contribution of each demographic component to the volume and dynamics of the baby boom.
Scenarios
Mortality scenarios. We focused on three mortality scenarios: 1896, 50 per cent improvement, and immortality. The first of these scenarios ‘freezes’ age-specific mortality rates at their 1896 values. The second scenario, 50 per cent improvement, assumes that the probability of survival to a given age is situated halfway between the 1896 level and that of the reference scenario. Both scenarios measure the impact of the important decrease in mortality rates experienced during the first decades of the twentieth century, with the size of each simulated cohort of women varying according to the mortality rates of the scenario. Finally, the immortality scenario estimates the outcome of the baby boom assuming that mortality rates are zero; this can be seen as a theoretical limit to the increase in the number of births attributable to that component.
As can be seen in Figure 8, results show that the impact of mortality on the total number of births observed during the baby boom is truly remarkable. Between 1896 and the boom (reference scenario), more than half the road to the theoretical maximum number of births (immortality scenario) had been travelled with respect to the role of mortality. Had mortality rates remained at their 1896 levels, the total number of births occurring between 1945 and 1964 would
16
have been 30 per cent lower. This difference is large, and large enough to ask whether anyone would have noticed a baby boom if the average annual number of births during that period had been about 90,550 ((0.7 x 2,587,159) / 20) rather than the actual 129,358 (2,587,159 / 20). As expected, the 50 per cent improvement scenario yields results in between those of the 1896 and immortality scenarios.
[Figure 8]
Nuptiality scenarios. We created each nuptiality scenario by setting the age-specific nuptiality rates for all cohorts of women to the age-specific nuptiality rates of a given cohort. For instance, in the 1896–1905 scenario, all women are assigned the age-specific nuptiality rates of women born between 1896 and 1905. ‘Freezing’ the nuptiality rates of all women to the rates of a given cohort allows us to identify the nuptiality pattern that yields the highest (or lowest) number of births and compare it with the reference scenario.
As shown in Figure 8, the increase in nuptiality during the first half of the twentieth century increased the number of births during the boom, and the nuptiality scenarios that lead to the highest numbers of births are those of the cohorts born after 1930. The reference scenario appears to be closer to the nuptiality scenarios that lead to the highest numbers of births, as the scenario with the highest positive effect on natality (1936–40) increases the total number of births by 7 per cent, whereas the scenario with the highest negative effect (1906–10) reduces this number by 18 per cent.
17
Fertility scenarios. We created each fertility scenario by setting the marital and non-marital age-specific fertility rates during the baby boom to the values of a few given years. We selected a limited number of years based on their significance in the evolution of fertility in Quebec: the highest total fertility rate (TFR) before the boom was in 1926, with the lowest in 1939; the highest marital TFR during the boom was in 1947; the highest TFR during the boom was in 1957, with the lowest in 1964.
As expected in the case of Quebec, the decrease in marital fertility during the boom had a negative effect on the number of births, as all but one of the fertility scenarios lead to slightly more births than the actual total number observed during the boom (Figure 8). Even the 1939 scenario, with the lowest TFR before the boom, leads to more births than the actual total number observed during the boom. The 1964 scenario is the only one that leads to fewer births than the reference scenario.
Interestingly, the 1957 scenario, based on the rates prevailing in the year in which the TFR reached its peak during the boom, provides a total number of births just over that of the reference scenario (3 per cent higher). Even though the TFR was at its peak in 1957, marital fertility was decreasing, so age-specific marital fertility rates were actually lower in 1957 than in 1947. Finally, the 1926 scenario, in which rates are furthest from those observed during the boom, has the largest impact on the total number of births (+34 per cent).
Migration scenarios. We designed one migration scenario, in which immigration is zero throughout the baby boom, and use this scenario here to measure the impact of migration on the total number of births during the boom. Immigrants coming to Quebec after the Second World War had a small but significant impact on the total number of births during the boom. Had they not come, the total number of births would have been 6 per cent lower (Figure 8).
18
The contribution of demographic components to the volume and dynamics of the baby boom
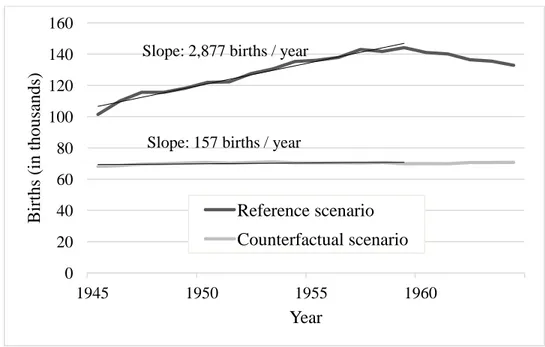
As a complement to measuring the impact of ‘what if’ scenarios involving each demographic component separately, we also attempted to assess the respective contribution of each component to the baby boom, seen as both an outcome and a process. In this subsection, we measure the contribution of a factor to the baby boom as an outcome by estimating the surplus or deficit in the total number of births occurring during the baby boom that is attributable to a change in this factor; we refer to this as the volume. Similarly, we measure the contribution of a factor to the baby boom as a process by estimating the average number of additional births attributable each year to this factor. This quantity can be negative and, given its unit (births per year) and the fact that it bears a direct analogy to a regression coefficient, we refer to it as the slope of the contribution of the factor to the baby boom. This quantity can be interpreted as a measure of the importance of the factor for the dynamics of the baby boom. Both the volume and the slope are socially meaningful as they determine the relative demographic importance of the successive birth cohorts of baby boomers.
In order to assess the impact of each demographic component on the volume and slope of the boom, first a counterfactual scenario had to be chosen as a basis for comparison with the reference scenario, the latter defined as the modelling of the actual number of births during the baby boom (Adjusted model in Figure 7). Using actual parameters from the pre-boom period, we chose to design a scenario that minimized both the volume and the absolute value of the slope. To that effect, the counterfactual scenario incorporates the year with the lowest pre-boom period marital fertility rates (1939), the cohorts with the lowest nuptiality (1901–05), the year with highest period mortality rates (1896), and zero net migration during the boom. The counterfactual
19
scenario keeps these rates constant throughout the simulation, which yields a slope that is very close to zero (Figure 9).
[Figure 9]
Any choice of a counterfactual scenario entails a certain amount of arbitrariness. Nevertheless, we believe that minimizing both the volume and the slope is convenient, coherent, and analytically sound. First, it provides an estimate of the range of possible outcomes lying between the reference scenario and the ‘lowest case’ scenario in terms of the number of births (volume). Second, it provides a measure of the impact of a factor in comparison with a stationary demographic regime where all rates are kept constant (slope). In both cases, the relative contribution of each component can also be assessed.
The effect of a given demographic component on the baby boom is calculated as the difference between the outcome of the reference scenario and the outcome of the counterfactual scenario that minimizes the number of births for this component. Given the structure of our model, such a difference may be computed for eight different combinations of parameters for the other three demographic factors, which take on the value of the reference or counterfactual scenarios, respectively. To synthesize the effect of each component, the mean contribution is computed by averaging the difference between the reference scenario and each of these eight other scenarios (see section B of the Appendix for more details).
Volume of the baby boom. The reference scenario yields a total of 2.6 million births during the period 1945–64 compared with 1.4 million in the counterfactual scenario, the number that would have been observed if each of the demographic parameters had been constant at its most
20
unfavourable value during the period 1896–1944. The contribution of each demographic component to the 1.2 million extra births is summarized in Table 1.
[Table 1]
Changes in marriage patterns during the first half of the twentieth century had a very positive impact on the number of births during the boom. The reference scenario yields nearly 341 thousand extra births when compared with the counterfactual scenario (nuptiality of the 1901–05 cohorts), accounting for 29 per cent of the total difference.
As expected in the case of Quebec, the decrease in marital fertility during the boom had a negative effect on the number of births, hence the counterfactual scenario leads to more births than the actual number observed during the boom. The reference scenario yields 31 thousand fewer births than the counterfactual scenario, representing ˗3 per cent of the total difference. This is consistent with the fact that marital fertility rates during the boom were lower than in any other time before this period.
The number of extra births attributable to the mortality decrease during the first half of the twentieth century, when compared with the number of births that would have been observed under the late-nineteenth-century mortality conditions, amounts to an impressive 714 thousand births. This factor alone accounts for 60 per cent of the total difference, more than twice the impact of nuptiality and almost four times that of immigration.
Finally, immigrants coming to Quebec after the Second World War had a smaller but significant impact on the total number of births during the boom. Had they not come, the total number of births would have been over 160 thousand lower, representing 14 per cent of the total difference.
21
Slope of the baby boom. Alongside the increased number of births observed during its entire duration, the defining characteristic of the baby boom was the unexpected and swift increase in the number of births occurring during its ascending phase, the slope of the baby boom. For Quebec, this phase corresponds to the period 1945–59, that is, from the beginning of the baby boom in our model to the year where the annual number of births reached its maximum (144,500 in 1959). Table 1 also reports our estimates of the contribution of each demographic component to the slope of the baby boom, along with their corresponding percentage contributions to the total change.
The largest contributions to that second dimension of the boom come from mortality (48 per cent), closely followed by nuptiality (42 per cent), and migration (at 36 per cent). As would be expected, fertility changes contributed negatively to the slope of the boom, reducing the total slope by 26 per cent.
As can be seen here, the impact of a parameter on the slope of the baby boom during its ascending phase is different from its impact on the total number of births. While the volume measures the impact of a parameter’s absolute value on the total number of births, the slope instead captures the impact of a parameter’s dynamics (its evolution over time) on the dynamics of the baby boom (the rate of increase in the number of births during this period). For instance, the relative impact of mortality is larger on the volume than on the slope of the baby boom. On the other hand, the impact of immigration on the total number of births is relatively modest (+14 per cent), while its relative impact on the slope of the boom is more than twice as important (+36 per cent). That is because the changes in immigration occurred over a relatively short period of time compared with the mortality transition and the changes in marriage patterns.
22
Finally, we note that the sum of average contributions amounts to 2,720 births per year, which equals the difference between the reference scenario (2,877 births per year) and the counterfactual scenario (157 births per year) as shown in Figure 9. Contributions of each factor to the overall slope add up linearly, so there do not appear to be any significant non-linear interactions between the four demographic components in the horizon of the simulation.
Discussion and conclusion
In this paper, our goal was to substantiate the hypothesis that the epidemiologic transition was an important factor in the unfolding of the baby boom in Quebec. The core idea was that decreasing infant and child mortality at the beginning of the twentieth century provided larger than before cohorts of women of reproductive age that made possible the large increase in the number of births, the main feature of the baby boom. The microsimulation approach allowed us to reveal the mechanics of the baby boom in an integrated way that, to our knowledge, had not yet been achieved, and its results substantiated the hypothesis. It also yielded measures to assess the relative contribution of each demographic component to the occurrence of the baby boom, both as an outcome (volume) and a process (slope). According to the counterfactual scenarios we designed, keeping mortality rates at their highest level for the 50-year period preceding the baby boom would have yielded 30 per cent fewer births during the boom. The number of births was 18 per cent lower in the scenario based on the lowest nuptiality rates and 6 per cent lower in the scenario with zero net migration. In the specific case of Quebec, all fertility scenarios except the 1964 one yielded more births than actually observed during the baby boom. Mortality also stood out as the demographic component with the largest impact on the number of births when assessing the relative contribution of each component to the volume and slope of the baby boom, with nuptiality always second in magnitude. The relative impact of mortality was slightly reduced
23
when looking at the slope of the baby boom, as increases in nuptiality and immigration were more concentrated in time.
The unusual feature of the Quebec baby boom—the negative role played by marital fertility—must not obscure two general conclusions that stem from our analysis. First, the role of the epidemiologic transition that was unveiled in this very particular context is likely to have been important everywhere, including in countries where the baby boom unfolded in a more conventional way. Second, by shifting the focus of our analysis to the combination of all four demographic components (nuptiality, fertility, mortality, and migration), microsimulation modelling has contributed to broadening our understanding of the baby boom and of the variations in its timing, magnitude, and volume in a wide range of countries.
Based on what is known about mortality trends in the industrialized world between 1900 and 1960, it is difficult to find one country where this component would not have played a positive role in the baby boom. Even though the levels were not the same everywhere, evidence for European countries between 1900 and 1930 suggests decreases in infant mortality rates in the range of 40 per cent and in mortality from ages 1 to 15 of almost 60 per cent (Chasteland, 1960). The reported decreases were at least as important between 1930 and 1950. The situation was similar in North America, as reported by Rao (1973) for the US. He describes the mortality decrease in this country in three phases, where the second phase (1900–50) was the most rapid, with a ten-point increase in survival rates from birth to age 15 (Rao 1973, p. 410), similar to that observed in Quebec. The magnitude of the mortality decrease was similar in the rest of Canada, although Quebec displayed higher mortality rates than the other provinces until about 1970 (Bourbeau et al. 1982).
24
The broadening of the analysis to encompass all four basic demographic components is a crucial step forwards in our ability to provide a better account of the baby boom in various settings. For example, the role of migration that was unveiled in our model seems perfectly in line with larger baby booms observed in countries like Australia, New Zealand, the US, and Canada, where immigration rates increased after the Second World War (Van Bavel and Reher 2013, pp. 264–66). In other locations, immigration could have played no role, or even a negative role in countries with net emigration, while the other three components could have been entirely responsible for the baby boom. Considering that both the levels and timing of the changes may have varied for each component in different countries, this new approach may yield a useful key to understanding the wide diversity in the experience of the baby boom recently highlighted by Van Bavel and Reher (2013).
When combined with the recent, fine-grained work on fertility and marriage patterns described in the ‘Introduction’, these results point to a new narrative for the baby boom. First, this significant and sudden increase in the number of births in most industrialized countries between the end of the 1930s and the mid-1960s was fuelled by the epidemiologic transition that unfolded during the first decades of the twentieth century. Second, the baby boom was also shaped significantly by the renewed popularity of marriage that, as far as evidence now suggests, was almost universal in the Western world. Third, at a time when educational achievement was on the rise, the fact that well-educated women were the most affected by marriage transformations also contributed to the extent of the baby boom. Fourth, in places and for groups whose fertility had reached very low levels before the boom (Van Bavel 2010), fertility outcomes of married women did increase during the period of the baby boom. Fifth and lastly, international migration trends after the Second World War modulated the magnitude of the baby boom in
25
various countries. It is obvious from this schematic account that the baby boom occurred in a truly exceptional period, but the exceptional character of these circumstances went well beyond the reversal of the long-term fertility decrease associated with the demographic transition. It had as much to do with mortality, marriage, and migration.
Significant progress has recently been made in understanding the baby boom, but at least three areas still appear to require more attention. The first one concerns the need for replicating the microsimulation approach used in this paper for other regions or countries, using projection techniques applied retrospectively to historical data. Although this work is very data intensive, there is no doubt that it could be applied to other contexts where fairly good demographic statistics are available. This is important for accumulating evidence about the respective role of demographic factors in the unfolding of the baby boom in various settings.
The second area pertains to the crucial role of marriage as a driving force of the baby boom. We need to understand better what went on during the first decades of the twentieth century to produce these record proportions of young people getting married, and at much younger ages than before. Learning more about which groups contributed most to this change is an important objective that researchers have started to address. For example, work on Sweden, Spain, and Canada has shown that well-educated women, whose numbers were growing rapidly at the time, were most affected by the changes (Sandström 2017; Requena and Salazar 2014; Gauvreau and Laplante 2016a). On the other hand, men from the lower classes were apparently losing ground in the marriage market. In Canada, Catholics were the most affected, a pattern related to the growing disaffection towards the religious orders. These specific results and the general trends that they signal must be reconciled with broader historical interpretations of marriage during the first half of the twentieth century.
26
The third area concerns fertility, more specifically marital fertility, which must be studied independently from the transformations in marriage. As seen in the case of Quebec, and particularly for French-Catholic women, marriage rates increased significantly and age at marriage went down, while the fertility of married women continued to decrease during the baby boom. From the point of view of completed family size, the logic underlying one change was completely at odds with the logic underlying the other. This situation suggests that the rationale of the fertility transition continued to prevail even during the baby boom in the (rare) cases where fertility was still relatively high. Recent work by Sánchez-Barricarte (2018) suggests that other Catholic countries like Spain, Portugal, and Italy may have been in a similar situation, although they all experienced much smaller baby booms. Another feature of the Canadian baby boom was that beyond the diverging patterns that characterized fertility, there was a remarkable convergence towards similar fertility outcomes (about 3 children per family) around the end of the baby boom (Gauvreau and Laplante 2016b). Thus, our research should not only be concerned with the reasons for the increase in marital fertility, which remains a very important question, but also for the normalization process that was taking place in parallel.
Work conducted in the last few years has opened up new perspectives for considering the baby boom as a key demographic feature of the twentieth century, one that contributes to bridging the gap between the first and second demographic transitions. On the one hand, the association with the epidemiologic transition unveiled in this paper, and the fact that the logic of the fertility transition still prevailed in a few cases where fertility had not yet reached post-transitional levels, both point to a direct connection with the first demographic transition. On the other hand, the reconfiguration of reproductive work that was taking place during the baby boom, involving a much larger share of women, particularly well-educated women, seems to have paved
27
the way for some of the most important changes associated with the second demographic transition. A few decades after the baby boom, women of all levels of education not only had access to marriage and childbearing; they also wanted to work while raising their children, opening the door to greater independence and contributing to a shake-up of the foundations of the family.
Notes and acknowledgments
1 Danielle Gauvreau is at Concordia University, Montreal, Canada; Patrick Sabourin, Samuel Vézina, and Benoît Laplante are all at the Institut national de la recherche scientifique, Montreal, Canada. Please direct all correspondence to Danielle Gauvreau, Henry F. Hall Building, S-H 1125–67, 1455 De Maisonneuve Blvd. W., Montreal (Quebec), H3G 1M8, Canada; or by E-mail: danielle.gauvreau@concordia.ca
2 This work was supported by the Social Sciences and Humanities Research Council of Canada (SSHRC). Results pertaining to nuptiality were derived using confidential data at the Quebec Inter-University Centre for Social Statistics (QICSS), a member of the Canadian Research Data Centre Network. The services and activities provided by the QICSS are made possible by the financial support or support in kind of the SSHRC, the Canadian Institutes of Health Research (CIHR), the Canada Foundation for Innovation (CFI), Statistics Canada, the Fonds de recherche du Québec—Société et culture (FRQSC), and the Quebec universities.
The microsimulation model used in this research was designed using Modgen, a programming language developed and maintained by Statistics Canada. Modgen and its documentation can be downloaded for free from the agency’s website at:
28
http://www.statcan.gc.ca/eng/microsimulation/modgen/modgen .
3 We wish to thank the two anonymous reviewers for their insightful comments on a previous version of this paper.
29
Appendix: Accompanying information on methods
A. The microsimulation model
Our model is a continuous-time case-based microsimulation model developed using Modgen 11. Modgen is a C++ based microsimulation language developed and maintained by Statistics Canada (Statistics Canada 2016a).
Microsimulation is a projection technique analogous to the well-established cohort component or multistate methods. Whereas in multistate projections, transition probabilities are applied to aggregates, in microsimulation transition, probabilities are instead applied to individual agents, thus allowing the simulation of individual biographies. In a multistate model, for instance, a 10 per cent probability of dying over a given unit of time applied to a population of 100 individuals invariably leads to ten deaths. In a microsimulation model, if each simulated individual is subjected to a 10 per cent probability of dying, the number of deaths will on average amount to ten for a population of 100. For a given model, each single simulation will give slightly different results owing to the randomness of the simulation process. This random fluctuation is known as the Monte–Carlo error; for large populations, this error is negligible (Van Imhoff and Post 1998). Zaidi et al. (2009) give a good introduction to microsimulation and its applications; Bélanger and Sabourin (2017) provides an introduction to microsimulation programming using Modgen.
The advantages of microsimulation over multistate projections are numerous. Microsimulation models are more flexible and scalable. In multistate projections, the size of transition matrices grows exponentially with the number of variables included in the model, greatly complicating matrix manipulations and computations. There are no such problems in microsimulation as this technique does not rely on matrix algebra. Microsimulation also allows
30
for the inclusion of continuous variables (such variables need to be grouped into classes in multistate simulation) and the implementation of continuous-time duration models (Van Imhoff and Post 1998).
B. Estimating the contribution of each demographic component
Given that the outcome of the simulation depends on the rates associated with the other demographic components, there is no single indisputable way to compute the effect of each component (nuptiality, fertility, mortality, and migration) on the volume and slope of the change, as it is also dependent on the counterfactual scenario used for comparison. In our case, the effect of a factor is calculated as the difference between the outcome of the reference scenario and the outcome of the counterfactual scenario that minimizes the number of births for this factor. Given the structure of our model, such a difference may be computed using eight different combinations of parameters for the other three demographic factors.
Consequently, the contribution of a given factor to the volume or slope of the baby boom is defined as the average difference between the outcome (total number of births or average annual change in the number of births) of the scenario where the factor takes its value from the reference scenario and the outcome of the scenario where the factor takes its value from the counterfactual scenario, while the other three factors successively take their values from either the reference or counterfactual scenarios, respectively. Formally,
2 2 2 1 1 1 , 8
Rijk Cijk i j k β β κ 2 2 2 1 1 1 , 8
Rijk Cijk i j k β β κ (1)31
where κ is the contribution of a given factor to the volume or the slope of the baby boom; βRijk is
the outcome in the scenario where the factor takes its value from the reference scenario; and factors i, j, and k successively take their values from the reference scenario (when i, j, or k take value 1) or the counterfactual scenario (when i, j, or k take value 2); and βCijk is the outcome in
the scenario where the factor takes its value from the counterfactual scenario and factors i, j, and k successively take their values from the reference or counterfactual scenarios.
By incorporating pre-boom parameters that minimize the number of births during the boom, and keeping these parameters constant throughout the simulation, the counterfactual scenario minimizes both the volume and the absolute value of the slope of the boom. For any given factor, the difference between the reference and counterfactual scenarios provides an estimate of the impact of this factor on the volume or slope of the boom.
The volume of the boom is simply defined as the sum total of the number of births occurring between 1945 and 1964 in the simulation. The slope of the boom, or the average annual change in the number of births, is estimated as the slope of the linear regression of the annual number of births on year between 1945 and 1959, that is, from the beginning of the baby boom in our model to the year where the annual number of births reached its maximum. Thus,
,
Sijk Sijk Sijk
N α β Y ε
,
Sijk Sijk Sijk
N
α
β Y ε
(2)where N is the number of births occurring in year Y; S is either the counterfactual (C) or reference (R) scenario; and i, j, and k have the same meanings as in equation (1). To make the estimates of the slopes comparable, they are standardized on the basis of the reference scenario. This standardization is done by dividing the slope by the number of births in 1945 in the scenario from
32
which it was estimated, then multiplying the result by the number of births that occurred in 1945 in the reference scenario.
The combination of values used in the counterfactual scenario is arbitrary, but as long as these values remain constant throughout the simulation, this is of no consequence for the estimates of slopes. Using a different counterfactual scenario would produce a different series of changes in the annual number of births, but the year-to-year differences in the changes would be the same. Thus, the estimate of the slope is the same regardless of the composition of the counterfactual scenario, while the intercept of the regression of the annual number of births on year varies with the composition of the counterfactual scenario. To get a different outcome in terms of slope, the counterfactual scenario would need parameters that vary over time.
The total number of births, however, does vary according to the values of the parameters chosen for the counterfactual scenario. We chose parameters that minimized the number of births during the boom (within the limits of observed demographic parameters in the pre-boom period) in order to get an estimate of the range of possible outcomes between the reference scenario (what actually happened) and a ‘lowest case’ scenario. Other choices would provide different quantitative results but would lead to the same qualitative conclusions.
A technical example
The contribution of a demographic factor to the volume and slope of the baby boom may be estimated by comparing different scenarios each involving a different combination of rates taken either from the reference or counterfactual scenarios. We assess the impact of each of the four demographic components using an iterative approach. We present the results of this calculation for all factors and all possible combinations. Equation (1) formalizes this approach.
33
This may be illustrated by describing the computation of the contribution of mortality to the volume of the baby boom. The counterfactual scenario—which combines the mortality rates of 1896, the fertility rates of 1939, the nuptiality rates of the 1901–05 cohorts, and immigration set to zero during the baby boom—leads to a total of 1.40 million births during the boom. If the mortality rates are replaced with those of the reference scenario, the total volume of births becomes 2.05 million. Taking the difference between the outcomes of the two scenarios, that is, 650,000 births, gives one of several possible evaluations of the contribution of mortality to the total number of births occurring during the baby boom. What we just described is the contribution of mortality computed using the pair of scenarios reported as FNI in Figure A1
[Figure A1]
The impact of mortality can also be measured by comparing two scenarios where the values of nuptiality rates and migration are those of the counterfactual scenario, while the fertility rates are those of the reference scenario. This is the FNI pair of scenarios for mortality reported in Figure A1. The capital letters in each name of a pair of scenarios refer to the three demographic factors whose contributions are not evaluated but are used as a basis for evaluating the contribution of the fourth factor. The capital letter is underlined when the rates for the corresponding factor are taken from the counterfactual scenario but bold when they are taken from the reference scenario. The FNI scenario, in which mortality takes its rates from the reference scenario, leads to a total of 2.03 million births, while the FNI scenario, in which mortality takes its rates from the counterfactual scenario, leads to 1.39 million births. The contribution of mortality to the volume measured from the pair of FNI scenarios is thus 640,000 births. Finally, the contribution of each demographic factor is obtained from the average of all possible combinations of scenarios.
34
The same method was applied to derive the impact of the four components on the slope of the baby boom. As shown in Figure 9, the counterfactual scenario has a slope of 157 births per year. If the mortality rates are replaced with those of the reference scenario, the slope becomes 1,501 births per year. The contribution of mortality to the increase in the slope, measured from the pair of FNI scenarios, is thus 1,344 births per year, as reported in Figure A2.
[Figure A2]
The results reported in Figures A1 and A2 show definite trends. The impact of each of the four demographic components on both the volume and slope of the boom is clear. Results appear robust since all combinations lead to similar conclusions. The order in which the parameters are introduced thus has little impact on overall results.
35 References
Baillargeon, Denyse. 2004. Un Québec en mal d’enfants. La médicalisation de la maternité, 1910–1970. Montreal : Éditions du Remue-Ménage.
Bélanger, Alain and Patrick Sabourin. 2017. Microsimulation and Population Dynamics: an Introduction to Modgen 12. The Springer Series on Demographic Methods and Population Analysis (43). Springer.
Bourbeau, Robert and Jacques Légaré. 1982. Évolution de la mortalité au Canada et au Québec 1831–1931: Essai de mesure par génération. (Démographie canadienne 6). Montréal: Presses de l’Université de Montréal.
Bourbeau, Robert and Mélanie Smuga. 2003. La baisse de la mortalité: les bénéfices de la médecine et du développement, in Victor Piché and Céline LeBourdais (eds.), La démographie québécoise. Enjeux du XXIe siècle. Montréal: Les Presses de l’Université de Montréal, pp. 24-65.
Bureau de la statistique du Québec. 1976a. Tendances passées et perspectives d’évolution de la mortalité. Québec: Gouvernement du Québec.
Bureau de la statistique du Québec. 1976b. Tendances passées et perspectives d’évolution de la fécondité. Québec: Gouvernement du Québec.
Bureau de la statistique du Québec. 1976c. Tendances passées et perspectives d’évolution des échanges migratoires du Québec avec l’extérieur. Québec: Gouvernement du Québec.
Canadian Human Mortality Database. 2014. Department of Demography, Université de Montréal (Canada). Available at http://www.bdlc.umontreal.ca/chmd/index.htm (data downloaded in September 2015).
36
Chasteland, Jean-Claude. 1960. Évolution générale de la mortalité en Europe occidentale de 1900 à 1950, Population 15(1): 59–88.
Desrosiers, Denise, Joel W. Gregory and Victor Piché. 1978. La migration au Québec : synthèse et bilan bibliographique, Études et documents no 2, Québec : Ministère de l’Immigration.
Dominion Bureau of Statistics. 1946. Eight Census of Canada 1941, Volume III Ages of the population, Table 7.
Duvoisin, Aline and Michel Oris. 2013. Les différentiels sociaux de fécondité durant le baby-boom en Suisse. Paper presented at the XXVIIth IUSSP International Population Conference. Busan, Korea.
(http://iussp.org/sites/default/files/event_call_for_papers/Duvoisin_Oris_VF.pdf)
Gauvreau, Danielle. 1993. Donner la vie et en mourir. La mortalité des femmes en couches au Québec avant 1960, in Dennis D. Cordell, Danielle Gauvreau, Raymond Gervais and Céline LeBourdais (eds.), Population, reproduction, sociétés : perspectives et enjeux de démographie sociale. Montréal: Presses de l’Université de Montréal, pp. 235–256.
Gauvreau, Danielle and Benoît Laplante. 2016a. Le baby-boom québécois : l’importance du mariage, Cahiers québécois de démographie 45(1): 1–26.
Gauvreau, Danielle and Benoît Laplante, 2016b. La fécondité au Canada Durant le Baby-Boom. Divergence et convergence des comportements, Annales de démographie historique (2): 65– 110.
Gauvreau, Danielle, Benoît Laplante and Megan Wearda. 2015. Family Formation during the Baby Boom: Canadian Marriage Trends in Perspective, paper presented at the Annual Meeting of the Population Association of America, San Diego.
37
Henripin, Jacques, 1968. Tendances et facteurs de la fécondité au Canada. Ottawa : Bureau fédéral de la statistique.
Institut de la statistique du Québec, 2018. Naissances et taux de natalité, Québec, 1900–2016. Available at
http://www.stat.gouv.qc.ca/statistiques/population-demographie/naissance-fecondite/401.htm (accessed: January 2018)
Kempeneers, Marianne and Isabelle Van Pevenage, 2015. Le Baby-Boom au Québec. Une étape décisive de la division sociale du travail, in Catherine Bonvalet, Ignace Olazabal, and Michel Oris (eds.), Les baby-boomers, une histoire de familles. Une comparaison Québec-France. Quebec City: Presses de l’Université du Québec, pp. 83–98.
Lapierre-Adamcyk, Evelyne and Marie-Hélène Lussier. 2003. De la forte fécondité à la fécondité désirée, in Victor Piché and Céline LeBourdais (eds.), La démographie québécoise. Enjeux du XXIe siècle. Montreal: Les Presses de l’Université de Montréal, pp. 66–109.
McInnis, Marvin. 2000. Canada’s Population in the Twentieth Century, in Michael R. Haines and Richard H. Steckel (eds), A Population History of North America. Cambridge: Cambridge University Press, pp. 528–599.
Omran, Abdel R. 2005. The epidemiologic transition: A theory of the epidemiology of population change, The Milbank Quarterly, 83(4): 731–757. Reprinted from The Milbank Memorial Fund Quarterly, 49(4): 509–538 (1971).
Péron, Yves. 2003. Du mariage obligatoire au mariage facultatif, in La démographie québécoise. Enjeux du XXIe siècle. Victor Piché and Céline Le Bourdais (eds.), Montreal, Les Presses de l’Université de Montréal : 110–143.


![Risiko- & [und] Schutzfaktoren der psychischen Gesundheit humanitärer Einsatzhelfer : eine systematische Literaturübersicht](data:image/gif;base64,R0lGODlhAQABAIAAAP///wAAACH5BAEAAAAALAAAAAABAAEAAAICRAEAOw==)