HAL Id: sic_00737399
https://archivesic.ccsd.cnrs.fr/sic_00737399
Submitted on 5 Oct 2019
HAL is a multi-disciplinary open access archive for the deposit and dissemination of sci-entific research documents, whether they are pub-lished or not. The documents may come from
L’archive ouverte pluridisciplinaire HAL, est destinée au dépôt et à la diffusion de documents scientifiques de niveau recherche, publiés ou non, émanant des établissements d’enseignement et de
To cite this version:
Chérifa Boukacem, Joachim Schöpfel. Statistics usage by French academic libraries: a survey. Learned Publishing, Association of Learned and Professional Society Publishers, 2012, 25 (4), pp.271-278. �10.1087/20120406�. �sic_00737399�
Learned Publishing, 25: 271–278
doi:10.1087/20120406 Statistics usage by French academic libraries – a survey
Chérifa Boukacem-Zeghmouri and Joachim Schöpfel LEARNED PUBLISHINGVOL. 25NO. 4OCTOBER 2012
I
ntroductionThe digital revolution has taken place. Processing e-resources have become part of everyday life in academic librar-ies. Today, library management includes monitoring, assessment of usage, and perfor-mance measurement. Stakeholders ask for reporting and return on investment. How do academic librarians deal with usage statistics and log files? What do we know about their experience, feedback, needs?
Workshops and seminars,1 discussions on
mailing lists such as lib-stats, SERIALST or lis-e-resources, and surveys2 provide insight
and empirical evidence on the reality of dealing with statistics. However, this knowl-edge is more or less limited to the UK and US library communities, and we know but little about other, non-English-speaking countries such as France.
Seven years ago, when we published our first article on the COUNTER project3and
when the French institute for scientific in-formation INIST translated the COUNTER Code of Practice,4French academic libraries
generally had poor or no experience with usage statistics of online resources. Com-pared to the UK, uptake of digital resources was delayed because of the language barrier, lack of larger scientific journal publishers, and a rather fragmented landscape of scien-tific structures and libraries.
In 2012, the situation has changed. Small and medium-sized French universities have merged into large and competitive organizations, and consumption of digital information has increased rapidly and steadily. The French academic consortium COUPERIN established a working group on usage statistics. Two research projects evalu-ated usage statistics of academic libraries and open archives. France is a partner of the European PEER project. The Lille 3 univer-sity organized an international conference
RESEARCH ARTICLE
Statistics usage by
French academic
libraries: a survey
Chérifa BOUKACEM-ZEGHMOURI
Université de Lyon, Lyon 1, Laboratoire Elico, Urfist de Lyon
Joachim SCHÖPFEL
Université Charles-de-Gaulle, Lille 3, Laboratoire Geriico
ABSTRACT. The article presents a survey on usage statistics management in academic libraries in France. The objective is to provide empirical evidence on real methods and processes, best practices and problems experienced by librarians. The survey adapted Baker and Read’s methodology to the French context. One-third of French academic libraries answered the survey. Results show that usage statistics are crucial for librarians’ daily work. COUNTER reports are mostly used, specifically the JR1 format. Two-thirds of the libraries enhance the usage statistics with other data. Librarians face three major difficulties: lack of time, lack of usage data produced by French vendors, and the need for customized tools. The article contains a short literature review and ends with recommendations for further studies. It is the first published survey on usage data management in France and allows for comparison with results from other countries.
on usage assessment and practice in 2009;5
even if the context may be different between countries, the basic challenges and problems are not.6
These projects and initiatives reflect growing awareness of and interest in the topic in France. Nevertheless, what do we know about real methods and processes, best practices, and the problems experienced by librarians?
Literature review
Compared to the growing amount of re-search based on results of the exploitation of usage statistics of digital resources in aca-demic libraries, the small number of articles dedicated to the processing of usage statis-tics itself is surprising. These studies show that statistics gained importance from about the year 2000. Yet in the beginning, this evo-lution was slow because of the lack of committed human resources and technical competencies. The second difficulty libraries encountered was missing standards, even if the COUNTER project proposed solutions from 2003–2004.7The following years, 2005,
2006 and 2007, were a period of increasing automation of data collection, formatting, preservation, and processing, using tools such SUSHI, ScholarlyStats, or ERMS.8
Publications that are more recent often deal with two topics: technical problems9
and usage of statistics for decision-making. A recent UKSG seminar underscored the
importance of usage statistics for deci-sion-making. Paradoxically, the increasing availability of data, the continuous develop-ment of the COUNTER Code of Practice and the financial pressure by governments has produced similar effects and fostered exploitation of these data. Usage statistics contribute to decisions somewhere between ‘what could be cancelled’ and ‘what should be cancelled’.10 The most recent articles
focus on usage statistics as a tool for return on investment analysis (ROI).11
Our study is the first in the French-speak-ing scientific literature to analyse the uptake and usage of statistics in academic libraries.
Methodology
Our methodology adapts the 2008 Tennes-see survey2 to the French context. We sent
the adapted survey in November 2010 to the digital resources librarians of 87 French aca-demic libraries, in print format, giving them three months to reply (see Appendix).
More detailed than the Tennessee survey, our questionnaire adopts the same structure, with three main sections: the first section is on the library (size, patrons, and subjects); the second section is on the vendor-supplied usage statistics; the third section is on the data processing, tools, and objectives. Most questions are closed but some are open and provide opportunities to add comments, etc., which is important for this kind of explor-atory study.
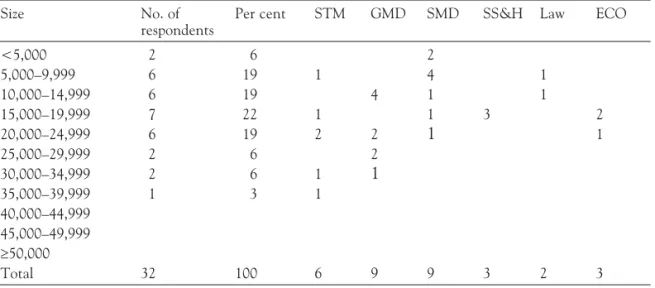
Table 1. Break-down of French university libraries by subject domain
Size No. of
respondents
Per cent STM GMD SMD SS&H Law ECO
<5,000 2 6 2 5,000–9,999 6 19 1 4 1 10,000–14,999 6 19 4 1 1 15,000–19,999 7 22 1 1 3 2 20,000–24,999 6 19 2 2 1 1 25,000–29,999 2 6 2 30,000–34,999 2 6 1 1 35,000–39,999 1 3 1 40,000–44,999 45,000–49,999 ³50,000 Total 32 100 6 9 9 3 2 3
the small
number of
articles
dedicated to the
processing of
usage statistics
itself is
surprising
The questions cover the period 2009– 2010.
The French official definition of ‘users’ globally corresponds to the common ‘aca-demic staff FTE’ in the UK aca‘aca-demic environment and includes academics, scien-tists, PhD (graduate) students, and postdocs. For this survey, we added undergraduates.
Findings
Thirty-two academic libraries replied to the survey. The response rate (37%) is satisfying. The responding institutions represent the whole range of French universities classified in five groups following their dominant sci-entific domains: STM (sciences, technology, medicine), GMD (grand multidisciplinary) and SMD (small or medium-sized multi-disciplinary), SS&H (social sciences and humanities, including arts), Law (law) and ECO (business, including economics and management). Table 1 shows their break-down by type and size.
The size of the participating universities ranges from 2,500 to more than 36,000 undergraduates, PhD students and scholars. 85% have less than 25,000 students and scholars. To allow direct comparison with Baker and Read,2 we collapsed these
groups into four: <10,000 (8 universities), 10,000–14,999 (6 universities), 15,000– 24,999 (13 universities), =25,000 (5 univer-sities). Undergraduates represent 85% of the overall population; PhD students represent 11% and scholars 6%.
Publishers and resources
Together, the university libraries subscribed to 538,708 journals (print titles are not included) from 2,071 publishers and
aggregators (cumulated). The number of subscriptions ranged from 3,050 to 50,000 titles, with a median of 12,168. 81% of the libraries reported usage statistics beyond 50,000 annual downloads.
We asked the academic libraries for the number of publishers with usage reports. The libraries reported that only 25% of the publishers provide usage statistics. Their number ranged from zero to 55, with a median of 14 (Table 2).
68% of the respondents received monthly reports; annual (39%) or biannual (7%) reports were less frequent. 32% of the librar-ies received usage reports inconsistently and/or on demand.
Purpose for analyzing usage statistics
Why did academic libraries collect and exploit usage data? The most important rea-son was the reporting to the ministry who, as the most important funding body, receives annual reports and standard statistics from all academic libraries. Nearly all respondents (97%) mentioned this reason. Another important purpose (90%) was the usage of statistics for acquisition policy decision-mak-ing, followed by justification of expenditures (71%). Less important were exploitation of data for training, communication and ‘knowledge of users’ (19%).
Type and format of usage reports
90% of the participants received COUN-TER-compliant statistics, in particular the Journal Report 1 (JR1), but also other type of reports (JR1a, JR5, JR2 or JR3, database reports). Nearly half of them (39%) also received usage data that were non-compli-Table 2. Publishers providing usage statistics to libraries
Size No. of
respondents
Per cent No. of publishers
Median Minimum Maximum
<10,000 8 25 18 6 34 10,000–14,999 6 19 13 3 21 15,000–24,999 13 41 14 0 30 ³25,000 5 16 13 3 55 Total 32 100 14 0 55
the libraries
reported that
only 25% of
the publishers
provide usage
statistics
ant with the COUNTER code (downloads, sessions, requests, views, etc.).
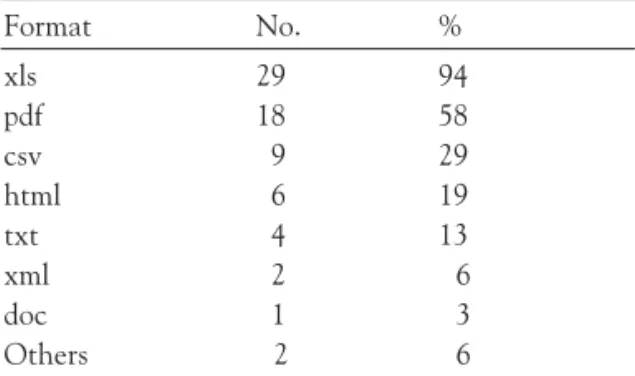
The usage reports were delivered in differ-ent formats, mostly as an Excel spreadsheet (94%) but also in PDF (58%) or in a data-base (29%) or text format (13%) (see Table 3).
Non-compliant reports were most often supplied in PDF.
Most of the participants reported two or more different formats. Just 19% received their statistics in only one format, e.g. Excel.
Time spent on usage data management (2009–2010)
Retrospective estimation of workload proba-bly is not very reliable and difficult to validate. Nevertheless, it may be interesting to gather some global data, especially on rel-ative time allocated to different tasks in processing usage statistics (Table 4).
Librarians reported between 16 and 400 hours spent in 2009 on processing of usage data, with a median of 42 hours. The maxi-mal workload increased with the size of the institution. They spent roughly the same amount of time (27–29%) on downloading,
manipulating, and analysing data and less time on reformatting (16%).
Combining data
Two-thirds (67%) of the participants declared that they combine usage data from publishers with other data, especially with three different types of data: local usage data derived from log files, e.g. for non-commer-cial items (scanned items in repositories); information from the licence (number of authorized users, total amount, co-funding, its duration); and data related to the accessed serials (impact factor, subject/ disci-pline).
The purpose was to obtain detailed met-rics on preferred items and collections, financial metrics, and data on other than commercial resources.
Useful statistics and tools
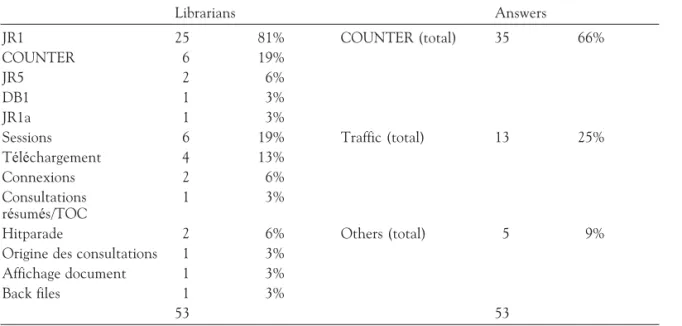
The most important and useful statistics were the COUNTER Journal Report 1 (JR1) ‘Number of Successful Full-Text Article Requests by Month and Journal’. Other sta-tistics were less frequently mentioned, such as number of downloads and sessions, or the hit parade of most often viewed documents (Table 5).
No participant used an electronic resource management system (ERMS) for the han-dling of usage statistics (one library was planning to do so), and no one retrieved usage reports via the SUSHI protocol. One library subscribed to a service that delivered their vendor statistics through a single point of access but was not satisfied with the result.
Three libraries only analysed local usage data (log files) from their EZ proxy server or gathered usage data with web analytics soft-Table 3. Format of usage reports
Format No. % xls 29 94 pdf 18 58 csv 9 29 html 6 19 txt 4 13 xml 2 6 doc 1 3 Others 2 6
Table 4. Number of hours spent processing vendor usage reports
Size No. of
respondents
Per cent No. of hours
Median Minimum Maximum
<10,000 6 22 96 16 166 10,000–14,999 5 19 72 20 280 15,000–24,999 11 41 32 18 300 ³25,000 5 19 112 20 400 Total 27 100 42 16 400
two-thirds
(67%) of the
participants
declared that
they combine
usage data
from publishers
with other data
ware, with significant assistance from their IT department.
Differences between different types of universities
Related to the disciplinary category of their university, the academic libraries have unequal access to usage statistics. French-language publishers in social sciences, humanities, law and economics often do not provide usage data and even when they do, the statistics are seldom COUNTER compli-ant. It is therefore not surprising that the SS&H libraries have less access to data, and only 33% of them spend some time on com-paring and enrichment of data (Table 6).
In comparison, 88% of the SMD libraries and 83% of the STM libraries make compar-ative analyses between the usage reports from different vendors.
Following the survey results, the estimated median time the libraries spent per year on acquisition and processing of usage data shows a significant variation. The SS&H, law, economics and business libraries spend only 37 hours per year on this activity, STM and SMD campus libraries spend 70 hours per year while the libraries of big and medium size multidisciplinary campus spend 210 hours per year on acquisition and pro-cessing of usage reports.
Summary of findings: discussion
Only 25% of the publishers are reported to provide statistics. Such a low percentage is not linked to the publishers’ size but is explained by the fact that the majority of French and francophone publishers – often in humanities and social sciences – do not dispatch statistical data. This problem mainly concerns the libraries dedicated to law, letters, and social sciences. The STM libraries are less affected, since they sub-scribe to the most important international scientific publishers. This phenomenon results in great inequalities in the French university library network.
Academic libraries generally accepted the COUNTER Code of Practice as a standard; in particular, the JR1 format is valued as an essential indicator. Librarians feel that deal-ing with standardized and comparable data Table 5. Useful statistics in libraries
Librarians Answers JR1 25 81% COUNTER (total) 35 66% COUNTER 6 19% JR5 2 6% DB1 1 3% JR1a 1 3%
Sessions 6 19% Traffic (total) 13 25%
Téléchargement 4 13%
Connexions 2 6%
Consultations résumés/TOC
1 3%
Hitparade 2 6% Others (total) 5 9%
Origine des consultations 1 3% Affichage document 1 3%
Back files 1 3%
53 53
Table 6. Library access to statistics by disciplinary categories No. of libraries Comparative analysis (%) Added value (%) SMD 9 88 66 STM 6 83 83
Law & ECO 5 75 75
GMD 9 50 50 SS&H 3 33 33
French-language
publishers in
social sciences,
humanities, law
and economics
often do not
provide usage
data and even
when they do,
the statistics
are seldom
COUNTER
compliant
is very helpful for their work. Nevertheless, they also criticize the occasionally poor qual-ity of vendors’ statistics, e.g. errors such as wrong customer ID or unexplained abnormal activity figures, unstable title bundling, for-bidden access to usage reports, etc. Some of them have even started to question the reli-ability of COUNTER data produced by some platforms.
This may partly explain why at least half of them collect and process non-COUN-TER-compliant statistics, such as reports on sessions and information-seeking character-istics such as form of navigation or search approach. Sometimes, the analysis of local data and log files is intended to reduce a library’s dependence on vendors and, fur-thermore, to control their data.
The survey confirms Baker and Read’s findings on lack of time spent on usage sta-tistics. On average, French librarians say they spend less time than their US col-leagues (1–2 hours per week). This lack of time – even if the estimated time may be subjective and biased – is a cause of frustra-tion and dissatisfacfrustra-tion, especially in STM and multidisciplinary academic libraries. Not only have the usage statistics increased the librarians’ workload but also they feel that they cannot carry out the data analysis as they would like or should do.
The quantitative methodology of our sur-vey provides tendencies while interpretation is not always easy. Even so, most of the results seem to confirm the findings of Baker and Read.2 Furthermore, the delay of the
survey – three months – allowed for a large number of detailed answers to open ques-tions and comments to closed quesques-tions. Nevertheless, some answers obviously need more investigation – for example, the num-ber of subscribed journals because the given figures appear overestimated or may include other type of documents.
Conclusions
Six years after the first publication on COUNTER in France, the findings of our survey seem to be encouraging as they clearly show that the usage statistics have become part of the daily work of most of the academic librarians. However, they also
show the limits and indicate what needs to be done to progress:
1. French academic librarians are short of usage statistics for a significant part of the subscribed resources. Especially many French publishers do not provide data. This partial availability of information limits the interest of metrics and dash-boards.
2. French academic librarians often feel iso-lated and complain of missing opportunity for training and exchange. So far, there are no workshops or seminars on usage statistics, no discussion list or website such as the NESLI and JISC Journal Usage Statistics Portal initiative.12
3. The lack of time, the ‘do-it-yourself ’ character of librarians’ work and their dependency on the vendors’ data heavily affects the value they can add to the statistics. Globally, French academic librarians feel frustrated with too much work for a rather unsatisfying outcome. 4. Tools, procedures and data formats should
be adapted to the French situation, in par-ticular they should take into account the specific needs expressed by the French Ministry of Higher Education for the aca-demic libraries’ annual activity reports.
Recommendations for further studies
Our findings provide first empirical evidence on the handling of usage statistics in French academic libraries. In order to gain further insight, we need qualitative studies on work organization, job skills and expertise, and best practices.
We also need studies on digital resources other than e-journals, such as e-books, insti-tutional repositories, or datasets, and these studies should distinguish between com-mercial resources and non-comcom-mercial information, e.g. grey literature and docu-ments available through open access.
The standardization of usage data needs more communication and promotion, and this promotion should include the develop-ment of efficient tools and procedures. That is why the French academic consortium COUPERIN recently launched a more detailed follow-up study. Their first results largely confirm our own. Furthermore,
six years
after the first
publication on
COUNTER in
France, the
findings of our
survey seem to
be encouraging
COUPERIN works on a French solution of a journal usage statistics portal,13 together
with MIMAS14 and Cranfield University.
The project should be completed in 2012.
Appendix: Survey on electronic journals usage statistics
I The University Library
1 Your Library belongs to which disciplinary category ?
앫STM
앫SS&H
앫Law & Economics
앫Small and medium cross-curricular section – GMD
앫Large cross-curricular section – SMD 2 What is the scope of your audience?
앫Undergraduate and graduate students
앫Postgraduate students
앫Academics
3 How many research laboratories are located on your campus (including combined laboratories)?
4 The library currently subscribes to how many e-journal titles?
앫: … titles
5 What is the current FTE at your institution?
앫From 0 to 5000: … 앫From 5,000 to 10,000: … 앫From 10,000 to 15,000 : … 앫From 15,000 to 20,000 : … 앫From 20,000 to 25,000 : … 앫From 25,000 to 30,000 : … 앫From 30,000 to 35,000 : … 앫From 35,000 to 40,000 : … 앫From 40,000 to 45,000 : … 앫From 45,000 to 50,000 : … 앫50 000 or more: …
II Usage Data (for e-journals)
6 Number of vendors to which your library is subscribed?: …
7 & Out of the previous number – see 6) – How many vendors provide reports for e-journals?: …
8 How often? 앫Weekly 앫Monthly 앫Quarterly 앫Semestrially 앫Annual 앫Other (specify)
Which reports are provided ? … In which format (PDF, txt, xls, …)? …
III Manipulating and Analyzing Data
9. For what purpose are you collecting usage data and analyzing it?:
앫Local and national reports (ESGBU, ERE…)
앫Collection management (subscriptions, cancellations)
앫To justify expenditures
앫Other (Specify) : …
Which reports are the most useful to you and why? … Is there data not included in the reports that you would like to obtain? For what purpose? …
10 The professionals workers involved in the following tasks belong to which categories (A, B or C)?
앫Contacting vendors: …
앫Downloading : …
앫Consolidation and analysis: …
11 In 2009, how many hours did you spend for:
앫Downloading … h
앫Reformating … h
앫Consolidation and manipulating … h
앫Analyzing… h
12 In order to accomplish these tasks, did you use the fol-lowing tools ? 앫SUSHI 앫COUNTER 앫SCHOLARLYSTAT 앫ERMS 앫Other (Specify): …
13 Do you sometimes combine other types of data to those supplied by vendors?
첸 Yes 첸 No If so, which data? …
14 Do you sometimes combine data from different sources in order to have a comparative outlook?
첸 Yes 첸 No
If so, which data did you compare? …
What are the biggest challenges (difficulties, biases) you faced in making effective use of vendor usage sta-tistics ? …
References
1. Bucknell, T., Taylor-Roe, J., Killick, S., and Thomp-son, S. 2011. Usage statistics for decision making. Serials, 24: 17–20.
http://dx.doi.org/10.1629/2417
2. Baker, G. and Read, E.J. 2008. Vendor-supplied usage data for electronic resources: a survey of academic libraries. Learned Publishing, 21: 48–57.
http://dx.doi.org/10.1087/095315108X247276 3. Boukacem-Zeghmouri, C. and Schöpfel, J. 2005.
Statistiques d’utilisation des ressources électroniques en ligne : le projet COUNTER. Bulletin des Bibliothèques de France, 50: 62–66.
4. http://counter.inist.fr/
5. Boukacem-Zeghmouri, C. (ed.)L’information scien-tifique et technique dans l’univers numérique. Mesures et usages. ADBS Editions, Paris, 2010.
6. Schöpfel, J. and Boukacem-Zeghmouri, C. 2010. Assessing online usage. Research Information, 25. 7. Shepherd, P. 2006. The COUNTER code of practice
for books and reference works. Serials, 19: 23–27. http://dx.doi.org/10.1629/1923
8. Bhatt, A. 2007. License Management through the ERMS Application and Critical Importance of Public Display of Terms and Conditions at Your e-Journal Portal: A Practical Approach. Electronic Resources and Libraries Conference. Georgia Institue of Tech-nology, Atlanta. http://hdl.handle.net/1853/13632 9. Xu, F. 2010. Implementation of an electronic resource
assessment system in an academic library.Program: Electronic Library and Information Systems, 24:
374–392.
10. Killick in Bucknellet al., see note 1.
11. Borin, J. and Yi, H. 2011. Assessing an academic library collection through capacity and usage
indica-tors: testing a multi-dimensional model. Collection Building, 30: 120–125.
12. http://www.jusp.mimas.ac.uk/ 13. http://jusp.mimas.ac.uk/ 14. http://mimas.ac.uk/
Chérifa BOUKACEM-ZEGHMOURI
Université de Lyon, Lyon 1, Laboratoire Elico, Urfist de Lyon
Email: [email protected]
Joachim SCHÖPFEL
Université Charles-de-Gaulle, Lille 3, Laboratoire Geriico