HAL Id: pastel-00959615
https://pastel.archives-ouvertes.fr/pastel-00959615
Submitted on 14 Mar 2014HAL is a multi-disciplinary open access
archive for the deposit and dissemination of sci-entific research documents, whether they are pub-lished or not. The documents may come from teaching and research institutions in France or abroad, or from public or private research centers.
L’archive ouverte pluridisciplinaire HAL, est destinée au dépôt et à la diffusion de documents scientifiques de niveau recherche, publiés ou non, émanant des établissements d’enseignement et de recherche français ou étrangers, des laboratoires publics ou privés.
WITH DEGENERACY
Christos Giatsidis
To cite this version:
Christos Giatsidis. GRAPH MINING AND COMMUNITY EVALUATION WITH DEGENERACY. Web. Ecole Polytechnique X, 2013. English. �pastel-00959615�
E VA L U AT I O N W I T H D E G E N E R A C Y
D I S S E R TAT I O N
submitted in partial fulfillmentof the requirements for the degree of
D O C T O R O F É C O L E P O LY T E C H N I Q U E
by
giatsidis christos
every problem will look as a nail.
Acknowledgments
First and foremost my appreciation and gratitude to my supervisor Michalis
Vazirgiannis(LIX,École Polytechnique) for showing his trust and support
through-out my Phd studies.
To Prof. Dimitrios M. Thilikos (LIRMM, CNRS & Univ. Athens) I express my gratitude for helping me with his vast expertise on Graph Theoretic subjects.
Many thanks to Professor Stefano Leonardi (Sapienza University of Rome), fessor Jordi Herrera-Joancomartí (Universitat Autònoma de Barcelona) and Pro-fessor Jie Tang (Tsinghua University) for their thorough reviews and comments of this PhD thesis
Moreover I would like to thank Professor Nicolas Vayatis (CMLA,Ecole Normale Supérieure de Cachan) and Professor Marc Barthelemy (Institut de Physique The-orique, CEA, CNRS-UR) for their participation in the Jury for my defense and for their valid and interesting comments.
I would also like to thank Prof. Christos Faloutsos (Carnegie Mellon University) for accepting to be in the Jury for my defense and his assistance in preparing a concise presentation.
Finally, many thanks to Prof. Jean-Marc Steyaert (LIX,École Polytechnique) for his advice and also for serving as the President of the Jury.
Abstract
The study and analysis of social networks attract attention from a variety of Sci-ences (psychology, statistics, sociology). Among them, the field of Data Mining offers tools to automatically extract useful information on properties of those net-works. More specifically, Graph Mining serves the need to model and investigate social networks especially in the case of large communities – usually found in online media – where social networks are prohibitively large for non-automated methodologies.
The general modeling of a social network is based on graph structures. Nodes of the graph represent individuals and edges signify different actions or types of social connections between them. A community is defined as a subgraph (of a social network) and is characterized by dense connections. Various measures have been proposed to evaluate different quality aspects of such communities – in most cases ignoring various properties of the connections (e.g. directionality).
In the work presented here, the k-core concept is used as a means to evaluate communities and extract information. The k-core structure essentially measures the robustness of an undirected network through degeneracy. Further more ex-tensions of degeneracy are introduced to networks that their edges offer more information than the undirected type.
Starting point is the exploration of properties that can be extracted from undi-rected graphs (of social networks). On this, degeneracy is used to evaluate col-laboration features – a property not captured by the single node metrics or by the established community evaluation metrics – of both individuals and the en-tire community. Next, this process is extended for weighted, directed and signed graphs offering a plethora of novel evaluation metrics for social networks. These new features offer measurement tools for collaboration in social networks where we can assign a weight or a direction to a connection and provide alternative ways to signify the importance of individuals within a community. For signed graphs the extension of degeneracy offers additional metrics that can be used for trust management.
Moreover, a clustering approach is introduced which capitalizes on processing the graph in a hierarchical manner provided by its core expansion sequence, an ordered partition of the graph into different levels according to the k-core decom-position
gate trends and behaviors. The datasets explored include scientific collaboration and citation graphs (DBLP and ARXIV), a snapshot of Wikipedia’s inner graph and trust networks (e.g. Epinions and Slashdot). The findings on these datasets are interesting and the proposed models offer intuitive results.
Résumé
L’étude et l’analyse des réseaux sociaux attirent l’attention d’une variété de sci-ences (psychologie, statistiques, sociologie). Parmi elles, le domaine de la fouille de données offre des outils pour extraire automatiquement des informations utiles sur les propriétés de ces réseaux. Plus précisément, la fouille de graphes répond au besoin de modéliser et d’étudier les réseaux sociaux en particulier dans le cas des grandes communautés que l’on trouve habituellement dans les médias en ligne oú la taille des réseaux sociaux est trop grande pour les méthodes manuelles.
La modélisation générale d’un réseau social est basée sur des structures de graphes. Les sommets du graphe représentent les individus et les arêtes des ac-tions différentes ou des types de liens sociaux entre les individus. Une commu-nauté est définie comme un sous-graphe (d’un réseau social) et se caractérise par des liens denses. Plusieurs mesures ont été précédemment proposées pour l’évaluation des divers aspects de la qualité de ces communautés mais la plupart d’entre elles ignorent diverses propriétés des interactions entre individus (par ex-emple l’orientation de ces liens).
Dans la recherche présentée ici, le concept de “k-core” est utilisé comme un moyen d’évaluer les communautés et d’en extraire des informations. La structure de “k-core” mesure la robustesse d’un réseau non orienté en utilisant la dégénéres-cence du graphe. En outre, des extensions du principe de dégénéresdégénéres-cence sont introduites pour des réseaux dont les arêtes possèdent plus d’informations que celles non orientées.
Le point de départ est l’exploration des attributs qui peuvent être extraits des graphes non orientés (réseaux sociaux). Sur ce point, la dégénérescence est util-isée pour évaluer les caractéristiques d’une collaboration entre individus et sur l’ensemble de la communauté - une propriété non capturée par les métriques sur les sommets individuels ou par les métriques d’évaluation communautaires tra-ditionnelles. Ensuite, cette méthode est étendue aux graphes pondérés, orientés et signés afin d’offrir de nouvelles mesures d’évaluation pour les réseaux sociaux. Ces nouvelles fonctionnalités apportent des outils de mesure de la collaboration dans les réseaux sociaux oú l’on peut attribuer un poids ou un orientation à une interaction et fournir des moyens alternatifs pour capturer l’importance des in-dividus au sein d’une communauté. Pour les graphes signés, l’extension de la dégénérescence permet de proposer des métriques supplémentaires qui peuvent être utilisées pour modéliser la confiance.
ment du graphe de manière hiérarchique, hiérarchie fournie par le principe de “core expansion sequence” qui partitionne le graphe en différents niveaux
ordon-nés conformément à la décomposition “k-core”.
Les modèles théoriques de graphes sont ensuite appliqués sur des graphes du monde réel pour examiner les tendances et les comportements. Les jeux de don-nées explorés incluent des graphes de collaborations scientifiques et des graphes de citations (DBLP et ARXIV), une instance de graphe interne de Wikipédia et des réseaux basés sur la confiance entre les individus (par exemple Epinions et Slashdot). Les conclusions sur ces ensembles de données sont significatives et les modèles proposés offrent des résultats intuitifs.
Contents
1 introduction
1
1
.1 Introduction
. . .1
1.2 Network Communities
. . .1
1.2.1 Applications
. . . 31.2.2 Collaboration
. . . 41.2.3 Degeneracy
. . . 41
.2.4 Beyond Simple Graphs
. . . 51.2.5 Extending Degeneracy
. . . 61.2.6 Degeneracy and Clustering
. . . 71.2.7 Explored Data
. . . 71.2.8 Dissertation Organization
. . . 8i
theoretical models
11
2 community evaluation
13
2.1 Introduction
. . .13
2.2 Related Work
. . .13
2.2.1 Graph Theoretic Metrics
. . . 132.2.2 Citation Graphs
. . . 172.3 Theory on Degeneracy
. . .17
2.3.1 Preliminaries
. . . 172.3.2 Cores for bipartite graphs
. . . 192.3.3 Fractional k-cores for edge-weighted graphs
. . 202
.4 D-cores
. . .23
2.4.1 Degeneracy of digraphs
. . . 252.4.2 D-core matrix
. . . 262
.4.3 An Example
. . . 262.4.4 Digraph Degeneracy Frontiers
. . . 282.4.5 Digraph Collaboration indices
. . . 302.4.6 Set frontiers and indices
. . . 322.4.7 Core Decomposition Forests
. . . 332
.5 S-cores and Reciprocity
. . .34
2.5.1 Introduction
. . . 342.5.2 S-cores
. . . 352
.5.3 Reciprocity in Signed Graphs
. . . 382.5.4 Conclusion
. . . 423 experiments
45
3
.1 Introduction
. . .45
3
.2 Undirected and Weighted
. . .45
3.2.1 Dataset Description
. . . 453
.2.2
k-cores in co-authorship graphs
. . . 463.2.3 Fractional cores on the weighted graph
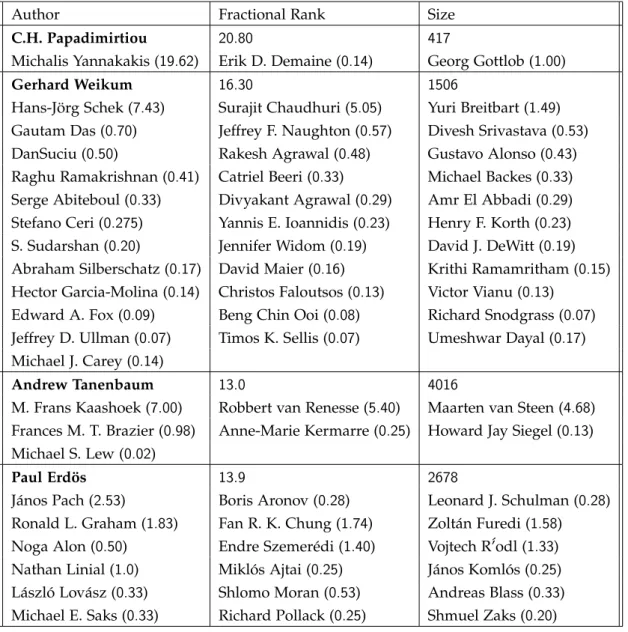
. . . 493.2.4 Rank vs size
. . . 513.2.5 Hop-1 lists
. . . 553.2.6 Community-focused rankings
. . . 573
.2.7 Core Decomposition Forest on DBLP and ARXIV
603
.3 Real World Application
. . .63
3.3.1 System Architecture
. . . 643.3.2 Demonstration
. . . 653.3.3 Application Scenarios
. . . 663.4 D-cores
. . .68
3
.4.1 Directed Graph Degeneracy for Scale-Free Graphs
683.4.2 Data sets description
. . . 743.4.3 Algorithms complexity
. . . 773.4.4 Experimental methodology
. . . 773
.4.5 Experimental results on Wikipedia
. . . 783.4.6 Experimental results on DBLP
. . . 823.4.7 Experimetnal results on ARXIV
. . . 853.4.8 Conclusions
. . . 873.5 S-cores
. . .88
3
.5.1 Datasets Description and Methodology
. . . 883.5.2 WikiSigned methodology
. . . 893.5.3 Experimental Evaluation
. . . 903.5.4 Slashdot and Epinion graphs
. . . 913.5.5 Wikipedia topics
. . . 933.5.6 Local vs. Global reciprocity
. . . 943.5.7 General Trends of Graph Reciprocity
. . . 943.5.8 Author Frontiers
. . . 973
.5.9
S-core reciprocity vs clustering structure
. . . 983.6 Conclusions
. . .100
iii
degeneracy and clustering
101
4 scaling graph clustering with the k
-core expansion sequence
103
4.2 Related work
. . .104
4.3 The Proposed Method
. . .106
4.3.1 The Framework
. . . 1074.3.2 Selection procedure
. . . 1084.3.3 Expected time
. . . 1114
.3.4 Quality of the CoreCluster framework
. . . 1114.4 Experimental Evaluation
. . .114
4.4.1 Spectral algorithm
. . . 1144
.4.2 Datasets description
. . . 1154.4.3 Time performance
. . . 1164.4.4 Clustering quality evaluation
. . . 1174.4.5 Degeneracy features vs. running time
. . . 1214.4.6 Conclusion
. . . 1245 epilogue
125
5.1 Conclusions
. . .125
5.2 Future Directions on Graph Mining and
Degeneracy
. . .126
bibliography
133
1
Introduction
1.1 introductionLarge and evolving graphs constitute an important element in current large-scale information systems. Common cases of such graphs are the Web, social networks, citation graphs, CDRs (Call Data Records) where nodes – featured with, in some cases, many attributes – are connected to each other with directed edges, repre-senting a relation such as endorsement, recommendation or friendship. The Web, social networks, and citation graphs form a context where the detection and eval-uation of communities constitutes an important and challenging task. In all cases, due to the economic significance of these networks, the ranking of individual nodes is also a necessity.
The research methods in this area have mainly capitalized on the Hub/Author-ity concepts (see [75,87]), evaluating communities based on the centrality of nodes
in terms of incoming/outgoing links. Graphs of real-world data with community structure have vertex degree with a wide range. As pointed out in [38], nodes of
low degree coexist with nodes of high degree making the graph inhomogeneous both globally and locally which usually indicates particularities in its structure, for instance, communities.
But the inherent mechanisms of community creation and evolution are not solely based on the Hub/Authority concepts. An important constituent of such a mechanism, generally neglected, is the community cohesion in terms of a dense distribution of in/outlinks within the community – as opposed to sparse con-nections across them. One of the main interests of this work is in quantifying the degree of cohesion of a community sub-graph as a measure of collaboration among its members.
1.2 network communities
Graphs representing real systems have a unique structure that displays a form of order. The degree distribution of the nodes can vary greatly and it usually follows a power law [37]. Specifically, a lot of low degree nodes coexist with a few nodes
of high degree. The same inhomogeneous pattern can be seen locally as well; there are groups of nodes displaying high concentration of connections while the
Figure 1.1: Example of a network with different communities (marked by color)[38].
groups themselves are spatially connected. These attributes are all characteristics of social networks (among other types of real networks) and are attributed as a “community structure” [41].
Community detection and evaluation is an important task in graph mining. The general idea of community detection is to identify groupings within the graph structure and possibly hierarchies of groups within them. Community evaluation aims at quantifying the “importance” of nodes (or groups of them that belong to the same community) using criteria that depend on the definition of importance (e.g. importance of influence). Community evaluation metrics can also be used in community detection as either a way to define the similarity function between nodes or as a feature to help in selecting points of interest.
But the idea of communities in graph networks has ambiguous interpretations. There is not a universal definition [38]. Here, a community is considered as a
sub-graph with much denser connections (or interactions) among its nodes than the rest of the graph. Although this is not very specific for a community detection task, the purpose of this definition is only to provide a basic and intuitive reference to the structures that will be regarded as communities.
An example can been seen in Figure1.1 where different colors represent com-munity sub-graphs of the entire network. There, the properties of “comcom-munity structure” become apparent. As the term “community” may refer to an entire net-work (e.g. the community of physicists) or a part of it (e.g. a group of scientist that collaborate often), for the rest of the document the use of this term is explicitly defined to which case it refers when needed.
1.2.1 Applications
Community detection and evaluation serve interesting real world applications. One prominent example can be seen in the area of recommendation systems. Peo-ple in a social network sharing “friendship” connections create groups. The activ-ities of some individuals in one group (e.g. purchase of a product, liking a movie) can be used as a way to predict activities that others of the same community would seek to participate.
Another example is that of data segmentation (or sharding). Social networks have increased in sizes (in terms of users) too big for single location data manage-ment. It is quite often that the need arises to partition the database containing the social network into “shards” (by database rows while trying to maintain the infor-mation of the schema within the same part) that are quite often stored in different locations. Community detection can be used to create an efficient partitioning.
Community evaluation can be viewed as an evaluation of single entities and their “role” within their community or as an evaluation of a sum of entities and their collective actions. Both situations can be used as part of the community de-tection procedure but can also serve directly application oriented requirements. A simple example would be identifying people with influence within their “envi-ronment”. While at first this appears to have a trivial solution (e.g. node of high degree) it becomes more complex when restrictions from real world applications are applied (e.g. high diversity in the groups someone belongs to).
As social networks are sometimes integrated along with reviewing systems (e.g. Epinions) or collaborative systems (e.g. Wiki platforms of information) the issue of discovering good reviewers can be seen as a community evaluation issue as well. In such scenarios one may need to evaluate either the trustworthiness of individuals or even the credibility of their collective “work”.
A need for expert consulting is needed in many small businesses (usually for a short period of time). For this need, there are on-line services (e.g. Expert Ex-change) that provide the means to contact professional with very specific technical skills. Quite often, these on-line platforms of expertise are accompanied with a so-cial network of the experts. While issues of specific nature are easy to address with such services, the need of ad doc team formation has also become frequent. Requiring a team to assist in broader issues can be also seen as a community detection problem. The benefit of knowing the underlying social network is that the choice in the list of professionals can also be assisted by their connections (through community detection and evaluation).
Community detection and evaluation methodologies are not limited to social networks. The same principles can be (and are) applied to networks of a dif-ferent context but display the same community like structure. Most networks that are associated in some way with human (inter)actions display properties of
the “community structure”. Whether it is pages of the World Wide Web, articles in Wikipedia, personal WebBlogs or just comments under a YouTube video, all of these create underlining networks that follow similar properties. In essence the same algorithmic techniques can be used to find structure that are similar throughout the different networks but with altered (depending on the situation) semantics.
1.2.2 Collaboration
An interesting aspect of social networks, highlighted by the some of the examples, is that of collaboration. Of course, collaboration is a concept not applicable to all social networks. But that is only semantics; collaboration is the process of separate entities (people, organizations etc.) working together to accomplish a task. While this is directly applicable to some social networks (e.g. social network of professionals) it can also make sense in other types of networks as well. Taking for example a group of densely connected web pages with articles one could interpret their “collaboration” as their cumulative ability to provide information on a subject.
When looking some of the examples of applications, it is obviously a necessity to be able to quantify collaboration. One may need to decide the collaborative value of an individual entity in relevance to a specific team in order to decide whether it is a “good fit”. Even the evaluation of entire communities show interest when trying to inspect whether they offer a good environment for collaboration. For example one may try to compare communities drawn from various confer-ences to see which ones have strong collaborations and therefore might offer a welcoming environment.
1.2.3 Degeneracy
The degeneracy of an undirected graph G is also known as its “k-core number”. The k-core of a graph G is the largest subgraph of G for which every node has a degree of at least k within the sub-graph. The degeneracy of a graph is the maximal value of k such that the core is not empty. In simple terms, in a k-core of a network an individual is connected to at least other k members (of the network) and those are also connected to (at least) k “neighbors” as well. The process of computing all k-cores of a graph G, for k = 1, 2, 3, . . . , kmax (where
kmaxis the degeneracy of the graph), is the called k-core decomposition.
The graph theoretic study of degeneracy and k-cores dates back to the 60’s [36, 66, 81, 85]. It has been used to understand various properties of random graphs
eval-uating and detecting strongly cohesive communities in real-word graphs [2,3,8, 11, 20, 90]. The k-core decomposition process has also been used to provide an
approximation algorithm for the dense subgraph problem [5,50].
One of the main benefits of the k-core structure is the efficiency of the algo-rithms for computing a k-core. For graph G, all that is needed is to recursively remove the vertices (which represent nodes of the modeled network) that have a degree lower than k. Once a vertex is removed all of its connections are removed as well. The running time of this process can be proportional to the number of edges (the connections of the network) of the graph [13].
1.2.4 Beyond Simple Graphs
Degeneracy has been defined and explored on simple undirected graphs. For real networks this simple representation bears the semantic of an equal and symmetric relationship (e.g. two people being friends). This representation is not sufficient in the study of a more complex context of connections that may have:
• Weight: Weight can represent the strength of the relationship. For example the weight of a professionals’ social network could indicate the frequency two of them work together.
• Direction: Directed networks have become most prominent, but not limited, in the online environment of the world wide web. Some examples are web sites linking to one another, social networks of users following posts in mi-crobloggs, networks formed by on line voting/liking and citation networks. This directionality is obviously necessary in the corresponding graphical model. For instance, one could compare social networks of friendship with microblogging social networks. On one, friendship is in both directions and therefore unidirectional in the corresponding graph model. On the other, not including the direction would make the statement "A follows microblogg of B" equivalent to the exact opposite.
• Labels: Labeling a connection creates entirely new contexts (depending on the label). One example is that of the “ trust” concept in social networks. Practically, there are two ways to treat labels, one is to assume them as separate entities and essentially interpret the entire modeled network as an overlap of many networks with the same nodes. The other is to map the labels into weights (e.g. in the case of trust integer values: 0 & 1 or −1 & 1). Choosing either way depends on the reason for modeling the network.
1.2.5 Extending Degeneracy
The work presented here starts with community evaluation, based on the k-core concept, as a means of evaluating collaborative nature of individuals in networks modeled by simple graphs. The vertices of a graph G represent a set of entities and its edges represent collaboration links between them, thus a core of high value for k (or simply a high index core) in a graph G can be seen and treated as a community of entities that demonstrates a strong collaboration between them.
Building upon the findings of the previous, extensions of the k-core concept are introduced. These extensions aim at introducing degeneracy to the more complex graph structure cases mentioned above. Along with the extensions, interesting metrics and ways to visualize graph structure arise. The extensions are utilized for the evaluation of collaboration (and trust) under weighted, directed and labeled graphs. Specifically:
• Fractional k-cores are defined for edge-weighted graphs. This new concept displays interest in both theory and practice and the necessity of this ex-tension is displayed by evaluating the same network under the two struc-tures (k-cores and the fractional extension) and comparing the resulting subgraphs.
• The theoretical framework of cores is vastly extended to the case of directed graphs. Such graphs emerge naturally from social/citation networks and the Web. D-cores constitute dense directed sub-graphs of the original one involving intensive and mutual collaboration in terms of directed links. In-terestingly, all these notions induce a 2-dimensional setting indicating quali-tative differences for the directed case and are later employed and visualized during experimentation.
• Based on the D-core extension, new structures and metrics are defined for the evaluation of the collaborative nature of directed graphs. Namely, such are the D-core matrix for a graph, its frontier, and a series of novel metrics to evaluate:
a. the robustness of the directed graph under degeneracy, as a metric of
cohesiveness and hence the collaboration among the members of the graph under study and
b. the dominant patterns of the graph with respect to the inlink/outlink
trade off indicating macroscopic graph patterns related to whether the graph is extrovert or “selfish”.
• Finally, cores on signed graphs (that model trust networks) are defined for the evaluation of trust (S-cores). As this extension can not be compared with
existing metrics, existing metrics are also redefined (extended) in parallel for trust networks. The signs on the edges of the graph are treated as labels and this creates a much richer setting for experiments and the interpretation of their results. Additional metrics -based on theS-core- are defined here as well for both individuals and entire network communities.
Moreover, as the graphs that are explored are in the size of millions (of members), the core decompositions (k, fractional, Dand S) are used as a structure to build interesting visualizations and management tools for such large graphs.
The core concept, all of its extensions and the relevant structures and metrics, which are defined throughout this work, constitute a framework of tools for effi-cient and valid evaluation of cohesiveness and collaboration in directed networks and of trust in signed.
1.2.6 Degeneracy and Clustering
Graph clustering or community detection constitutes an important task for inves-tigating the internal structure of graphs, with a plethora of applications in several diverse domains. While the main focus of this work was a direct use of degeneracy for evaluating collaborative behavior, the application of degeneracy in graph clus-tering is also investigated. Traditional tools for graph clusclus-tering, such as spectral methods, typically suffer from high time and space complexity. The last part, of the work presented here, is CoreCluster, an efficient graph clustering framework based on the concept of graph degeneracy, that could be used along with any known graph clustering algorithm.
The approach capitalizes on processing the graph in a hierarchical manner pro-vided by its core expansion sequence, an ordered partition of the graph into dif-ferent levels according to the k-core decomposition. Such a partition provides a way to process the graph in an incremental manner that preserves its clustering structure, while making the execution of the chosen clustering algorithm much faster due to the smaller size of the graph’s partitions onto which the algorithm operates. It is proven experimentally on a multitude of real and synthetic graphs that this approach accelerates systematically the clustering process by orders of magnitude, especially as the graph’s size increases, while the quality of the clus-tering results is not compromised or even is improving.
1.2.7 Explored Data
Three types of graph data are explored with degeneracy: a. undirected social structures, b. directed social and web structures and c. trust networks. A brief description of these follows next.
1.2.7.1 Undirected Graph Data
Experiments are mainly dealing with two undirected graph datasets: the DBLP bibliographic dataset and the ArXiv on High Energy Physics - Theory ( ArXiv.hep-th). Both networks can be seen as bipartite graphs of author entities being con-nected with paper entities. A transformation of the bipartite graphs into collab-oration networks (between authors) is the final model; upon which an extended experimental evaluation studying in depth the core subgraphs is performed, both integer and fractional, of their edge-weighted co-authorship connections.
1.2.7.2 Directed Graph Data
Large scale experiments are also conducted in the following directed graph data: • A snapshot from the (English) Wikipedia in 2004. There the underlying graph
is that of the network Wikipedia articles create by linking to one another. • Citation graphs from DBLP and ArXiv. These graphs are created from the
aforementioned data. In this instance thought, citations from one paper to another create directed connections between their authors.
• Scale-free/preferential attachment synthetic graphs, generated by well es-tablished procedures/algorithms, are used to compare the behavior under degeneracy of real world datasets vs generative models.
The different type of networks (first two) explored here are used to display the diversity of applications the methods established in this work can be applied to.
1.2.7.3 Signed Graph Data
As signed graph data, trust networks were used where one expresses his judg-ment of trust/distrust towards the actions of another. Experijudg-ments were per-formed on the explicit signed graphs (Epinions and Slashdot). The term “explicit” is used to signify that the relations from members of these networks were direct ac-tions of trust/distrust through mechanisms offered by each platform (voting). In the opposite side, inferred networks from Wikipedia were used as well. These net-works were inferred from interactions of users upon the editing platform Wikipedia offers (i.e. deleting content, creating new, correcting etc.).
1.2.8 Dissertation Organization
The rest of the document is organized in three parts:
1. Theoretical Models. This section will begin with presenting all the related work on the subjects that will be addressed through degeneracy. While de-generacy is the main focus, other aspects of graph mining will be mentioned
in this part for a complete picture. Continuing, the footing will be set -through the basic definitions of the k-core structure and decomposition- for the proper presentation of the theoretical aspects for the degeneracy exten-sions introduced in this work. Moreover, additional metrics and structures will be defined along with an intuitive explanation of their interpretation. Such (metrics and structures), will be the collaboration index, the decompo-sition forest, the D-core matrix and others with main focus targeted at the evaluation of collaboration.
2. Data Exploration. The aforementioned data will be explored in this section with the appropriate degeneracy methodologies. Structures defined in the previous section will be presented on large scale real graphs. Through this study the new concepts will display interesting results thus establishing not only the theoretical but also the practical potential of the proposed models. Moreover, a demonstration will be shown for potential applications of this work.
3. Degeneracy and Clustering. This section inspects degeneracy’s potential use in graph clustering. While many indications about the implication of degeneracy in graph clustering will be also made at the previous section, in this one degeneracy is directly used as a heuristic to improve the compu-tational cost (in running time) of a highly complex algorithm (specifically spectral clustering). This is done to demonstrate the well diverse use of de-generacy. The experiments contacted here are in both synthetic and real datasets and display very good results.
2
Community Evaluation
2.1 introductionBefore presenting the graph theoretic extensions of k-cores, the related work on community evaluation measures must be introduced. This section presents related work on such metrics for individuals and entire (sub)networks and foundational work of degeneracy. Moreover, work on signed networks and theoretic models of trust is also presented.
2.2 related work
Related work on community detection is reserved for the last part of this doc-ument. For reference, a thorough review on community detection in graphs is offered by Fortunato in [38]. In that work techniques, methods, and datasets are
presented for detecting communities in sociology, biology and computer science, disciplines where systems are typically represented by graphs. Most existing rele-vant methods are presented, with a special focus on statistical physics, including discussion of crucial issues like the significance of clustering and how methods should be tested and compared against each other.
2.2.1 Graph Theoretic Metrics
Studying the general behavior and properties of real graphs, both edge-weighted and unweighted, is the subject of [68] where a pattern on the behavior of
con-nected components over time is observed and, upon that, a generative model is build.
In recent literature, various metrics are proposed relevant to the graph structure of a social network. Such are “Betweenness” [87], “Centrality" [75], and
“Cluster-ing coefficient” [88] (a measure of the likelihood that two associates of a node are
associates themselves).
Clustering coefficient can been seen both as a metric to evaluate single nodes and the entire network:
• The clustering coefficient of a vertex (that represents a network node) is the ratio of links the vertex has with other vertices to the total number of links that could exist between between them. For simplicity, this is referred as “local clustering coefficient”.
• The clustering coefficient of an entire network is the average of the local one over all vertices.
A higher clustering coefficient indicates a greater “cliquishness”, i.e. cohesion de-gree or density. Centrality is a more general term (which can include between-ness):
• Degree centrality is a more accurate term when referring to centrality as an evaluation metric. This is essentially the degree of a vertex.
• Closeness centrality is a notion that is connected to the “farness”/“closeness” of a node to other nodes. The measurement of those two concept is a func-tion over the sum of distances between a node in the network and the rest (of the nodes). This function has many definitions from a simplistic one (only the sum) to more complex for specific applications [26]
• Betweenness centrality (or just betweenness) measures the number of times a node of a network is on the shortest path between two other ones [33].
• Of special interest here is the eigenvector centrality – a measure of the im-portance of a node in a network. It assigns relative scores to all nodes in the network based on the principle that connections to nodes having a high score contribute more to the score of the node in question. PageRank can be considered a form of eigenvector centrality [74].
Other interesting measures include “path length" (i.e. distances between pairs of nodes in the network), and “Structural cohesion" - the minimum number of members who, if removed from a group, would disconnect the group [71].
In [52] an alternative “core notion” is considered for the case of directed graphs
where a core is seen as a complete bipartite graph where all edges are directed from the one part to the other. In [52], such cores are detected and are then fed to
a generalized HITS algorithm used to expand the communities within them. Within the work presented here, a direct comparison of degeneracy and reci-procity will be made for signed networks. The basic definition of recireci-procity is a local property based on mutuality in pairs of nodes in directed graphs [69,82,87]:
r≡ L
↔
where L↔ is the number of links pointing in both directions and L is the total
number of links. Thus, the highest value of r is 1, when the network is fully bi-directional, and the lowest is 0 when the network is completely unidirectional.
Reciprocity is used to examine directed networks of various kinds [40, 69,82],
an extension for weighted networks is in the recent work of [1]. In [40], reciprocity
is extended in order to take into account the density of the network.
2.2.1.1 Signed Networks
In the area of signed graphs, a machine learning-based approach for inferring negative or positive links in Epinions was published in [60], whose techniques
rely on an existing signed network complemented by user interactions. In [64], a
signed network over the editors of the Wikipedia, denoted Wiki-Signed, is inferred exclusively from interactions; it is evaluated, at both local and global level, in rela-tion with social theories and existing signed networks on the Web. We rely in this paper on networks built as in [64]. Another approach for detecting positive and
negative interactions in Wikipedia was presented in [18], showing the emergence
of polarization in Wikipedia articles.
Several papers have also studied the prediction of links and link signs, when only the signed network is known, a problem also known as trust propagation. The first rigorous treatment of this problem is given in [43], where the authors
define four atomic operators to predict link signs (direct propagation, co-citation, transpose trust and trust coupling). This approach was extended in [56,57], where
trust propagation was studied through the lens of social theories such as balance and status, and a prediction model based on the number of triangles involving each candidate link was proposed.
For undirected signed graphs, the theory of Social Balance [6] is a model for the
dynamics of friendship and enmity through time. The weakness of this model is that it assumes that all relationships are reciprocal. A more advanced model called Status Model is introduced in [43] and elaborated in [56]. The advantage of this
model is that it takes into account the direction of the relationships but it is built upon the structure of triangles within the graph. The main point of this model is that a directed signed edge signifies someone of either higher or lower status and thus predicts that the flipping of a direction should flip the sign as well. But this would not account for the relationships of trust (that we attempt to study). In principle (and shown by the experimental results), it is counter intuitive to assume that showing trust or distrust to others would lead to the opposite assumptions of others to us.
Recently, the problem of ranking vertices in signed networks has been studied in [27, 70]. This problem is challenging, since power iteration methods used for
scores. The PageTrust algorithm, extending the ubiquitous PageRank algorithm to handle also negative links, has been proposed in [27]. An algorithm that uses a
signed network to derive two scores for each vertex, called prestige and bias, has been presented in [70].
2.2.1.2 Cores
The k-cores are fundamental structures in graph theory and their study dates back to the 60’s [36,66,81,85]. A k-core of a graph G is the maximum subgraph H of G
where each vertex in H has at least k neighbors in H. The degeneracy of a graph is defined as the biggest k for which a graph contains a non-empty k-core [59]. The
same notion has appeared with several names such as width [67], linkage [39, 49],
or coloring number [28] and has been proven to be equal to the smallest k for which
we can find a linear ordering of the vertices of the graph such that for each vertex v, the number of its neighbors that appear before v in the ordering is at most k (see [39,59,66]).
The existence of k-cores of large size in sufficiently dense graphs has been theoretically studied by [76] for random graphs generated by the Erd˝os-Rényi model [35]. As shown in [76], a k-core whose size is proportional to the size of G
(i.e. a “giant” k-core) “suddenly” appears in a random graph with n vertices and m edges when m reaches a threshold ck· n, for some constant ck that depends
exclusively on k. Also, it was proved in [15, 61] that, in the Erd˝os-Rényi model,
almost all k-cores are k-connected (see [46] for more recent results on this topic).
An efficient algorithm for the computation of the k-core of a graph was given in [13] and its running time is proportional to the number of edges of the
in-put graph. Actually, the algorithm in [13] can compute the core decomposition of a
graph consisting of the sequence of all the non-empty i-cells of G where each i-cell is defined as the vertices contained in the i-core but not in the (i + 1)-core. Core decompositions provides useful information on the way subgraphs of a graph are clustered according to their degrees and has been used extensively in several topics such as the study of internet topology [3, 20], large scale network
visual-ization [2, 3, 11], networks of protein interaction [8, 90], and complex network
modeling and organization [14, 30]. A more general notion of k-cores was
intro-duced in [12] where, instead of vertex degrees, more general functions where
considered.
In [21], greedy approximation algorithms are proposed for finding the dense components of a graph. Both undirected and directed graphs are examined. In the case of directed graphs the vertices are divided into hubs (S) and authorities (T). Then, based on a value of |S|/|T|, a greedy algorithm removes the vertex of minimum degree from either S or T until both sets are empty. Also, in [84], the
subject of finding dense subgraphs, based on query nodes, is studied, where the issue is to find a community that contains certain given nodes.
2.2.2 Citation Graphs
The experiments, that will be presented in the next part of this document, focus partially on applying our evaluation techniques on citations graphs (DBLP, ArXiv). Recent work on citation graphs can be found in [4] where a study is carried out
on the citation graph of Computer Science Literature and [47]. In [4], an attempt
is made to extract a descriptive summary of the graph through a study of funda-mental and well established properties (degree distribution, giant component size etc.). In contrast, our work focuses on novel techniques for evaluating community graphs and expands on a wider scope of study. In [47] the focus is on community
detection and the evolution through time. The community detection is performed on the authors through the papers they have co-cited and the evaluation of the citation graph is based on the detected clusters.
2.3 theory on degeneracy
2.3.1 Preliminaries
As degeneracy for undirected graphs will only be explored on bibliographic datasets, some of the following definitions refer specifically on network structures formed by authors collaborating (or not) on the work of a published paper.
For the basic definition of degeneracy, graphs are considered undirected and simple (i.e. they do not have multiple edges or loops). The vertex and the edge set of a graph are denoted by V(G) and E(G) respectively. The cardinality of V(G) will be referred as the size of G. Moreover, edge-weighted graphs (or, simply weighted graphs) are denoted by pairs (G, w) where w is a weighting function assigning rational numbers to the edges of G.
A graph H is a subgraph of a graph G if H occurs from G after removing vertices or edges (the removal of an edge implies the removal of all edges that are incident to it). A graph is connected if for every pair of its vertices there is a path connecting them. A connected component of a graph is a maximal connected subgraph of it. Given a graph G, the size of the largest connected component of Gis denoted by g(G) and it is called giant component.
Definition 1. Given a vertex v ∈ V(G), the degree of v in G is the number of edges that are incident to it. Also, δ(G) denotes the minimum degree of a vertex in G. The degeneracy of a graph G is defined as follows:
δ∗
Definition 2. Given a graph G and a non-negative integer k, the k-core of G is defined
as the maximum size subgraph H of G where δ(H) > k. It is easy to see that such a subgraph is unique. Given a k-core, k is referred as itscore index or simply index.
Assume that for i = 0, . . . , δ∗, G
i is the i-core of G. Then the sequence
V(G0), V(G1), . . . , V(Gδ∗(G))
is called core sequence of G.
Observe that V(Gi)⊆ V(Gi+1)for i ∈ {0, . . . , δ∗(G) − 1}.
Additionally, the sequence:
V(G1) − V(G1), . . . , V(Gδ∗(G)) − V(Gδ∗−1)
is called cell sequence of G and its elements form a partition of V(G).
Definition 3. For every graph G where δ∗
(G) = k, its core expansion sequence is defined as the sequence of vertex sets {Vk, Vk−1, . . . , V0} that is recursively defined as follows:
Vk= V(corek(G)) and
Vi= V(corei(G)) \ Vi+1, i = k − 1, . . . , 0.
(2.3)
The sets of a core expansion sequence are also refered aslayers agreeing that the set Viis
its i-th layer.
2.3.1.1 The Trim Procedure
Notice that, for each i 6 j, the j-core of a graph is a subgraph of its i-core. Fur-thermore, the degeneracy of a graph is the maximum k for which G contains a non-empty k-core. Given a graph G where δ∗
(G) = d and an integer i where 0 6 i 6 d, the i-core of G is denoted by Giand the core sequence of G is defined as
G(G) = G0, G1, . . . , Gd , where G0 = Gand Gdis the densest core of G. For every
i > 0, the graph Gi+1can be computed by the following simple procedure.
Procedure Trim(G, k)
Input:An undirected graph G and a positive integer k Output:the (k + 1)-core of G
1. let F := G
2. while there is a node x in F such that degF(x) 6 k 3. deletenode x from F
4. return F
The Trim(G, k) procedure runs in O(kn) steps, thus computations are feasible even in large scale graphs [13]. Applying successively Trim(G, i), for i = 0, . . . , δ∗(G) − 1,
gives a fast way to compute the core sequence of G. In fact an optimal implemen-tation of the above pruning procedure that is able to produce the core sequence of a graph in O(δ∗
(G)· n)steps and been given in [13]. The procedure in [13] works
for much more general variants of the core notion, including the fractional core notion that will be defined later in this section.
Definition 4. Thecore index of a vertex v of G is the maximum k for which v belongs in the k-core of G.
Notice that one may also define the core index of a set S of vertices in G as the maximum k for which all vertices of S belong in the k-core of G [12]. It is easy to
see that this number is the minimum core index of all the vertices in S.
2.3.1.2 Core Decomposition Forest
In this section, the Core Decomposition Forest is defined for the case of the undi-rected cores (weighted or not). For the diundi-rected case, an almost identical definition will be in the sections that follow.
Definition 5. Let G = G0, G1, . . . , Gd be a sequence of graphs such that for each i, j
where i 6 j, Giis a subgraph of Gj(such a sequence is calledmonotone). The
Decompo-sition Forest of a monotone graph sequence G is the graph DF(G) that is defined as follows. For each i = 0, . . . , d, the connected components of Giare denoted by G1i, . . . , G
mi
i and
each such connected component is a vertex of DF(G) (the isomorphic graphs are treated here as different graphs). The pair (Gji, Gj′
i′) is a directed edge of DF(G) if j ′
= j + 1 and Gjicontains Gji′′ as a subgraph.
It is easy to verify that the directed graph defined above is a rooted forest. In fact, each of its components is a rooted tree where all its edges are directed away from the root and each root is a connected component of G0. Given that the core
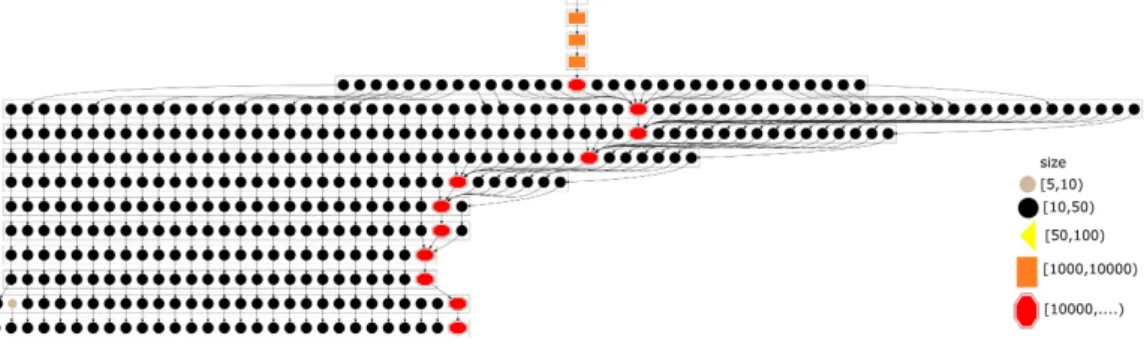
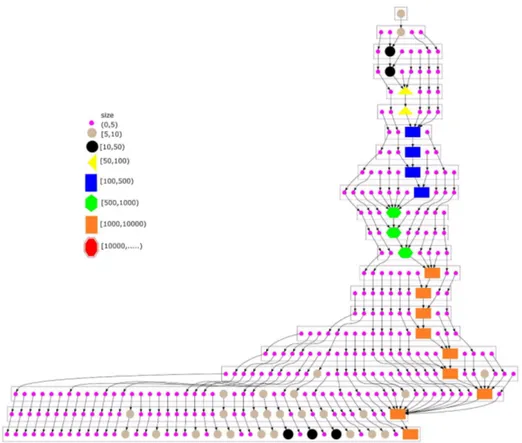
sequence of G is monotone, the Core Decomposition Forest of a graph (edge-weighted or not) is defined as the decomposition forest corresponding to its core sequence. The notion of the core decomposition forest appeared for the first time in [44] under the name hierarchical degree core tree and was used in order to
visu-alize the connected components of several real-word graphs including the graph extracted by the common-author relation of the papers of the DBLP citation graph. As the graphs that are extracted from DBLP and ARXIV are expressing relations between authors, the core decomposition forests that are described and presented in the second part are of radically different nature than the one extracted in [44].
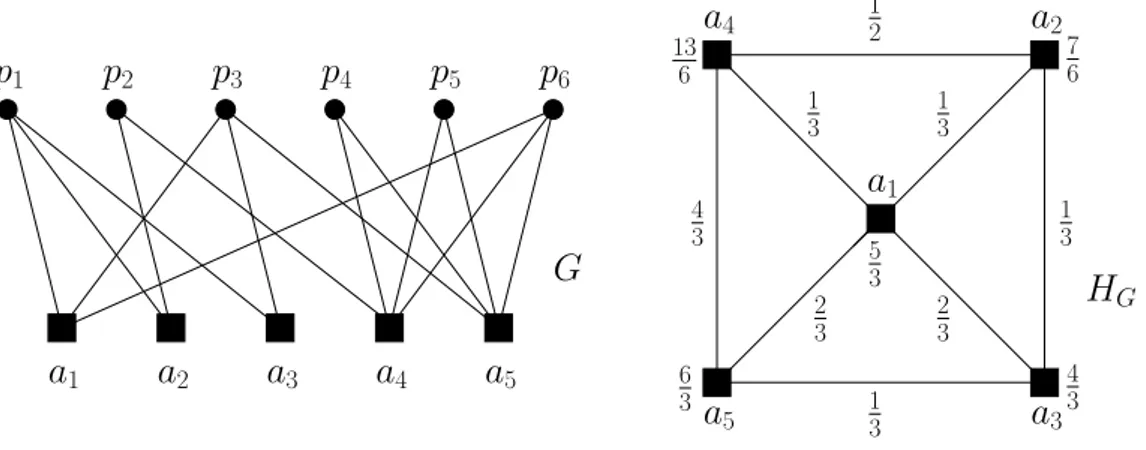
2.3.2 Cores for bipartite graphs
A great part of the datasets (the bibliographic ones e.g. DBLP), that are studied here, are represented by bipartite graphs where edges denote relations between
papers and authors. Such a graph is denoted by G = (A, P, E) where A is the set of authors, P is the set of papers, and E is a set of edges. Each edge {x, y} (where x ∈ A and y ∈ P) expresses the fact that x is one of the authors of paper y. As the aim is to evaluate the collaboration between authors, a restriction is applied to the study of papers that are written by at least two authors, i.e., there is an assumption that all the vertices in P have degree of at least two.
Definition 6. Theco-authorship graph corresponding to G is defined as follows:
HG = (A, {{x, x′} |∃y ∈ P : {x, y}, {x′, y} ∈ E), (2.4)
i.e., two authors are adjacent if they appear as co-authors in at least one paper. Notice that the above definition of HG is radically different from the one used
in [44], where they study graphs whose vertices correspond to authors and edges
indicate joint publications between two authors. In fact, the construction in [44]
can be seen as being the dual of the one used here for creating HGin the sense of
vertex-edge duality of hyper-graphs.
For each dataset (represented by a bipartite graph G), the δ∗
(HG)is computed
along with the core index of each vertex/set of vertices in HG in order to
eval-uate the collaboration behavior in the bipartite graph G and the dataset that it represents. The idea of this criterion is to locate communities of authors with a high collaboration between them in the sense that the demand is not just so that they have authored many papers but also that they have all authored them with authors in the same community.
However, this is not an entirely satisfactory evaluation, since the number of authors on a paper has no impact in this measure. For this reason, below is in-troduced a more refined way to define cores based on the notion of a fractional core.
2.3.3 Fractional k-cores for edge-weighted graphs
Continuing with the papers-authors paradigm, let G = (A, P, E) be a bipartite graph where all vertices in P have minimum degree of 2. Given an author vertex x∈ A, the neighborhood NG(x) of x is defined as the set containing each paper
y∈ P for which {x, y} ∈ E, i.e., NG(x) is the set of papers co-authored by x. The
neighborhood NG(y) of a paper y ∈ P can be defined in a symmetrical manner,
i.e., the set of the authors of paper y. Also, given an author x, the set of all edges that are incident to x in G is denoted by EG(x). In what follows, Q+ denotes the
set of all non-negative rational numbers.
Definition 7. Given a bipartite graph G = (A, P, E), the definition of the edge-weighted
p
5a
1a
2a
3a
4a
5p
1p
2p
3p
4p
6a
1a
4a
2 1 3 1 3 2 3 2 3 1 3 1 2 1 3a
5a
3 4 3 7 6 4 3 5 3 13 6 6 3G
H
GFigure 2.1: An example of a bipartite graph G and its edge-weighted co-authorship graph,
(HG, w).
up a rational weight function w : E → Q+ on the edges of HG is as follows: For every
edge e = {x, x′ } we set w(e) = X y∈NG(x)∩NG(x′) 1 NG(y) . (2.5) Notice that,P
e∈HGw(e) = |V(P)|, i.e. the sum of all the weights on the edges
is the size of the graph, i.e., the number of its vertices. For example, in Figure2.1, in order to compute the weight of the edge e = {a1, a3}, one should observe that
the authors a1 and a3 are co-authors of the papers p1 and p3. As p1 and p3
have 3 authors each, they contribute 1/3 to the weight of e, that is w(e) = 2/3. This weighting of e expresses the fact that the collective effort of author a1 to the
papers he/she co-authored with p3 is of 2/3 papers, and vice versa.
As agreed before, the notation (G, w) for the graph G is used to denote that it is edge-weighted by w.
Definition 8. Given an edge-weighted graph (G, w) and a vertex x ∈ V(G), the
fractional-degree of x in (G,w) is defined as
degG,w(x) = X
e∈EG(x)
w(e). (2.6)
In the co-authorship context, the degree degG,w(x) of an author x is the collective effort of author x for all the papers she/he wrote. For instance, in Figure2.1, the degree author a4is the sum of all the weights of the edges that are incident to it, i.e., 1/3 + 2/3 + 4/3 =
A graph (H, wH) isan edge-weighted subgraph of (G, w) if H is a subgraph of G
and wHis the restriction of w on E(H). Given any such subgraph (H, wH) of (G, w), we
define
δ(H, wH) =min{degH,wH(x) | x∈ V(H)}. (2.7)
For example, if (G, w) is the edge-weighted graph in Figure2.1, then δ(G, w) =
degG,w(a2) = 7/6. If H is the subgraph of G containing all edges that are incident
to the vertices a1, a2, and a4, then δ(H, wH) = degH,wH(a1) = 2/3.
Definition 9. Let (G, w) be an edge-weighted graph. The fractional-degeneracy of
(G, w) is defined as follows:
δ∗(G, w)=max{δ(H, w
H) | (H, wH)is a non-empty
edge-weighted subgraph of (G, w)}. (2.8)
Let k ∈ Q+. Then the k-core of (G, w) is the maximun-size edge-weighted
subgraph (H, wH)of (G, w) where δ(H, wH) > k.
The Trim procedure can also compute k-cores where k is a rational number. The only modification, in the Trim algorithm presented in subsection 2.3.1.1, is that degF(x) 6 k should be replaced by degF,wF(x) 6 k, i.e., the Trim procedure for fractionally weighted graphs would check the fractional degree of x in the edge-weighted graph (F, wF), where wF is the restriction of w to the edges of F.
In fact, the definition of the fractional analogue of the core sequence requires more attention, as it now should be indexed by rational numbers. For this, con-sider the infinite sequence G = Gh0, Gh1, . . . , recursively defined as follows:
Gh0= G, h0 = 0, and for i > 0, Ghi = T rim(Ghi−1, hi−1)where hi= δ(Gi, wGi).
Then, the fractional core sequence of an edge-weighted graph (G, w) is the prefix of Gthat contains all non-empty graphs of G and is denoted by G(G, w). The size of a fractional core sequenceis the number of its terms minus one. Notice that the size l of the fractional core sequence of an edge-weighted graph (G, w) can never exceed the size of G. Finally the sequence h1, . . . , hl is called fractional index sequence of
(G, w).
The fractional core index of a vertex of an edge-weighted graph (G, w) is the maximum rational number k for which v belongs in the k-core of G. As in the unweighted case, the fractional core index definition can be naturally extended to sets instead of vertices. Again the fractional core index of a set of vertices is the minimum fractional core index of its members.
As an example of the above definitions, the edge-weighted graph (HG, w)
de-picted in Figure 2.1, has fractional degeneracy 7
6, i.e. δ(HG, w) = δ ∗
(HG, w).
removal drops the fractional degrees of a1, a3, and a4 below 73. Therefore, they
are also removed and, for the same reason, the remaining vertex a5 is removed as
well. Therefore, G1 is the empty graph, the fractional core sequence contains only
graph G0 = G, and the length of the fractional index sequence of (HG, w) is 0. A
mention should be made that a less trivial example would be too complicated to present in a figure and even more complicated to be processed by the reader.
At this point it is important to stress that, as a graph-theoretic notion, frac-tional cores are defined on bipartite graphs, encoding relations between two sets representing different entities (in this case, papers and authors). Equivalently, frac-tional cores can be defined in hypergraphs by considering the fracfrac-tional cores of their (bipartite) incident graphs. In this case, the hypergraph corresponding to the graph G would contain the authors as vertices and the papers as hyperedges. In the work presented here it was chosen to avoid hypergraph notation and, for simplicity, the definition that uses bipartite graphs was adopted.
2.4 d-cores
Let D = (V, E) be a digraph that is a set V of vertices and a set E of directed edges between them. Each edge e ∈ E can be seen as a pair e = (v, u) where v is called the tail of e while u is the head of e. The set of vertices of a digraph D is denoted by V(D). Given a vertex x ∈ V, its in-degree, which is denoted by deginD(x), is the number of in-links of x, i.e. the edges in D with x as a head. Similarly, the out-degreeof x, denoted by degoutD (x), is the number of out-links of x, i.e. edges in
D with x as a tail. The min-in-degree and the min-out-degree of a digraph D are defined as
δin(D) =min{x | deginD(x) | x∈ V(D)}and
δout(D) =min{x | degoutD (x) | x∈ V(D)} (2.9) respectively. Given two positive integers k, l and a digraph D = (V, E), a (k, l)-D -coreof D is a maximal size sub-digraph F of D where δout(F) > kand δin(F) > l; if no such digraph exists then the (k, l)-D-core of D is the empty digraph. It is easy to see that when such a sub-digraph exists, it is unique.
Given a digraph D, the (k, l)-D-core of D is denoted by DCk,l(D). Additionally, dck,l(D) denotes the size of DCk,l(D), i.e. the number of its vertices. As D will
always be the network under study, the simpler notations DCk,land dck,lwill be
used instead.
The intuition behind (k, l)-D-cores is to find a sub-digraph where all nodes have enough out-links and in-links to the rest of it. Clearly, it is not enough for a node to have big in-degree and/or out-degree in order to be a member of such a core. What counts, on the top of this, is that the node forms part of a community where
Figure 2.2: Two portions of a digraph. The one in the left does not contain any non-trivial (k, l)-core and the one in the right is a (2, 2)-core.
each of its members satisfy the same in-degree and/or out-degree requirements with respect to all the other community members (see Figure2.2for an example). This indicates that nodes in aD-core exhibit a strong collaboration behavior among them.
The detection of DCk,lis computationally easy and can be done by altering the
original Trim procedure (subsection2.3.1.1) thus having the following: ProcedureTrimk,l(D)
Input:A digraph D and positive integers k, l
Output: DCk,l(D)
1. let F ← D.
2. while there is a node x in F such that degoutF (x) < k or deginF(x) < l,
3. deletenode x from F.
4. return F.
Let L = (v1, . . . , vm) be a layout of the vertices of D. For every i = 1, . . . , n,
Di denotes the digraph induced by the vertices in {v1, . . . , vi}. The layout L is
(k, l)-eliminable if for every i ∈ {0, . . . , n}, either degoutDi(vi) < kor deginDi(vi) < l.
The following Lemma on (k, l)-D-cores generalizes the classic min-max result of [67] (see also [39,49]).
Lemma 1. Given a digraph D and two positive integers k and l, the (k, l)-D-core is empty if and only if there exists a (k, l)-eliminable layout of V(D).
Lemma1 essentially indicates that the elimination procedure of the algorithm
Trimk,l(D)works correctly and (optimally) runs in O(m) steps, where m = |E(G)|.
The proof is easy and follows the arguments of [39] for the undirected case (see
also [12]).
For an optimal implementation of the Trimk,l(D) procedure, see the general
algorithm of [12] that is based on the same ideas for the undirected case. In the implementation of this procedure, DCk,l(D) is incrementally computed for all
2.4.1 Degeneracy of digraphs
The degeneracy of a directed digraph differs radically from its undirected counter-part. Actually, it has a two-dimensional nature since different choices of the lower bounds to the number of incoming/outgoing edges result to differentD-cores. Definition 10. Thedegeneracy of a digraph D is defined as follows.
δ∗(D) = 1 2max{δ
out(H) + δin(H) | H⊆ D}. (2.10)
The intuition behind the definition of δ∗
(D) is to return the maximum r (for some pair k, l where k + l > 2r) such that D contains a non-empty (k, l)-D-core (δ∗ takes semi-integer values). Also the value of δ∗
(D) may correspond to multiple (k, l)-D-cores for different choices of k and l (those where k + l = 2 · δ∗(D)).
Notice that if each edge of a graph is replaced by two opposite direction edges, the degeneracy of the resulting digraph is equal to the degeneracy of G. Thus δ∗
is indeed a valid generalization of undirected degeneracy to directed graphs. It is important to stress that δ∗ is the first density parameter on digraphs that
takes into account Hub/Authority trade offs as it differs radically (and is not com-parable) with previous digraph density measures such as the ones defined in [21]
and [52]. A powerful extension of the classic notion of a k-core was given in [12] where the k-core is defined as a set of vertices where some general vertex property function is bounded. While the results in [12] can also provide a natural concept
of k-core for directed graphs, they are not able to capture the “two-dimensional” nature of our (k, l)-core concept where degree bounds are applied simultaneously on both the in-degrees an the out-degrees.
Definition 11. Let τ be a real number in the interval [0, π/2] representing an angle. The
τ-degeneracy of a digraph D is defined as follows:
δ∗
τ(D) =max{
⌈k⌉ + ⌈l⌉
2 | G contains a non-empty (k, l)-D-core where k = r·cos(τ) and l=r · sin(τ) for some r where r2 = l2+ k2}
(2.11)
In the above definition one may see each pair (k, l) as a point of a Cartesian sys-tem of coordinates, corresponding to theD-core DCk,l(D). To compute δ∗τ(D), we
essentially follow the τ-slope segment starting from (0, 0) until DCk,l(D)becomes
empty along this line. The last such non-emptyD-core is the one determining the degeneracy of D with respect to the angle τ. The value of τ reflects the Hub/Au-thority trade-off in the consideredD-cores and we refer to it as H/A-angle.
Again it is easy to observe that δ∗
π/4 deteriorates to classic degeneracy when
Observe that δτcan also provide an another definition of δ∗, equivalent to the one
in (2.10), as δ∗
(D) =max{δ∗
τ(D) | τ∈ [0, π/2]}.
2.4.2 D-core matrix
The objective of this work is to define a series of digraph-based metrics, based on directed degeneracy, in order to evaluate the dense collaboration of nodes in networks whose links have directional nature. The whole network is represented by a digraph D and there is a unique DCk,lfor each k, l > 0.
Definition 12. The sizes dck,l, (for k, l > 0) define an (infinite) matrix AD= (dck,l)k,l∈N
that is calledD-core matrix of D. The notion of AD(k, l) is the two-dimensional digraph analogue of the notion of core sequence defined in Subsection2.3.1for the undirected case.
For each k, l > 0 the following is defined:
DCLoutk,l= V(DCk,l) − V(DCk+1,l)and
DCLink,l= V(DCk,l) − V(DC1,l+1).
(2.12)
Also, set :
dcloutk,l = |DCLoutk,l|and
dclink,l= |DCLink,l|. (2.13)
In other words, the values of DCLoutk,land DCLink,lrepresent the “differential” of the of the matrix AD taken in both horizontal and vertical direction. For this reason,
the matrices ∂outA
D = (dcloutk,l)k,l∈N and ∂inAD = (dclink,l)k,l∈N are defined. To
visualize them, one may see the values of ADas being assigned to the squares of
an infinite two-dimensional grid centered to the esquire (0, 0) and the values of ∂outADand ∂inADas assigned to the vertical and horizontal edges of this grid.
2.4.3 An Example
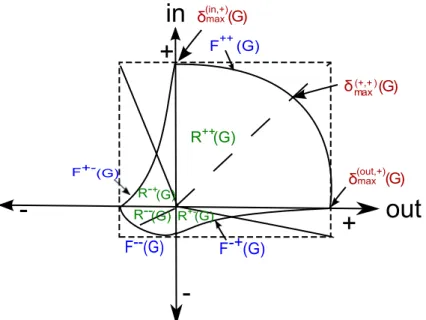
As the structures these definitions describe might become a little hard to com-prehend, there is a need for an example to demonstrate them. Here, results from Wikipedia are used as such an example. The full details on Wikipedia will be pre-sented along with the other datasets on the “Data Exploration” part. Additionally, these examples will be used for reference to any of the following definitions where needed. Figure2.3a displays the differentials ∂outA
D and ∂inAD for the digraph
formed by Wikipedia. Figure 2.3b displays theD-core of the same dataset along with some metrics and concepts defined in the following subsections.
−50 −40 −30 −20 −10 0 10 20 30 40 50 0 5 10 15 20 25 30 35 40 45 50 WIKIPEDIA ∂ in | ∂ out outlinks inlinks (a) 0 5 10 15 20 25 30 35 40 45 0 5 10 15 20 25 30 35 40 45 50 inlinks outlinks
OCI
BCI
ICI
>30k >10k >5k >3k >2k >1k >700 >600 >450 >300 >0 (b)Figure 2.3: a.The differentials ∂outA
D and ∂inAD for the digraph formed by
Wikipedia.White squares indicate a value of zero.
In the example of Figure 2.3 the matrix AD and its differentials ∂outAD and
∂inADfor the digraph formed by the Wikipedia (2004, English edition). The nodes
correspond to Wikipedia pages and each directed edge e = (x, y) is a link from page x to page y. Cell (k, l) in the matrix ADstores the size (dck,l)k,l∈N of the
re-spective d-core DCk,l. As agreed before, the coordinates (k, l) ar5e seen as squares
of an infinite two-dimensional grid, the values dcloutk,l and dclink,lare assigned to its edges.
The result for the case of ADis depicted in Figure2.3b. As there is no Wikipedia
entry with more than 51 out-links or more than 43 in-links this matrix is restricted to its lower 51×43 portion. For each digraph D examined, this matrix is calledD -core matrixof D; its cells are visualized as squares of an infinite two-dimensional grid ΓD and the size of its (k, l)-cores is depicted by coloring the corresponding
squares with different colors. According to Figure2.3b, the value of δ∗
(DWiki)for
the Wikipedia digraph DWiki is obtained in cell (38, 41) and is equal to 38+412 =
39.5. In other worlds, 39.5 is the half of the Manhattan distance between a cell of theD-core matrix of DWiki and the cell (0, 0); in our case this cell is (38, 41) and
this justifies the value of δ∗
(DWiki).
For the cases of ∂outA
D and ∂inAD the visualization of Figure 2.3a is adopted
and makes it possible to depict together differential values in both directions:
Example: Consider the grid ΓD depicting AD in Figure 2.3b. For each square in
this grid, a new vertex is added in its center, an edge is drawn connecting it to its 4 corners, and then the square is removed. Notice that the resulting graph is a new infinite grid, denoted here by ∂ΓD, whose squares are corresponding either
to horizontal or to vertical edges of ΓD. That way one can assign the values of
∂outAD to “vertical” squares of ∂ΓD and and the values of ∂inAD to “horizontal”
squares of ∂ΓD. The colors of the squares of ∂ΓDcorrespond to the different sizes
of DCLoutk,l and DCLink,l. That way the visualization of Figure 2.3a can be seen as a visualization of the discrete differential values of the matrix AD depicted in
Figure2.3b.
The sequence of squares in ΓD is called incremental if for each two consecutive
squares (x, y), (x′, y′), it holds that either x′
= x + 1and y′
= yor that x′
= xand y′= y + 1. Each incremental sequence that starts from (0, 0) corresponds to a
pos-sible scenario of considering consecutiveD-cores of D by gradually incrementing either the demand on the minimum out-degree or the demand on the minimum in-degree.
2.4.4 Digraph Degeneracy Frontiers