© Cyrus Talebpour, 2019
A perovskite silver antimicrobial compound with
diminished silver ion release
Mémoire
Cyrus Talebpour
Maîtrise en génie des matériaux et de la métallurgie - avec mémoire
Maître ès sciences (M. Sc.)
ii
Résumé
L'infection microbienne est une des causes des maladies menaçant la vie. Elle est conventionnellement traitée par des antibiotiques. Cette pratique a entraîné l'émergence de la résistance aux antimicrobiens (RAM), qui est associée à un taux de mortalité croissant. Afin de contrer le problème, les cellules microbiennes doivent être retirées de la zone de cible sans que l’agent microbienne libère des sous-produits. Les désinfectants, tels que l'eau de Javel et le chlore, tout en étant très efficace à large spectre antimicrobien, ne conviennent pas dans
certaines circonstances. Ces composés sont chimiquement réactifs, ils peuvent donc corroder les surfaces en contact et laisser des composés toxiques. D'autre part, les antibiotiques
conventionnels, bien qu'ils ne présentent pas ces propriétés indésirables de désinfectants, ont généralement un spectre d'action plus étroit et sont plus sujets au développement du RAM. Entre les désinfectants et les antibiotiques, il existe des composés à base d'argent qui, tout en ayant une activité antimicrobienne à large spectre, sont relativement sans danger pour les cellules de mammifères. Le mécanisme de l'action antimicrobienne des composés d’argent classiques est
basé sur la libération d'ions argent dans le milieu. L'argent est un métal coûteux et se dégrade en libérant des ions. De plus, l'exposition à des niveaux élevés d'ions d'argent est un danger pour la santé et l'environnement et donc doit être évitée.
Par conséquent, incorporer étroitement des atomes d'argent dans une structure moléculaire résistante à la corrosion, tout en gardant l'activité antimicrobienne, permettrait
d'utiliser l'argent comme agent antimicrobien dans des applications exigeant un composé d'argent résistant à la corrosion avec de faibles niveaux de libération d'argent dans l'environnement. Pour atteindre cet objectif, un nouveau composé d'argent, AgNbO3, a été synthétisé et caractérisé en
termes de taille, de morphologie, de comportement de sédimentation, de corrosion et d'activité antimicrobienne. Il a été démontré que tout en ayant un taux de libération d'argent diminué de plus de 150 fois par rapport aux particules Ag2O de référence, l'activité antimicrobienne des
nanoparticules AgNbO3, quantifiée par la concentration minimale inhibitrice (MIC), était similaire
dans le cas des milieux aqueux. L'étude du mécanisme d'action a indiqué que le composé exerce son action antimicrobienne par contact avec des cellules microbiennes.
iii
Abstract
Microbial infections are the main causes of life threatening diseases and are conventionally treated by antibiotic agents. This practice has resulted in the emergence of
antimicrobial resistance (AMR), which is associated with ever-increasing rate of mortality. In order to counter the issue, the microbial cells should be removed from targeted areas without releasing toxic byproducts behind. Disinfectants, such as bleach and chlorine, while being very effective broad-spectrum antimicrobial, are not suitable in some circumstances. These compounds are chemically reactive; thus, they can corrode the surfaces in contact and can leave behind toxic compounds particularly in reaction with organic matter. On the other hand, the conventional antibiotics, while not having these undesired properties of disinfectants, have generally narrower spectrum of action and are more prone to the development of AMR. In between of disinfectants and antibiotics there are silver-based compounds, which while having broad-spectrum
antimicrobial activity, are relatively safe to mammalian cells. There are, however, some challenges associated with the usage of the conventional silver compounds as antimicrobial agent, arising from the mechanism of antimicrobial action through the release of silver ions to the medium. Silver is an expensive metal and degrades in while releasing ions. Moreover, exposure to high levels of silver ions is a health an environmental hazard and should be avoided. Therefore, tightly incorporating silver atoms in a corrosion-resistant molecular level structure with keeping the antimicrobial activity would enable feasibility of using silver as an antimicrobial agent in
applications that require corrosion resistant silver compound with low levels of silver release to the environment. To achieve this goal, a new silver compound, AgNbO3, was synthesized and
characterized in terms of its size, morphology, sedimentation behavior, corrosion, and
antimicrobial activity. It was demonstrated that while having a diminished silver release rate of more than 150 fold compared to the reference Ag2O particles, the antimicrobial activity of AgNbO3
nanoparticles, quantified by minimum inhibitory concentration (MIC), was similar in the case of aqueous media. Investigating the mechanism of action indicated that the compound exerts its antimicrobial action via contact with microbial cells.
iv
Table of contents
Résumé ... ii Abstract ... iii Table of contents ... iv List of tables... viList of figures ... vii
List of abbreviations………... …x
Acknowledgements ... xii
Introduction ... 1
The Morphology and Structure of Bacterial Cells ... 1
Antimicrobial activities of silver ... 3
Antibiotics and quantification of their action ... 4
A historical perspective on using silver as an antimicrobial agent ... 5
The bactericidal action of Ag in the context of antimicrobial surfaces ... 7
Mechanisms of bactericidal action of silver ... 9
Bactericidal activities of a particular perovskite ...12
Perovskites ...13
Concluding remarks ...14
Chapter 2 Materials and method ...15
2.1 Synthesis of AgNbO3 nanoparticles ...15
2.2 Characterization of nanoparticles ...18
2.2.1 Crystal structure by XRD ...18
2.2.2 Specific surface area measurement...21
2.2.2.1 Working principle of the BET method ...21
2.2.2.2 Measurement procedure and results ...29
2.2.3 The silver release rate ...31
2.2.3.1 Silver release rate in water ...31
2.2.3.2 Silver release rate in TSB media ...34
2.2.4 Sedimentation behavior of the nanoparticles ...37
2.2.5 Electron microscopy ...42
2.2.6 Particle size distribution ...42
2.3 Assessing the antimicrobial activity ...43
2.3.1 Antimicrobial susceptibility tests ...44
2.3.2 Preparation of target microbial suspensions ...46
Chapter 3: Antimicrobial activity of AgNbO3 nanoparticles ...48
3.1 Introduction ...48
3.2 Quantifying the antimicrobial activity of AgNbO3 nanoparticles ...49
v
3.3.1 Evidences implying much lower MIC for AgNbO3 ...53
3.3.2 Dependence of antimicrobial effect on exposure time ...58
3.3.3 Loss of antimicrobial activity by autoclaving...63
3.3.4 Further experiments on elucidating the antimicrobial mechanism ...65
3.4 A model antimicrobial surface using AgNbO3 nanoparticles...68
Conclusions and recommendations for future works ...71
vi
List of tables
Table 2.1 The measured specific surface values (in m2/g) and the calculated radii of the particle.
The densities for the perovskite nanoparticles are based on the calculations of reference [52]. ...30
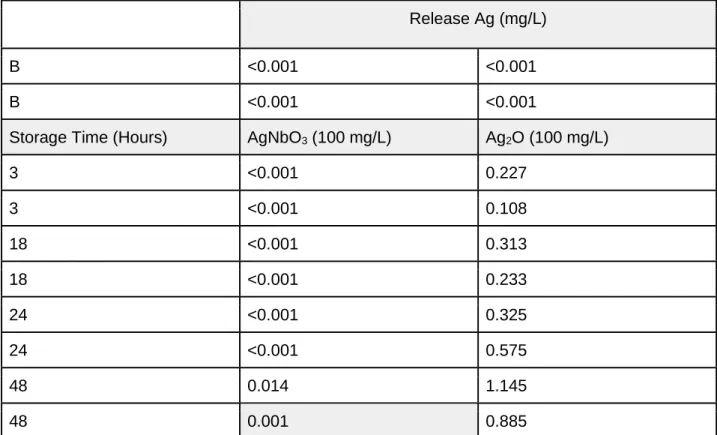
Table 2.2 The level of silver release from equal weights of AgNbO3 and Ag2O particles in
deionized water. ...33
Table 2.3 The level of silver release from equal weights of AgNbO3 and Ag2O particles in TSB. 35 Table 3.1 The MIC values (µg/mL) of silver nanoparticles with different sizes (nm) for S. aureus
and P. aeruginosa species. ...51
Table 3.2 Antimicrobial activity of gravitationally settled and unsettled AgNbO3 nanoparticles. No
vii
List of figures
Figure 1.1 Basic bacterial cell structure adopted from reference [1]. ... 2
Figure 1.2 The chemical structures of some antibiotics adopted from reference [5]. ... 5
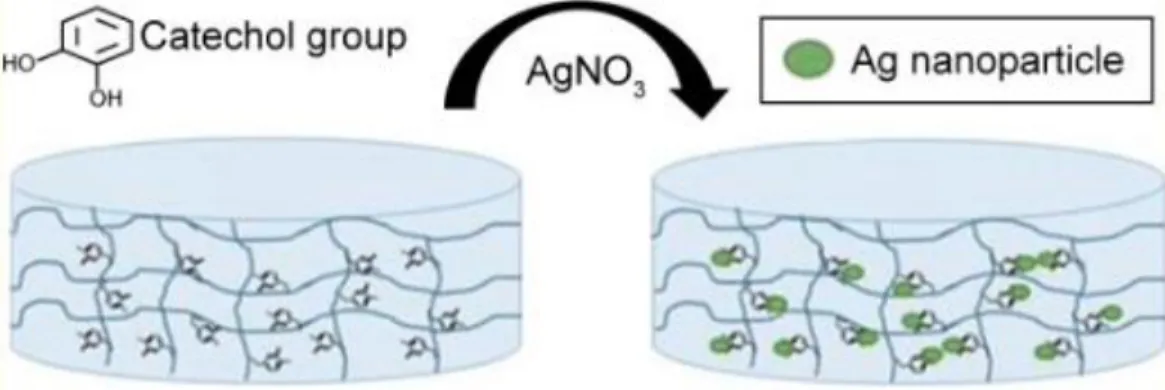
Figure 1.3 A schematic illustration of the method by which silver nanoparticles are incorporated in a hydrogel network [24]. ... 8
Figure 1.4 Reactions essential to energy production adapted from reference [29]... 9
Figure 1.5 Schematic mechanism of antibacterial action of different silver nanoparticles [33]. ....11
Figure 1.6 (A) Perovskite lattice structure of AgNbO3. (B) The presence of positive charge on the nanoparticle may promote its contact with negatively charged bacterial cell. ...14
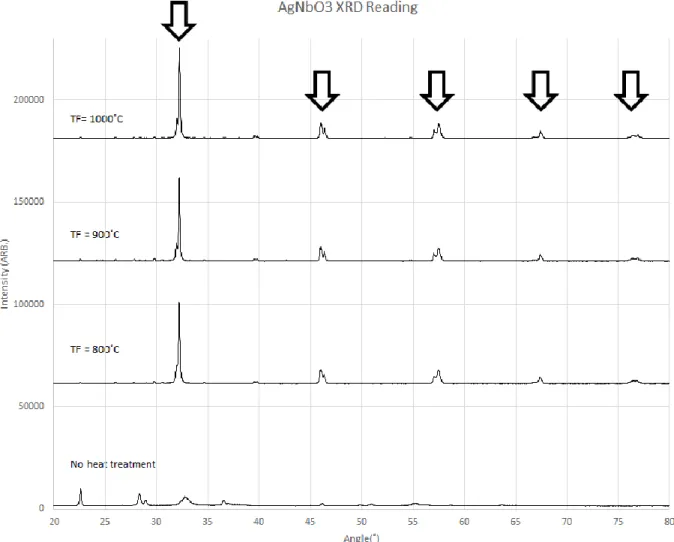
Figure 2.1 The XRD spectra of AgNbO3 obtained by ceramic method at different reaction temperatures. The characteristic peaks are indicated by arrows. ...16
Figure 2.2 Schematic view of the motion of balls and particles in a planetary ball milling system [42]. ...17
Figure 2.3 (Left) the AgNbO3 compound synthesized by ceramic method exhibiting yellow color. (Right) subjecting the compound to ball milling process for the formation of nanoparticles exhibiting a grayish powder. ...18
Figure 2.4 Bragg reflection from a set of crystal planes with a spacing dhkl [44]. ...19
Figure 2.5 Schematic of x-ray diffractometer for powder method [45]. ...20
Figure 2.6 A surface (yellow) in equilibrium with a gas filling a chamber. ...22
Figure 2.7 A schematic representation of Type I isotherm [51]. ...24
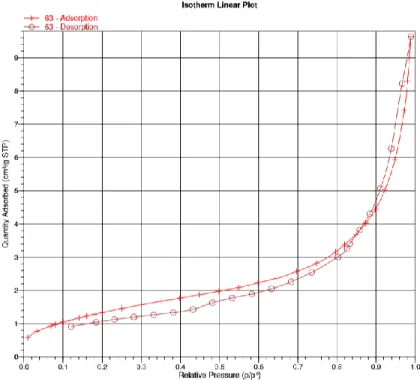
Figure 2.8 An example of type IV isotherm adopted from performed experiments. ...25
Figure 2.9 Critical components of a BET analyzer [48]. ...26
Figure 2.10 BET analyzer at the stage of charging the manifold [48] ...27
Figure 2.11 BET analyzer at the stage of “sample dosing and pressure equilibration” [48]. ...28
Figure 2.12 The isotherm plot for the case of AgNbO3 nanoparticles. ...30
Figure 2.13 Silver release level from of AgNbO3 and Ag2O inside water. ...34
Figure 2.14 The visual appearance of AgNbO3 nanoparticles and Ag2O particles poured into deionized water and kept for four months in room temperature versus the appearances of the same particles at the beginning of the test. ...37
Figure 2.15 Sedimentation of nanoparticles suspended in water after subjecting to a centrifugal force of 4500g for 20 minutes. ...38
Figure 2.16 Sedimentation of nanoparticles suspended in TSB media after subjecting to a centrifugal force of 4500g for 20 minutes. ...39
Figure 2.17 A schematic representation of particle distribution as was observed in figures 2.15 and 2.16. The x-axis in the range [0, 10] corresponds to the flat bottom of the tube, and the conical part extends from 10 to 50. The left and right figures ...40
Figure 2.18 The trajectory and the forces acting upon a particle during sedimentation in a swinging bucket centrifuge. FC, FN, and Ff, respectively denote the centrifugal, surface normal and frictional forces. ...41
Figure 2.19 Measured surface profile of the centrifuge tube. ...41
Figure 2.20 Size distribution measurement of AgNbO3 nanoparticles by laser diffraction. ...43
viii
Figure 2.22 The micro-dilution method for measuring MIC. In this schematic example, the
bacterial growth has occurred for antimicrobial agent concentration of equal or less than 4 μg/mL. Thus, MIC is 8 μg/L. ...45
Figure 3.1 Antimicrobial susceptibility test (AST) of AgNbO3 nanoparticles against SA and PA
bacterial species through microdilution method. ...50
Figure 3.2 Antimicrobial susceptibility test (AST) of Ag2O particles against SA and PA bacterial
species through microdilution method. ...50
Figure 3.3 The photos of agar plates on which a 1µL sample from the 15 mL tubes containing
different concentrations of AgNbO3 nanoparticles interacted with P. aeruginosa cells. ...53
Figure 3.4 The photos of agar plates on which a 1µL sample from the 15 mL tubes containing
different concentrations of AgNbO3 nanoparticles interacted with S. aureus cells. ...54
Figure 3.5 Experimental steps of the first part of experiments intended to identify the type of
particles involved in antimicrobial activity. ...55
Figure 3.6 Experimental steps of the second part of experiments intended to identify the type of
particles involved in antimicrobial activity. ...56
Figure 3.7 Experimental steps of the third part of experiments intended to identify the type of
particles involved in antimicrobial activity. ...56
Figure 3.8 Naming convention of samples taken from different heights. Each indicated height
interval is referenced to the bottom of the tube. ...59
Figure 3.9 Agar plate on which S. aureus cells exposed to fractionated nanoparticle suspensions
for the exposure time of 30 minutes. ...60
Figure 3.10 Agar plate on which P. aeruginosa cells exposed to fractionated nanoparticle
suspensions for the exposure time of 30 minutes...61
Figure 3.11 The photos of S9 and S7 plates in figure 11 are compared with the photo of the
control plate. ...61
Figure 3.12 TEM images of AgNbO3 agglomerates following settlement in TSB media. Images
are organized according to the height from which the sample was taken. ...62
Figure 3.13 Comparison of antimicrobial activities of nanoparticle suspensions with and without
subjecting to autoclaving. The turbidity of the autoclaved tubes at the right following spiking with bacterial cell and incubation indicates bacterial growth ...63
Figure 3.14 TEM images of dried AgNbO3 suspension in TSB before autoclaving. Images taken
under magnifications of 5000⨰, 15000⨰, 40000⨰, 80000⨰. Each image includes a scale in nm. 64
Figure 3.15 TEM images of dried autoclaved AgNbO3 suspension in TSB under magnifications of
1000⨰, 2500⨰, 5000⨰, 15000⨰, 40000⨰, 80000⨰. Each image includes a scale in nm. ...65
Figure 3.16 Tube 1: No growth control (Only media). Tube 2, 3, 4, 5, and 6, respectively
containing LiNbO3 nanoparticles at 500, 100, 50 and 25 μg/L concentration, had been spiked with PA cell suspension. ...66
Figure 3.17 Tube 1: No growth control (Only media). Tube 2, 3, 4, 5, and 6, respectively
containing LiNbO3 nanoparticles at 500, 100, 50, 25 and 12.5 μg/L concentration, had been spiked with SA cell suspension. ...66
Figure 3.18 A sphere with dielectric constant ε_p inside a medium with dielectric constant ε_a.
There is a constant uniform electric field in the medium. The presence of the sphere bends the field lines. Left: ε_p<ε_a and right: ε_p>ε_a [79]. ...67
ix
Figure 3.19 Tube 1 and tube 2 at the left are respectively positive and negative controls. Tubes 3
to 6, respectively contain CaCu3Ti4O12 nanoparticles at 500, 100, 50 and 25 μg/mL
concentration, had been spiked with SA cell suspension. ...67
Figure 3.20 Tube 1 and tube 2 at the left are respectively positive and negative controls. Tubes 3
to 6, respectively contain CaCu3Ti4O12 nanoparticles at 500, 100, 50 and 25 μg/mL
concentration, had been spiked with PA cell suspension. ...68
Figure 3.21 The procedure of preparing a solid phase media having a nominal nanoparticle
concentration of 64 g/mL. ...68
Figure 3.22 The antimicrobial susceptibility test for measuring MIC on solid phase. The top and
middle pictures are respectively the case of PA and SA. The bottom picture illustrates the case of no nanoparticle in the gel. The nanoparticle concentrations. ...69
x
List of abbreviations
ARS Activated Reactive Synthesis
ATS Antimicrobial Susceptibility Test
BET Brunauer Emmett and Teller
CFU Colony-Forming Unit
EPS Extracellular Polymeric Substances
ICP-MS Inductively Coupled Plasma Mass Spectrometry
LoB Limit of Blank
MIC Minimum Inhibitory Concentration
NP Nanoparticle
OD Optical Density
PA Pseudomonas Aeruginosa
ROS Reactive Oxygen Species
SA Staphylococcus Aureus
TEM Transmission Electron Microscopy
TSA Trypticase Soy Agar
TSB Tryptic Soy Broth
xi
Acknowledgements
I would like to first and foremost express my deepest sense of gratitude to Prof. Houshang Alamdari and Prof. Diego Mantovani for their consistent efforts in giving support, encouragement, and valued guidance throughout the duration of this project.
I would like to acknowledge my deep sense of gratitude to Prof. Salimnia from Department of Pathology of Wayne state university for his scientific and technical support and valuable advices
The financial support of the Natural Sciences and Engineering Research Council of Canada (NSERC) is gratefully appreciated.
I wish to thank all the faculty members & staffs of the Mining, Metallurgical and Materials Engineering Department of Université Laval, in particular Prof. Ghali for providing me with background knowledge on the topic of material corrosion and linking this knowledge with the subject matter of my thesis.
I finally would like to thank my dear father and mother for encouraging me in my endeavors. This project along with every positive accomplishment I have made in my life are a manifestation of their endless love and support for me.
1
Introduction
This master thesis concerns mainly with the synthesis of AgNbO3 nanoparticles for antimicrobial
purposes. The compound has been selected to minimize the release of silver ions to the medium while preserving the antimicrobial activity to the levels expected from the reference silver oxide particles that impart their antimicrobial action through silver ions. In this chapter, an overview of the background knowledge will be presented.
The Morphology and Structure of Bacterial Cells
Bacterial cells are between 0.3 and 5 µm in size. The basic structure of a bacterial cell is
presented in figure 1.1 [1]. The genomic or chromosomal DNA (often abbreviated as gDNA) is a very thin, long, circular double strand DNA that, in contrast to the case of mammalian cells, is not surrounded by a nuclear membrane. It carries the biological information of heredity from one generation of organism to the next. The bacterium might also have one or more plasmids; small double-stranded circular DNA. Specialized enzymes transcribe genes and produce various RNAs which is a polymer molecule used in various biological roles including regulation and expression of genes. Among these are messenger RNA (mRNA), ribosomal RNA (rRNA) and transfer RNA (tRNA). Ribosomes are protein synthesis machinery and are made of large complexes of rRNA and proteins. mRNA is translated into proteins in ribosomes.
The cytoplasmic cell membrane is a two-molecule thick phospholipid bilayer in which numerous proteins, such as enzymes for synthesis cell wall and sensor proteins are embedded. Lipid-soluble molecules, water, and small molecules easily pass through the lipid bilayer of the membrane. However, charged or polar molecules such as amino acids, sugars, and ions do not pass readily through a membrane. Unlike mammalian cells, in bacterial cells membrane is surrounded by the cell wall. The cell wall comprises mainly peptidoglycan, a negatively charged polymer matrix comprising of cross-linked chains of amino sugars, namely, N-acetylglucosamine and N-acetylmuramic acid. Bacterial cells are classified as either Gram-positive or Gram-negative, depending on the architecture and thickness of the cell wall. Gram-positive bacteria retain the violet Gram stain due to their thick (15–80 nm thick) peptidoglycan layer on the outside of the cell membrane. In contrast, Gram-negative bacteria do not take up the stain, as their thinner
2
(approximately 3 nm) peptidoglycan layer is sandwiched between two cell membranes. Many bacteria have capsules made of polysaccharides that protect them from phagocytosis (being killed by white cells). The two bacterial cells, Pseudomonas aeruginosa (PA) and Staphylococcus aureus (SA), which have been used in this work for assessing the antimicrobial activity of AgNbO3
nanoparticles, are respectively Gram-negative and Gram-positive. Staphylococcus aureus is spherical in form and has a diameter in (0.6-1) µm range. Pseudomonas aeruginosa has a rod shape with diameter (0.5-0.8) µm and length (1.5-3) µm.
Figure 1.1 Basic bacterial cell structure adopted from reference [1].
The bacterial cell wall is electrically charged under most conditions. Exposed amino acid residues, acidic carbohydrate moieties, etc. are proteolysed to a degree that depends on the pH of the media [2]. At physiological pH (5-7), most bacterial strains are negatively charged because the number of carboxyl and phosphate groups exceeds the number of amino groups [3]. Under the influence of an electric field the particles move with a velocity proportional to their electrophoretic mobility [2]. This particular aspect may be used to enhance the likelihood of encounter between
3
bacterial cells and silver nanoparticles, if the later particles are judiciously designed to possess net positive surface charge over parts of their surfaces.
Antimicrobial activities of silver
Compounds with antimicrobial activity kill a class of microbial cells or render them incompetent to proliferate by cell division. These compounds are often organic molecules that are typically produced by fungal species. However, there are other antimicrobial species in the form of particles, examples of which are silver nanoparticles. Generally, an antimicrobial compound is classified as either “broad spectrum” or “narrow spectrum”. The antimicrobial is designated “broad-spectrum” if the class of cells that are susceptible to the compound encompass many species, ideally all bacterial species. In contrast, “narrow-spectrum” antimicrobial compound is only effective on a limited number of bacterial species. An example of broad-spectrum
antimicrobial is tetracycline (figure 1.2). An example of narrow spectrum antimicrobial is polymyxin that is only effective in gram-negative bacteria (figure 1.2).
Throughout their evolution, bacteria have gradually adapted to resist environmental stress and have become very efficient in tolerating external insult. Moreover, bacteria are frequently exposed to non-lethal concentrations of drugs, and this has an important role in the evolution of antibiotic resistance. There are a number of different ways that bacteria can become resistant to antibiotics. The first mechanism is due to random chromosomal mutations that lead to changes in the gene product that altered or eliminated the expression of a protein. A second mechanism is by acquisition of new DNA (often plasmids) that can happen to only limited number of bacteria that are naturally transformable. This foreign DNA may be part of genes, complete genes or even defined elements into their genome. The integration of host and foreign DNA makes a mosaic protein that is able to reduce the antibiotic susceptibility of the host bacteria [4].
Both silver ions and silver nanoparticles have shown broad-spectrum antimicrobial activities against gram-positive and gram-negative bacteria and are much less likely to induce antimicrobial resistance than do conventional antibiotics. Therefore, silver, in terms of its bactericidal action, is more similar to disinfectants; strong antibacterial chemicals, such as bleach, which are suitable for disinfecting inanimate objects. On the other hand, silver is relatively non-toxic to mammalian cells at low concentrations. In this sense, silver is similar to antibiotics; small molecules usually produced by fungi cells that kill bacteria without harming the person or animal being treated. Thus,
4
in the following subsections, first some basic knowledge on antibiotics, their mechanism of action, and antibiotic resistance are presented. After presenting a historical perspective on using silver as an antimicrobial agent, some recent developments, which may be relevant in the context of implementing silver-based antimicrobial surfaces, are highlighted. Finally, the mechanisms of silver antimicrobial activity is described in a phenomenological manner.
Antibiotics and quantification of their action
Antibiotics may be classified based on their chemical shape as presented in figure 1.2 [5]. One group of antibiotics, called ß-lactams, mimic a section of the bacterial cell wall, and they inactivate enzymes normally involved in assembling cell wall. Without a cell wall, most bacteria will burst open and die. Another group of antibiotics are tetracyclines, so named because they contain a four-ring structure. Tetracyclines prevent bacterial cells from making proteins. Bacteria unable to make proteins will no longer grow or divide, providing time for the body’s immune system to destroy them. A third major group of antibiotics are the aminoglycosides, so named for having sugars (glycosides) with amino groups (NH2), an example of which is tetracycline in figure 1.2.
Aminoglycosides prevent bacterial cells from making properly functioning proteins. The presence of these malformed proteins is frequently lethal to the bacterial cell. Macrolides represent another important group of antibiotics. All of them contain a large (macro) ring structure, an example of which is polymyxin in the right side of figure 1.2. Macrolides, like tetracyclines, prevent bacteria from making proteins. Quinolones represent a fifth class of antibiotics. These antibiotics cause bacteria to cut their own DNA, but prevent them from repairing the damage. There are other antibiotics that don’t fit neatly into any of the five groups. They damage bacterial cell through processes such as preventing RNA synthesis, inhibiting cell wall synthesis, damaging bacterial membranes, and causing uncontrolled cell movement.
5
Figure 1.2 The chemical structures of some antibiotics adopted from reference [5].
Susceptibility is the vulnerability of bacteria to the effects of an antibiotic and is determined by the susceptibility tests, which provide MIC values. The MIC (minimum inhibitory concentration) is the lowest concentration of an antibiotic that prevents visible growth of microorganisms. The MIC values of known antibiotics are in μg/mL range. For instance, the MIC of Chloramphenicol (see figure 1.2) against S. aureus is 2-8 μg/mL.
A historical perspective on using silver as an antimicrobial
agent
The material in this section is in large part extracted from a review article by Konop et al. [6]. Silver’s bactericidal impact has been known since ancient times. For instance, ancient people used Ag laminated vessels to preserve water, wine, and food, utilized Ag sheets as dressing material, and practiced silver needles for acupuncture [7]. Hippocrates also used silver; he
believed that silver powder has beneficial therapeutic effect and disease remedy. Silver has been used in the treatment of various maladies including ulcers. The first report about silver nitrate comes from pharmacopoeia published in Rome in 69 BC. In 1520, Paracelsus has been using silver and silver nitrate for treatment of wounds. Between the 1700s and 1800s, silver nitrate was used to treat venereal infections, leg ulcer, and acne. In modern era, the antibacterial properties
6
of silver and its salts were recognized after bacterial discovery. In 1884 German obstetrician Crede applied 1% AgNO3 in the form of eye drops for newborns to prevent gonorrheal infection.
The gold standard in the treatment of patient with topical burns is silver sulfadiazine (AgSD) introduced for the treatment of burns in 1970 by Fox. It is used to prevent and treat infections of second- and third-degree burns. Additional applications include wound dressing, coating of
catheters, and other devices implanted on or within the body. In clinical practice silver compounds in different forms and concentrations are still used. To date, only one product (Surfacine;
Surfacine Development Company, Tyngsborough, MA) has been assessed for use as a self-disinfecting surface in hospitals. It incorporates a water-soluble antimicrobial compound (silver iodide) in a surface-immobilized coating (a modified polyhexamethylene biguanide) that is capable of chemical recognition and interaction with the lipid bilayer of the bacterial outer cell membrane by electrostatic attraction [8].
In 2009, the UK National Health Service spent £25 million on silver-containing dressings and it has been estimated that 15 metric tonnes of silver were incorporated into medical products worldwide in 2010 alone [9]. Advancements in nanotechnology have improved the efficiency of silver disinfection and have enabled the use of silver as a viable disinfection option. Thus, it is expected that medicinal use of silver will be extended beyond the use in the treatment of burns or wound dressings. Moreover, bactericidal effects of silver are being exploited for commercial applications in non-medicinal areas. For instance, the CARDPool Company (France) has developed an innovative composite material based on Al2O3TiO2Ag as a disinfectant for spa
waters [10].
The first silver-resistant bacteria were identified and isolated in the 1960s from a burn wound that was treated with silver nitrate. Since then, silver-resistant bacteria were repeatedly isolated from clinical environments, burn wounds and even teeth. Silver resistant microorganisms also were recovered from environments with naturally occurring silver [8]. The major mechanisms appear to be either exclusion of silver from the bacterial cell or in mobilization of silver outside the cell [11]. Recently, Fuxing et al. [12] have demonstrated that extracellular polymeric substances (EPS) produced by bacteria constitute a permeability barrier with reducing constituents that mitigate the antibacterial activity of silver ions. Other researchers have suggested that these extracellular biomolecules can effectively impart NPs with ‘biological identity’, thereby altering the cell
7
works suggest that the EPS matrix on the bacterial surface plays a protective role in reducing toxicity. The constituents of EPS matrix are amphiphilic in nature and contain multiple active functional groups and/or charged moieties (e.g., amino and carboxyl groups) as well as hydrophobic moieties that protect the bacterial cells against environmental stresses such as desiccation, toxic metal species, antibiotic agents, high salinity, extreme temperature, and pH conditions [13].
The bactericidal action of Ag in the context of antimicrobial
surfaces
Silver has been incorporated on surfaces to eliminate bacterial accumulation and biofilm formation in two broad class of applications; water treatment for niche markets, and surfaces encountered in medical applications such as catheters and implants.
For water treatment applications, silver nanoparticles are typically anchored on a solid support, such as Methacrylic acid copolymer beads or absorbent blotting paper, or coated on the surfaces of plastic bottles [14]. Weber and Rutala [11] have reported an ‘in situ’ process for the formation of silver nanoparticles onto cotton fabrics in an aqueous media. Silver nanoparticles are bonded onto the cotton fibers. This enables improved bonding of silver nanoparticles onto the textiles, thus mitigating the challenges associated with the leaching of silver into eluents and wash-offs. PSA/AgNP cryogels developed by Loo et al. offer a simpler alternative to point-of-use water disinfection whereby the disinfected water can be recovered by squeezing the swollen cryogels [15, 16]. The disinfection ability of the cryogels are surprisingly fast. Zeng et al. [17] have
synthesized Ag/rGO hydrogel with controlled porous rGO (reduced graphene oxide) network and dispersed Ag nanoparticles. The introduction of AgNPs onto GO can not only solve the problem of aggregation and stability of AgNPs, but also combine the bactericidal effect of GO and AgNPs [18]. Biswas, Pritam, and Raj [19] selectively impregnated silver nanoparticles on the external surface of plasma treated activated carbon (AC) granules (referred to as Ag-AC hybrid, having 0.8 wt% of Ag), for achieving continuous disinfection of water in a single flow-column set-up.
Extremely high specific surface area of AC provides a high adsorption capacity and it also removes most of the inorganic and organic contaminants from drinking water. Gao et al. [20]prepared TiO2/Ag coatings which exhibited 100% bactericidal activity against E. coli and S.
aureus, which indicated the TiO2/Ag coatings with more than 10 ppm AgNPs had strong
8
Figure 1.3 A schematic illustration of the method by which silver nanoparticles are incorporated in
a hydrogel network [24].
The recent progress in the application and preparation strategies of silver-loaded antimicrobial surfaces for catheters has been reviewed by Neoh et al. [21]. Konai et al. have described the most promising approach for engineering the silver hydrogel matrix [22]. An approach of choice is coating the surface with a hydrogel and then impregnate the hydrogel with silver nanoparticles [23]. One example of this approach is presented if figure 1.3 [24]. A hydrogel having catecholic
group is coated on the surface. Then, AgNO3 is added to the surface, following which a chemical
reaction converts the Ag+ into solid AgNPs. The morphology of the resulting hydrogel is a porous
structure that has anti-biofouling property. This property synergically acts along with the antimicrobial effect of silver and provides enhanced antimicrobial property to the surface.
The works so far reported in literature concerning the usage of the conventional silver compounds as antimicrobial agent, suffer from two issues, both arising from the observation that antimicrobial action of these compounds are mainly through the release of silver ions to the medium: 1) Silver ion is a reactive specie and over time its presence can result in undesired byproducts, 2) The exposure to high levels of silver ions is a health hazard and should be avoided [25]. Moreover, silver is an expensive material and relying on release of ions from the base compound degrades it. Therefore, tightly incorporating silver atoms in a corrosion resistant molecular level structure with keeping the antimicrobial activity would enable feasibility of using silver as an antimicrobial agent in applications that require corrosion resistant silver compound with low levels of silver release to the environment. To this end, we decided to embed silver in a ceramic structure, because ceramics are mostly oxides, being “oxidized” is their natural state and silver release via corrosion is less likely to occur.
9
Mechanisms of bactericidal action of silver
Though the precise mechanisms of silver antibacterial action are not fully understood, the prevailing view is that silver’s broad-spectrum bactericidal property is a strong indication that numerous pathways are involved [26]. Moreover, reported results have highlighted different kinds of bactericidal actions depending on the physical state of silver atom: silver nanoparticles
(suspended or supported), ionic silver, and supported silver [27].
In the case of Ag+ ions, several modes of action have been proposed, the most likely being the
interaction of the Ag+ ions with electron-donating groups such as thiols (-SH), carboxylates,
amides, imidazoles, indoles and hydroxyls. This type of chemical interaction could target membrane-bound and cytoplasmic proteins and enzymes, as well as bases in DNA. These interactions have been reported to cause (i) structural changes in the bacterial membranes, (ii) inhibition of the enzymes of the respiratory chain, and consequently, decoupling of respiration from ATP synthesis, (iii) formation of reactive oxygen species, and (iv) lesions in DNA, affecting chromosome replication ability [28]. The second and third items of this list are of particular interest and are thus explained in more detail in the following.
10
The main mission of carbohydrate metabolism in the cells is the production of energy through respiratory chain. The most universal energy transfer compound found in living cells is adenosine triphosphate (ATP). Cells can generate ATP by oxidative phosphorylation in which the energy from an electrical and chemical gradient formed across the cell membrane is used to drive a membrane-bound ATP hydrolase complex to produce ATP from ADP and inorganic phosphate (see figure 1.4). The generation of an electrical and chemical gradient across cell membrane requires a complex set of reactions in which H+ and e- are transferred from chemical to a series of
membrane-associated proteins called cytochromes. As the e- is passed from one member of the
cytochrome chain to another, the energy released is used to pump H+ out of the cell. The resulting
difference between the inside and outside of the cell in terms of charge (electrical potential) and pH (chemical potential) can be harnessed by the cell to generate ATP. Of course, in order for the cytochrome system to work, there must be a terminal electron acceptor molecule. Under aerobic conditions, oxygen will serve that function [31]. Any damage on the membrane bound ATPase enzyme complex by the action of Ag+ ion can compromise cell viability.
During the ATP generation process, oxygen species that are toxic to DNA, protein, and lipid components of the cell are formed through both enzymatic and spontaneous chemical reactions. The reaction of oxidative enzymes with molecular oxygen can generate superoxide (superoxide anion):
𝑂2+ 𝑒−+ 𝑜𝑥𝑖𝑑𝑎𝑡𝑖𝑣𝑒 𝑒𝑛𝑧𝑦𝑚𝑒𝑠 → 𝑂2−∗ eq. 1.1
Superoxide may interact in a number of enzymatic as well as spontaneous chemical reactions with hydrogen peroxide to produce more highly reactive oxygen derivatives such as hydroxyl radicals:
𝑂2−∗+ 𝐻2𝑂2→ 𝑂𝐻−+ 𝑂𝐻∗+ 𝑂2 eq. 1.2
Autoxidation of reduced FAD molecule (Flavin adenine dinucleotide, C27H33N9O15P2) or reduced
flavoprotein gives rise to hydrogen peroxide:
𝐹𝐴𝐷𝐻2+ 𝑂2→ 𝐹𝐴𝐷 + 𝐻2𝑂2 eq. 1.3
Superoxides and hydrogen peroxides are among oxygen containing chemically reactive compounds that are known as reactive oxygen species (ROS). Most aerobic organisms are
11
protected from the toxicity of ROS compounds by the enzymes superoxide dismutase and catalase. If these enzymes are damaged, then the cell can be subjected to apoptosis response and is killed.
Figure 1.5 Schematic mechanism of antibacterial action of different silver nanoparticles [33].
The antibacterial effect of silver nanoparticles (NP) is not fully understood to date. There are speculations that the action of silver nanoparticles is broadly similar to that of silver ion. It may be anticipated that a bacterial cell in contact with silver nanoparticles takes in silver ions, which inhibit respiratory enzyme(s), facilitating the generation of reactive oxygen species (ROS) and
consequently damaging the cell. The produced ROS can irreversibly damage bacteria (e.g., their membrane, DNA, and mitochondria), resulting in bacterial death [30]. Wonyoung et al. [31] have reported strong evidences in the support of the foretold mechanism, i.e. bacterial death by the action of ROS. According to Durán et al. [32], “currently, the most relevant conclusions are that the activity of the silver nanoparticles below 10 nm is mainly by the nanoparticle itself, while at larger sizes, the predominant mechanism occurs through the silver ions. …. The targets of this nanostructured material were clearly proven: cell membrane disruption and DNA transformation via ROS as the principal agent.” The bactericidal mechanism of silver NPs, as described above,
12
can be pictorially understood by reference to an excellent illustration by Wyszogrodzka et al. [33] reproduced in figure 1.5.
In contrast to silver ion, which comes in a single form, silver NPs can possess different physical or chemical attributes, including size, shape, coating, and surface charge. Therefore, if the
bactericidal effect somehow depends on these attributes, one may expect broader mode of action since often there is no tight control on the size and form distribution in a typical NP sample [34]. In an attempt to investigate the shape effect on the antibacterial activity, Hong et al. [35] prepared three differently shaped AgNPs; nanocubes, nanospheres, and nanowires. The antibacterial activity of AgNPs was determined against E. coli. Measurements showed that the three differently shaped AgNPs had the following forms: (55±10) nm in edge length for nanocubes, (60±15) nm in diameter for nanospheres, (60±10) nm in diameter and (2–4) μm in length for nanowires. At the bacterial concentration of 104 CFU/mL, the MIC of nanocubes, nanospheres, and nanowires were
37.5, 75, and 100 μg/mL, respectively. The weakest antibacterial activity of silver nanowires compared with silver nanocubes and silver nanospheres was attributed to its worst contact with bacteria. Wyszogrodzka et al. [33] has suggested that increased density of edge and corner sites on the surfaces of crystalline NPs can partially improve activity of silver NPs. In the context of the planned research, more interest is directed towards the bactericidal mechanism of supported silver. Gallo et al. studied the bactericidal effects of a special type of antimicrobial surface
involving silver (Ag) nanoparticles embedded into titanium (Ti) [34]. They proposed that Ag and Ti represent a micro-galvanic pair with different potentials in the presence of electrolyte solution; the cathodic reaction will create a proton-depleted region between bacterial membrane and Ti
substrate, which leads to disruption of the ATP synthesis and bacteria death.
Bactericidal activities of a particular perovskite
Recently, Zhang et al. [36] reported bactericidal activities of strontium titanium ferrite composites (SrTi1-xFexO3-δ or STFx with x=0, 0.2, 0.4, 0.6, 0.8 and 1). The original goal was to investigate the
role of photo-catalysis as the major contributor of bactericidal effect. In this mechanism titanium dioxide particles are rendered with antimicrobial activity through absorption of photons followed by generation of reactive oxygen species (ROS) in the presence of water and oxygen. Thus, ROS can inactivate microorganisms or degrade organic chemical contaminants as discussed in previous sections. Thus, Zhang et al. [36] compared the bactericidal activities of STFx and a well
13
irradiation, while P25 showed no significant effect on E. coli within 1 h, STF0.8 killed all bacterial
cells within 15 minutes. This observation could have been attributed to stronger photocatalytic activity of STF0.8. However, this compound showed similarly high bactericidal activity in dark
condition. An interesting observation of Zhang et al. was an apparent correlation between Zeta potential and antibacterial effect of STFx and the starting materials. While the authors failed to
identify parameter space for bactericidal activity of STFx, they showed that opposite surface
charge of bacterial cells and STFx nanoparticles greatly contribute to the activity. This
observation was another reason why it was decided to incorporate silver in a perovskite crystal structure; it is hoped that bactericidal activity of silver is enhanced by incorporating it into a supplementary mechanism with designed surface charge.
Perovskites
In the previous section the selection of silver containing perovskites as antimicrobial agent was partially justified. The justification was based on the hypothesis that in a ceramic compound silver is in stable oxidized state and will not be easily eluted to the aqueous media. Moreover, a positive surface charge on the perovskite nanoparticles could enhance their interaction with the oppositely charged microbial cells through electrostatic forces. In this section, information on the perovskite structure is provided [37 and 38].
Perovskites are a family of ionic compounds which have a general formula of ABO3 and same
type of crystal structure as calcium titanium oxide (CaTiO3). The crystal structure of AgNbO3 is
presented in figure 1.6. Ag and Nb cations are, respectively, coordinated with 6 and 12 oxygen atoms. An easy way to visualize the structure is to form an octahedral with Nb cations in the center and 6 O anions on the apexes. The main parameter that determines the type of
appropriate lattice is the Goldschmidt tolerance factor described in the following as a measure of degree of distortion of a perovskite from the ideal cubic structure.
:
𝑡 = (𝐴𝑔−𝑂)
14
Figure 1.6 (A) Perovskite lattice structure of AgNbO3. (B) The presence of positive charge on the
nanoparticle may promote its contact with negatively charged bacterial cell.
According to Levy [39], on the basis of tolerance factor values, it has been proposed that compositions with 1.00 < t < 1.13 will exhibit hexagonal symmetry. As the A cation radius
decreases and/or B cation radius increases, the tolerance factor decreases. The perovskite will be cubic if 0.9 < t < 1.0, and orthorhombic if 0.75 < t < 0.87. If the value of t drops below 0.75 the compound has been seen to adopt a hexagonal ilmenite structure (FeTiO3). The value of the
tolerance factor for AgNbO3 is 1.006 [39], thus the compound has a hexagonal symmetry.
Concluding remarks
Reviewing the published research on the antimicrobial activity of Ag+, Ag-NPs, and supported Ag,
it is highlighted that the main drawback of applying the silver compounds to be elution of silver ions into the aqueous environment. In order to overcome this issue, it is suggested to use a silver compound in ceramic form for which the silver atoms are in oxidized state and are less likely to be released via corrosion. Thus, AgNbO3, having a perovskite lattice structure was selected as the
antimicrobial agent. One premise for the selection was that the compound in nanoparticle form may carry positive charge. This characteristic may increase the likelihood of bacterial cell contact with the nanoparticles.
15
Chapter 2 Materials and method
This chapter is concerned with the synthesis and characterization of AgNbO3 nanoparticles
intended to possess antimicrobial properties.
2.1 Synthesis of AgNbO
3nanoparticles
The synthesis of perovskite compounds and alloys has been recently reviewed by Royer et al [40]. Here, without delving in this subject, only a brief description of the main processes in Activated Reactive Synthesis (ARS) method will be provided which, in a scaled down form is adopted for the subject matter of the manuscript. ARS has three stages; 1) synthesizing the perovskite structure via the ceramic method, 2) milling the perovskite using a high-energy ball mill for a period of time, typically less than 2 h, and 3) subjecting the as-milled material to a low-energy milling step to increase the specific surface area.
According to V. Rives [41] the ceramic method comprises direct reaction between stoichiometrically appropriate amount of corresponding oxides that are finely powdered,
thoroughly mixed, and heated to elevated temperatures. In the case of AgNbO3, the raw materials
Ag2O (Sigma-Aldrich) and Nb2O5 (Inframat ® Advanced Materials TM) were calcined at 1000 oC for
4 hours in air atmosphere. The overall chemical reaction is
Ag2O+Nb2O5 → AgNbO3 eq.2.1
Since the molar masses of Ag2O and Nb2O5 are respectively 231.73 g/mol and 265.81 g/mol, for
every g of Ag2O, 1.147 g of Nb2O5 powders are mixed in a hardened steel crucible with
high-energy ball milling for 10 minutes. The mixture is transferred to a ceramic crucible and placed in an oven where it is gradually heated at a rate of 5 oC/min until the reaction temperature is
reached. The mixture is kept at this temperature for 4 hours and gradually cooled down at a rate of 10 oC/min to room temperature.
In order to find the optimum reaction temperature, the compound was prepared at various selected temperatures; 800, 900, 1000, 1100 oC. It was observed that the high temperature of
16
selection between the three lower temperatures were based on comparing the XRD spectra (see section 2.2) at the characteristic peaks as presented in figure 2.1. As it is observed at the reaction temperature of 800 oC the peak at ~77 degrees is not pronounced. The peaks are sharpest at
1000 oC, thus this was selected as the preferred reaction temperature.
Figure 2.1 The XRD spectra of AgNbO3 obtained by ceramic method at different reaction
temperatures. The characteristic peaks are indicated by arrows.
After selecting the reaction temperature of 1000 oC, the AgNbO
3 ceramic was synthesized at
larger quantity of 50 g. For this purpose, 23.3 g of Ag2O was mixed with 26.7 g of Nb2O5. The
same mixing and thermal treatment steps as described above were repeated. This time, after the product material AgNbO3 has cooled down, the compound was subjected to the high energy
milling process, during which brittle materials fracture under impact and the particle size decreases. At each operation, 7 g of material is processed for 90 minutes.
17
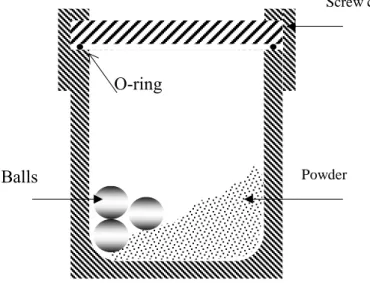
The milling process was carried out using SPEX mill apparatus. The SPEX mill is more commonly used in research laboratories since it can handle small amounts of sample. This system consists of a crucible and typically three milling balls as shown in figure 2.2. The crucible oscillates in the opposite directions and balls have a chaotic trajectory. Thus, the powder particles are subjected to high energetic impact of balls.
In the final step, the material is subjected to a low energy attrition mill, where a shear stress is applied on the agglomerates of the material, thus increasing its specific surface area. In this step, all of the approximately 40 g of powder from the previous step was added to a crucible containing hundreds of beads. To this, 10 mL of water was added and the slurry was processed for two hours. At the end of the operation, the beads are rinsed with deionized water and the residue thus obtained was dried inside an oven with a temperature of 150 oC for 8 hours. Thus, the material
was synthesized and the resulting powder was subjected to characterization tests as described in the following sections.
The appearance of AgNbO3 at end of the ceramic process and also at the end of nanoparticle
synthesis is presented in figure 2.3. AgNbO3 at end of ceramic process has a yellowish color. This compound with a bandgap energy of 2.8 eV (absorption wavelength of ~440 nm) [43] is an electrically insulator ceramic. On the other hand, the agglomerates at the final stage of ball milling have a dark color. This indicates strong light absorption over all visible region. Thus, during the
Screw cap
Powder
Balls
O-ring
Figure 2.2 Schematic view of the motion of balls and particles in a planetary ball milling system
18
ball milling process extra energy levels have been created between the valence and conduction bands of the crystal due to the generation of crystal defects and surface irregularities.
Figure 2.3 (Left) the AgNbO3 compound synthesized by ceramic method exhibiting yellow color.
(Right) subjecting the compound to ball milling process for the formation of nanoparticles exhibiting a grayish powder.
2.2 Characterization of nanoparticles
Characterization is a set of tests aimed at determining those parameters that are relevant for measuring and describing the antimicrobial activity of the nanoparticles.
2.2.1 Crystal structure by XRD
The length scale of the crystal structure is atomic size, i.e. 0.1 nm. This length scale can only be interrogated by photons with wavelength λ~0.1 nm. The energy of these photons is related to their wavelength through E (keV) =1.2412/λ (nm) [44]. When λ=0.1 nm, then E=12.4 keV, indicating that these X-rays should be generated by electrons accelerated in electrical fields of few tens of kV. The X-ray radiation intended for crystallography is generated by accelerating electrons in vacuum and colliding them with a polished metallic surface. A small fraction of electrons lose their energy through Bremsstrahlung radiation, which has a continuous spectrum
19
with a cut-off at the maximum energy of electrons. Superimposed on this spectrum are two sharp lines, known as Kα and Kβ, whose wavelengths are a characteristic of the anode metal. Usually,
the Kα line is selected and the Kβ line is filtered out by using a filter made of a thin metal foil of the
element adjacent (Z−1) in the Periodic Table; for instance, nickel effectively filters out the Kβ line
of copper.
Figure 2.4 Bragg reflection from a set of crystal planes with a spacing dhkl [44].
The principle of X-ray crystallography can be explained by referring to figure 2.4, which presents a cross section of crystal’s hkl planes spaced by dhkl [44]. Each datum in the figure presents a base
of crystal. The crystal is radiated by a collimated and monochromatic X-ray beam with an incidence angle of θ. Two reflected rays, ABC and DFH, would constructively interfere if the difference in their optical path, DFH-ABC, were an exact multiple of wavelength. Now,
𝐷𝐹𝐻 − 𝐴𝐵𝐶 = (𝐷𝐸 + 𝐸𝐹 + 𝐹𝐺 + 𝐺𝐻) − (𝐴𝐵 + 𝐴𝐶) = 𝐸𝐹 + 𝐹𝐺;
𝐸𝐹 = 𝐹𝐺𝑑ℎ𝑘𝑙𝑠𝑖𝑛(𝜃) eq.2.2
Therefore, the intensity of the reflected X-ray is maximum when
20 This relation is known as Bragg reflection.
The spacing of crystal planes with Miller indices hkl is related to the lattice parameters of orthorhombic crystal system by the following relation:
1 𝑑ℎ𝑘𝑙2 = ℎ2 𝑐2+ 𝑘2 𝑏2+ 𝑙2 𝑐2 eq.2.4
In this work, the powder method is employed. This method can be described by referring to figure 2.5 that is adopted from Smith and Hashemi [45]. The monochromatic X-ray source and X-ray detector are situated on the circumference of a graduated circle centered on the finely powdered specimen. The powder content is a collection of small crystals, known as crystallites, which are oriented randomly to one another. Thus, for any given incidence angle θ a fraction of crystallites will participate in diffracting X-rays to the detector. For these crystallites if the Bragg condition is fulfilled the detector will detect an intensity peak. The X-ray detector and powder specimen holder are mechanically coupled with a goniometer so that a rotation of the detector through 2θ degrees occurs in conjunction with the rotation of the specimen through θ degrees, a fixed 2:1 ratio. The device’s output is a plot of detected power versus 2θ. The positions of peaks can be used for calculating the crystal parameters.
21
2.2.2 Specific surface area measurement
2.2.2.1 Working principle of the BET method
Consider a powder consisting of 𝑁 nanoparticles with mass density 𝜌𝑃(g/cm3) and average radius
of 𝑟𝑝. The specific surface area of these particles,𝑠, is defined as
𝑠 = 𝑆𝑡 𝑀𝑡= 𝑁(4𝜋𝑟2) 𝑁𝜌𝑃((4/3)𝜋𝑟𝑃3)= 3 𝑟𝑃𝜌𝑃 eq.2.5
For the case of 𝜌𝑃∼7𝑔/𝑐𝑚3and 𝑟𝑝∼100𝑛𝑚, then 𝑠∼4 𝑚2/𝑔 is obtained. This is the lower limit as
the real particles are not smooth and the presence of surface roughness, pores, voids, steps, and other surface imperfections, will render the specific surface area much larger. This highlights a fundamental rule regarding the degree by which the specific surface area can be used as a figure of merit for assessing the reactivity of nanoparticles in the context of a particular application: if the nanoparticle is used to react for atomic scale particles, the rate of chemical reaction will increase by increasing specific surface area. However, if the reaction involves nanoparticles and other particulate matter the rate of reaction may not linearly increase with specific surface area. The interaction of bactericidal nanoparticles with bacterial cells are in this category as the size of bacterial cells are about 1 μm and, depending on the mechanism of action, it is expected that the number of nanoparticles, rather than their specific surface area, can be a more important quantity. Anyway, the knowledge of specific surface area of nanoparticles can shed a light on determining the mechanism of action. Thus, this section has been devoted for describing the surface area analysis techniques with emphasizing BET analysis method, which is used by the measurement system, micrometrics TriStar II. Most of the material is adopted from the information provided on the website of the instrument’s manufacturer [46].
The goal of a surface area measurement system is to determine the number of moles of gas molecules that can form a monolayer on the surface under measurement. This quantity is denoted by 𝑛𝐿. Once 𝑛𝐿 (mol) was determined, the specific surface area, 𝑠, is calculated by dividing the
total surface area, S (𝑚2), by the mass of the sample. S is given by
22
Where 𝑁𝐴 is the Avogadro constant (6.023x10²³ molecules/mol) and σ (m2/molecule) is the area
occupied by one gas molecule, which from the density of liquid nitrogen has been calculated to be 𝜎 = 16.2 × 10⁻²⁰ m2 for the nitrogen molecules.
Micrometrics TriStar II system utilizes nitrogen gas for measuring specific surface area. Nitrogen
is not a reactive gas and its interaction with surfaces are dominated by attractive van der Waals forces between nitrogen molecules and the atoms forming the surface. After the attraction and attachment of a molecule to the surface both surface atoms and nitrogen molecule remain intact, and the molecule can be freed easily since the forces are small, and short-range. A major
characteristic of the physisorption is its strong dependence on the temperature; it diminishes rapidly with temperature elevation. Therefore, BET measurement is performed around liquid nitrogen temperature (77 K) where nitrogen gas is adsorbed physically and the rate of chemical reactions is diminishingly low.
Consider a gas with 𝑛 molecules present in a chamber. Then, a surface is introduced into the chamber (see figure 2.6). Some molecules are attached to the surface via physisorption
𝐴(𝑔) + 𝐵(𝑆) 𝐴𝑑𝑠𝑜𝑟𝑝𝑡𝑖𝑜𝑛 ⇌ 𝐷𝑒𝑠𝑜𝑟𝑝𝑡𝑖𝑜𝑛 𝐴𝐵 eq. 2.7
Where A is a gas molecule, B is an adsorption site on the surface, and AB is the complex formed by the adsorption of the atom on the surface.
23
At the dynamic equilibrium, nads molecules cover a fraction of the available sites on the surface
and a fraction (1 – θ) of the sites on the surface is unoccupied. Dynamic equilibrium means that the rate of gas molecules adsorbed is equal to the rate of molecules desorbed. These rates are related by the following equations to the gas pressure in the chamber:
𝑅𝑎𝑡𝑒 𝑜𝑓 𝑎𝑑𝑠𝑜𝑟𝑝𝑡𝑖𝑜𝑛 = 𝐾𝑎𝑃(1 − 𝜃) eq. 2.8
𝑅𝑎𝑡𝑒 𝑜𝑓 𝑑𝑒𝑠𝑜𝑟𝑝𝑡𝑖𝑜𝑛 = 𝐾𝑑𝜃 eq. 2.9
Equating the rates, the following is obtained:
𝐾𝑎𝑃(1 − 𝜃) = 𝐾𝑑𝜃 eq. 2.10
Solving this equation for θ, we get:
𝜃 = 𝐾𝑎𝑃
𝐾𝑑+𝐾𝑎𝑃 eq. 2.11
Dividing the numerator and denominator on right hand side by Kd, the following is obtained:
𝜃 = ( 𝐾𝑎 𝐾𝑑)𝑃 (𝐾𝑑 𝐾𝑑)+( 𝐾𝑎 𝐾𝑑)𝑃 eq. 2.12 If K is defined as 𝐾 ≡𝐾𝑎
𝐾𝑑 is defined, equation 2.11 can be written as:
𝜃 = 𝐾𝑃
1+𝐾𝑃 eq. 2.13
This is known as Langmuir Adsorption Equation. This equation can be written in an alternative form noting that 𝜃 =𝑛𝑎𝑑𝑠
𝑛𝐿 , where, as it was stated above, nL is the number of moles of gas which
can fully cover the surface by forming a monolayer. Thus,
𝑛𝑎𝑑𝑠
𝑛𝐿 = 𝐾𝑃
1+𝐾𝑃 eq. 2.14
24 𝑛𝑎𝑑𝑠 =
𝑛𝐿𝐾𝑃
1+𝐾𝑃 eq. 2.15
It is convenient to write equation 2.15 in terms of gas volumes. For this end, it is known that from the ideal gas law, 𝑃𝑉 = 𝑛𝑅𝑇, so that 𝑛𝑎𝑑𝑠 and nL can be, respectively, written as 𝑛𝑎𝑑𝑠 =
(𝑃/𝑅𝑇)𝑉𝑎𝑑𝑠 and 𝑛𝐿 = (𝑃/𝑅𝑇)𝑉𝐿 . Thus, equation 2.15 is rewritten as
𝑉𝑎𝑑𝑠= 𝑉𝐿𝐾𝑃
1+𝐾𝑃
eq. 2.16
Equation 2.15 is known as “type I isotherm” and has a general form as presented in figure 2.7. In the figure, the x-axis is selected to be P/P0, i.e., pressure normalized to saturation pressure; the
pressure of a vapor that is in equilibrium with its liquid. Equation 2.16 can be alternatively written as:
𝑉𝐿=
(1+𝐾𝑃)𝑉𝑎𝑑𝑠
𝐾𝑃 eq. 2.17
Equation 2.17 relates the quantities VL, K, and Vads to P. In practice, by measuring Vads at three or
more different values of P the equation can be solved for VL. Once this quantity is known, the
surface area of the sample can be measured as was described above.
Figure 2.7 A schematic representation of Type I isotherm [51].
A limitation of Langmuir’s theory is that it excludes formation of multiple layers of gas molecule on the surface. This assumption is not true in general. Thus, in 1938, Brunauer Emmett and Teller
25
extended Langmuir’s theory by introducing the absorption of several layers of gas on the surface. Here, only the counterpart of equation 2.16 is written, which is predicted by the BET theory [47],
𝑉𝑎𝑑𝑠 = 𝑉𝐿𝐶𝑃 (𝑃0−𝑃)[1+(𝐶−1)𝑃/𝑃0] eq. 2.18 (a) or 𝑛𝑎𝑑𝑠= 𝑛𝐿𝐶𝑃 (𝑃0−𝑃)[1+(𝐶−1)𝑃/𝑃0] eq. 2.18 (b) Where, 𝐶 = 𝑒𝑥𝑝 (𝑞1−𝑞2
𝑅𝑇 ), with q1 and q2, respectively, being the heat of adsorption of the first layer
and the heat of liquefaction of the gas. The BET theory is valid in the range 0.05 ≤ 𝑃/𝑃0 ≤ 0.35.
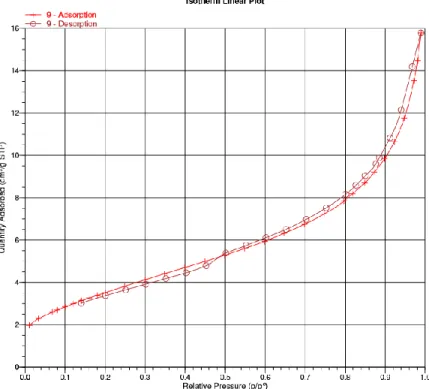
For nitrogen in temperature 77.3K, the constant C ranges between 50 and 300. Depending on the value of C, the isotherm can be of type I to type V. A type V isotherm, which typically represents the performed experiments, is presented in Figure 2.8.
Figure 2.8 An example of type IV isotherm adopted from performed experiments.
The critical components of micrometrics TriStar II instrument is presented in Figure 2.9 These include:, 1) Analysis manifold is a chamber with known volume and well controlled temperature, 2) Vacuum system with valve to enable evacuating manifold when required, 3) Source of adsorptive gas (typically, N2) with valve to fill the manifold when it is required, 4) Pressure
26
transducer and temperature sensor to characterize the gas in the manifold, 5) computer connection for acquiring temperature and pressure data, 6) A sample tube of precisely known free or void-space, 7) A valve for connecting the sample tube to the analysis manifold, and 8) A mechanism for reducing the temperature of the sample when required, (typically to liquid nitrogen (LN2 ) temperature).
Figure 2.9 Critical components of a BET analyzer [48].
The surface area measurement is performed in three stages, which are known as 1) preparation, 2) charging the manifold, and 3) sample dosing and pressure equilibration.
At the start of the preparation stage, the cold bath reservoir is in dawn position and the sample is at room temperature. The valve to nitrogen gas (valve 3) is closed and the sample valve (valve 7)
27
manifold are evacuated. Then, the cold bath reservoir is brought to up position and the sample is cooled down to low temperature.
Figure 2.10 BET analyzer at the stage of charging the manifold [48]
At the start of the “stage of charging the manifold”, which is schematically presented in Figure 2.10, the valves 2 and 6 are closed. Then, valve 3 is opened and nitrogen gas is allowed to fill the manifold until pressure arrives at Pm. From the ideal gas law of 𝑃𝑉 = 𝑛𝑅𝑇 the number of moles of
gas is found to be 𝑛𝑚= (𝑃𝑚𝑉𝑚/𝑅𝑇), where T is room temperature.
At the stage of “sample dosing and pressure equilibration”, which is schematically presented in Figure 2.11, Valve 6 is opened. A fraction of gas molecules go to the sample tube. A quantity 𝑛𝑎𝑑𝑠 of these molecules are adsorbed on the sample surface, and an amount 𝑛𝑒mole of gas is left
in the Manifold and the tube. As the gas molecules are adsorbed, the pressure in the manifold drops from the initial value of Pm and finally reaches an equilibrium value of Pe.
The amount of absorbed gas is given by 𝑛𝑎𝑑𝑠 = 𝑛𝑚− 𝑛𝑒. Assuming that only a small fraction of
28 𝑛𝑒= 𝑃𝑒(𝑉𝑚+𝑉𝑠) 𝑅𝑇 eq. 2.19 Accordingly, 𝑛𝑎𝑑𝑠 = 𝑃𝑚𝑉𝑚 𝑅𝑇 − 𝑃𝑒(𝑉𝑚+𝑉𝑠) 𝑅𝑇 = (𝑃𝑚−𝑃𝑒)𝑉𝑚−𝑃𝑒𝑉𝑠 𝑅𝑇 eq. 2.20
If the measurement is repeated for different amounts of Pe, the function 𝑛𝑎𝑑𝑠(𝑃𝑒) is obtained.
Using this function in equation 18b the quantity nL is calculated and the surface area of the
sample is found using equation 2.5.
Figure 2.11 BET analyzer at the stage of “sample dosing and pressure equilibration” [48].
29
2.2.2.2 Measurement
procedure
and results
Degassing conditions for Ag2O particles and AgNbO3 nanoparticles were selected to ensure the
reliability of the data. For this purpose, for the first trial both compounds were subjected to degassing conditions at 300 °C for an overnight time period. Upon performing surface area analysis, the isotherm plots generated from the BET measurements of AgNbO3 nanoparticles, in
contrast to Ag2O, had a typical trend. The anomaly was explained based on the fact that the
melting temperature of Ag2O at 300 oC [49] had reached during degassing and afterward the
particles made transitions to a more agglomerated solid. The melting temperature of AgNbO3
perovskites is around 650-800 °C [50], and the silver substituted compounds are expected to have melting temperatures at the same range. Thus, Ag2O degassing was repeated at 250 °C for
an overnight time period. In this second run, the BET measurements again failed to generate a typical isotherm plot. At this point it was postulated that presence of impurities may give a lower true melting point for the particle than its theoretic value. Moreover, literature review suggests that decomposition of Ag2O gradually begins to occur at anywhere above 100°C [51]. Since
evaporation and elimination of impurities occurs above 100°C it was decided to again degas Ag2O
at 110°C overnight. Again, no proper isotherm was generated upon BET measurement. This is where other possibilities were looked into to troubleshoot the problem. The sample amount was selected such that at least a surface area of around 1 m2/g is achieved. Thus, it was found that
the mass of powder in the case of perovskite nanoparticles should be around 250 mg and the mass of silver oxide nanoparticles should be selected around 3g. The input parameters on the software were selected as:
1. Surface area and pore size powder for analysis condition 2. Adsorptive properties of Nitrogen at 77.35 K
3. The measurement was reported for N2 gas
30
Figure 2.12 The isotherm plot for the case of AgNbO3 nanoparticles.
The measurement results for the specific surface of all particles along with simple statistical analysis are presented in Table 2.1. As it is observed the base perovskite nanoparticle, AgNbO3,
has a large specific surface area but the surface area of Ag2O is very low. In addition, in the table
average radius of the particles are included, calculated from equation 2.5 and assuming that they are in the form of spheres. It should be emphasized that the average crystallite size of these materials could be much smaller than the estimated particle size. This is due to the fact that the nano-sized crystallites could be agglomerated, thus hiding their surface for N2 adsorption.
Table 2.1 The measured specific surface values (in m2/g) and the calculated radii of the particle.
The densities for the perovskite nanoparticles are based on the calculations of reference [52].
AgNbO3 Ag2O
Average specific area (m2/g) 5.94 0.57
Standard deviation 0.81 0.07
Density (g/cm3) 6.80 7.10
Radius (nm) 74.30 681.51
![Figure 1.2 The chemical structures of some antibiotics adopted from reference [5].](https://thumb-eu.123doks.com/thumbv2/123doknet/2912034.75739/16.918.134.772.111.473/figure-chemical-structures-antibiotics-adopted-reference.webp)
![Figure 2.4 Bragg reflection from a set of crystal planes with a spacing dhkl [44].](https://thumb-eu.123doks.com/thumbv2/123doknet/2912034.75739/30.918.157.723.311.631/figure-bragg-reflection-set-crystal-planes-spacing-dhkl.webp)
![Figure 2.10 BET analyzer at the stage of charging the manifold [48]](https://thumb-eu.123doks.com/thumbv2/123doknet/2912034.75739/38.918.252.656.189.618/figure-bet-analyzer-stage-charging-manifold.webp)
![Figure 2.11 BET analyzer at the stage of “sample dosing and pressure equilibration” [48]](https://thumb-eu.123doks.com/thumbv2/123doknet/2912034.75739/39.918.229.673.416.824/figure-bet-analyzer-stage-sample-dosing-pressure-equilibration.webp)