_____________________________________________________________________________________________________ *Corresponding author: E-mail: souzaoliveiravini@gmail.com;
Estimation of Leaf Area by Linear Dimensions in
Coffea dewevrei
Omar Schmildt
1, Enilton Nascimento de Santana
2, Vinicius de Souza Oliveira
1*,
Rafael Ruy Gouvea
2, Lucas Corrêa Souza
2, Alba Nise Merícia Rocha Santos
2,
Sirlane Machado Silva
2, Karina Tiemi Hassuda dos Santos
1,
Gleyce Pereira Santos
1, Cesar Jose Fanton
2, Sara Dousseau Arantes
2and Edilson Romais Schmildt
31
Postgraduate Program in Tropical Agriculture, Federal University of Espírito Santo, São Mateus, ES, Brazil. 2Capixaba Institute for Research, Technical Assistance and Rural Extension, Regional Center for Rural Development, Linhares, ES, Brazil. 3
Departament of Agrarian and Biological Sciences, Federal University of Espírito Santo, São Mateus, ES, Brazil. Authors’ contributions This work was carried out in collaboration among all authors. Authors OS, ENS, VSO, RRG and LCS designed the study, performed the statistical analysis, wrote the protocol and wrote the first draft of the manuscript. Authors VSO, ERS, KTHS and GPS managed the analyses of the study. Authors ANMRS, SMS, CJF and SDA managed the literature searches. All authors read and approved the final manuscript. Article Information
DOI: 10.9734/IJPSS/2019/v28i630129 Editor(s): (1) Dr. Davide Neri, Professor, Polytechnic University of Marche - Via Brecce White, Ancona, Italy. Reviewers: (1)Zdzisław Kaliniewicz, University of Warmia and Mazury in Olsztyn, Poland.
(2)Syed Jamal, Haskell Indian Nations University, Kansas, USA. (3)R. Mahalakshmi, India. Complete Peer review History:http://www.sdiarticle3.com/review-history/50007
Received 05 May 2019 Accepted 12 July 2019 Published 19 July 2019
ABSTRACT
The objective of this research was to select the equation that best estimates the leaf area of the coffee tree Coffea dewevrei, from the linear dimensions of the leaves. For this purpose, 140 leaves of adult plants were collected from the Capixaba Institute for Research, Technical Assistance and Rural Extension, in the city of Linhares, North of the State of Espírito Santo, Brazil. The length (L), the width (W), the product of the multiplication between the length and width (LW) and the leaf area
Schmildt et al.;IJPSS, 28(6): 1-8, 2019; Article no.IJPSS.50007
observed (OLA) were determined from all leaves. For the modeling, a 100 leaves sample was used, where OLA was used as a dependent variable in function of L, W and LW as independent variable, being obtained the following models: linear first degree, quadratic and power. For the validation, a sample of 40 leaves was used, where the values of L, W LW were substituted in the equations generated in the modeling, thus obtaining the estimated leaf area (ELA). A simple linear equation model was fitted for each modeling equation relating ELA in function of OLA. The hypotheses H0: β0 = 0 versus Ha: β0 ≠ 0 and H0: β1 = 1 versus Ha: β1 ≠ 1, were tested using Student's t test at 5% probability. The mean absolute error (MAE), root mean square error (RMSE) and Willmott's index d for all equations were also determined. The best model that estimates the area of Coffea dewevrei was chosen through the following criteria: β0 not different from zero, β1 not different from one, MAE and RMSE values closer to zero and index d closer to the unit. The area of the leaves can be determined by its greater width (W), through the quadratic model equation ELA=-10.255+1.020(W)+1.293(W)2.
Keywords: Coffea dewevrei; non-destructive method; mathematical models.
1. INTRODUCTION
The coffee, originating in Africa and with a history of more than a thousand years, is a drink that every year surprises, gains fans, has its production increased and its quality improved [1]. In the literature for the coffee tree, 124 species are cataloged for the Coffea genus [2]. However, only Coffea arabica and Coffea canephora present significant economic importance. Other species such as Coffea liberica, Coffea
racemosa, Coffea dewevrei, Coffea eugenoides, Coffea congensis, Coffea stenophylla, are of
fundamental relevance in breeding programs [1]. In this context, the Coffea dewevrei species has important attributes, such as resistance to rust (Hemileia vastatrix), to some nematodes [3], and to Leucoptera coffeella [4], considered as one of the main phytosanitary problems of coffee [5], in addition to dry tolerance [6].
Coffee Coffea dewevrei, also known as Excelsa coffee, is self-incompatible [7] and highly productive [6]. The plants can reach eight to ten meters in height, and their leaves are large, measuring about 26 cm long and 13 cm wide, and coriaceous [8].
The amount of leaf area is indicative of crop productivity [9], and is also fundamental for physiological studies involving growth analysis, transpiration, and in research to quantify damage caused by pests and foliar diseases [10].
The measurement of leaf area can be done directly and indirectly [11]. In order to determine the leaf area directly, generally all the leaves of the plant are collected, characterizing the method as destructive and high labor, besides being
considered expensive equipment, such as planimeters. However, the indirect and
non-destructive methods allow successive
evaluations in the same plant and rapidity in the evaluations [12], and are therefore more convenient and cheaper [13]. In the indirect methods, portable automatic planimeters are used, sometimes with the disadvantage that the larger leaves cannot be evaluated by limiting the reading area of the portable equipment [14], it is still used mathematical models, using leaf blade length and width [12], to which they generally involve the use of regression equations, as in
Coffea arabica coffee trees [15,11,16], and Coffea canephora [17,15,18], however, in the
literature there is no evidence of studies with
Coffea dewevrei, therefore, it is important to
obtain them, since it is known that temporal variation of leaf area in an agricultural crop depends on cultivar, edaphoclimatic conditions, and population density, among other factors [19]. In this work we aimed to select the equation that best fits the determination of the leaf area of the coffee tree Coffea dewevrei, rom the linear dimensions of the length, the maximum width and the product between them.
2. MATERIALS AND METHODS
The determination of the coffee leaf area (Coffea
dewevrei) was made in leaves from adult plants,
at the initial stage of grain formation. These leaves were collected in May 2019 at the headquarters of the Capixaba Institute for Research, Technical Assistance and Rural Extension, in the municipality of Linhares, in the north of the State of Espírito Santo, Brazil, located at the geographical coordinates 19°25' 03'' south latitude and 40°04'50'' west longitude.
The leaves were harvested from six year old plants. A total of 140 leaves of different growth
sizes were collected, obeying the four
cardinal points (north, south, east and west) distributed in the lower, middle and upper third of the plant.
The length (L, in cm), along the central midrib and greater width (W, in cm) of the leaf blade were measured from all leaves (Fig. 1), both measurements were made with ruler graduated in millimeters. The product of multiplication between length and width (LW, in cm
calculated. The observed leaf area (OLA, in cm was obtained with the LI-COR® portable analyzer model LI-3000C (Fig. 2).
For the generation of the models that estimate the leaf area, a 100 leaf sample was used, where OLA was used as a dependent variable in function of L, W and LW as independent variable, and the following models were obtained: linear
Fig. 1. Representation of the length (L) along the midrib and the maximum width (W) of leaves
Fig. 2. Representation of the LI
The leaves were harvested from six year old plants. A total of 140 leaves of different growth
collected, obeying the four cardinal points (north, south, east and west)
distributed in the lower, middle and upper third of
The length (L, in cm), along the central midrib and greater width (W, in cm) of the leaf blade sured from all leaves (Fig. 1), both measurements were made with ruler graduated in millimeters. The product of multiplication between length and width (LW, in cm2) was also calculated. The observed leaf area (OLA, in cm2) portable analyzer
For the generation of the models that estimate the leaf area, a 100 leaf sample was used, where OLA was used as a dependent variable in function of L, W and LW as independent variable, ere obtained: linear
first degree (ELA = β + β x), quadratic (
β + β x + β x ) and power (ELA =
respective coefficient of determination (R totaling nine equations for the estimation of the leaf area of Coffea dewevrei.
The validation of the models was based on a sample of 40 sheets specially designed for this purpose. For this, the values of L, W LW were substituted in the equations generated in the modeling, thus obtaining the estimated leaf area (ELA, in cm2) for each equation. Subsequen simple linear equation model (ELA
was adjusted for each modeling equation relating ELA in function of OLA. The hypotheses H 0 versus Ha: β0 ≠ 0 and H0: β1 = 1 versus Ha: β
≠ 1, were tested using Student's t test at 5% probability. The mean absolute error (MAE), root mean square error (RMSE) and Willmott's index d [20] for all equations were also determined by equations 1, 2 and 3.
Fig. 1. Representation of the length (L) along the midrib and the maximum width (W) of leaves of Coffea dewevrei
Fig. 2. Representation of the LI-COR® portable analyzer model LI-3000
), quadratic (ELA = = β xβ ) and its
respective coefficient of determination (R2), totaling nine equations for the estimation of the
models was based on a sample of 40 sheets specially designed for this of L, W LW were substituted in the equations generated in the modeling, thus obtaining the estimated leaf area ) for each equation. Subsequently, a ELA = β + β x ) was adjusted for each modeling equation relating ELA in function of OLA. The hypotheses H0: β0 =
= 1 versus Ha: β1
≠ 1, were tested using Student's t test at 5% e mean absolute error (MAE), root mean square error (RMSE) and Willmott's index d [20] for all equations were also determined by
Fig. 1. Representation of the length (L) along the midrib and the maximum width (W) of leaves
Schmildt et al.;IJPSS, 28(6): 1-8, 2019; Article no.IJPSS.50007
Fig. 3. Values of the measurements of the length (L) (A), width (W) (B), product of length with width (LW) (C) and observed leaf area (OLA) (D) of leaves used for modeling and validation
MAE = ∑ |ELA − OLA| (1) RMSE = ∑ (ELA − OLA) (2)
d = 1 − ∑ ( )
∑ (| | | |) (3)
Where, ELA represents the estimated leaf area; OLA the observed value of leaf area; OLA is the average of the leaf area values observed; and n is the number of sheets sampled for validation (n = 40 in the present study).
The best model that estimates the area of Coffea
dewevrei was chosen through the following
criteria: linear coefficient (β0) not different from
zero, angular coefficient (β1) not different from
one, MAE and RMSE values closer to zero and index d closer to the unit. For the statistical analyzes, the software R [21] was used, with the aid of the data package ExpDes.pt version 1.2 [22].
3. RESULTS AND DISCUSSION
The values of the measurements of the length (L), width (W), product of length with width (LW) and observed leaf area (OLA) of the leaves used for modeling (100 leaves) and validation (40
leaves) are shown in Fig. 3. It was verified that for all the variables under study the values of the sample used in the validation were between the range of the values of the sheets sampled for the adjustment of the modeling, according to Levini et al. [23] is adequate since the values used in the validation should not extrapolate the values of the modeling since this practice can lead to erroneous estimation by the equations. The results also show a high amplitude in the values obtained for the modeling indicating the use of leaves of different sizes with the presence of leaves of different development stages, being a well representative sample, which allows the use of the equations throughout the crop cycle [24,25].
The adjusted equations for the estimation of the area of the leaves of Coffea dewevrei, as well as their respective coefficient of determination (R2), are presented in Table 1. Note that, in general, there was a satisfactory adjustment between OLA and leaf surface measurements (L, W or LW), with R2 exceeding 0.94 for all models, indicating that the characteristics have a good correlation with more than 94% of the area leaf being explained by the linear measurements of the leaf. However, the choice of the best fit should not only be based on the high values of R2, since this practice can lead to imprecise estimates of the leaf area [15], and it is
necessary to verify the models by suitable validation criteria [26].
The criteria used to validate the nine adjusted equations are shown in Table 2. The validation is important to confirm the accuracy of the equations allowing its use in estimation of field leaf area [27]. In this way, note that of the nine equations tested, only the linear first degree and quadratic models generated from the width (W) presented a linear coefficient β statistically equal to zero and angular coefficient ( β ) statistically equal to one. This finding is very important because, according to Toebe et al. [28] indicates precision of these models in the estimated leaf area, once the observed leaf area is zero, the values estimated by the equation will also be zero and as 1 cm2 of the observed leaf area increases, the equation will add 1 cm2 in the estimated leaf area. However, considering these two equations, the quadratic model presented values of mean absolute error (MAE) and root mean square error (RQME) closest to zero, in addition to the value of the index d closest to the unit, which suggests a more predictive leaf area of Coffea dewevrei by this model.
Notoriously, several authors have reported in the literature models of mathematical equations that estimate the leaf area of several coffee varieties [15,18,29,16]. In specific cases, the model adjusted for a given variety can be used to estimate leaf area of other varieties [30]. However, for most species each variety presents a pattern of different leaf morphology requiring different equations [27], as observed by Espindula et al. [29] for the coffee tree.
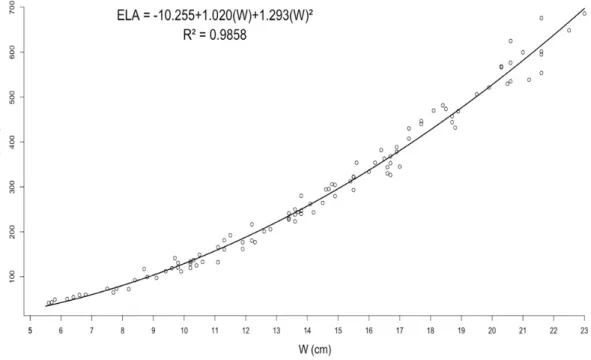
For this reason, in this work we indicate the quadratic model equation represented
by ELA = −10.255 + 1.020(W) + 1.293(W)
obtained from the largest width of the leaf surface, whose behavior can be seen in Fig. 4, for being the most accurate in the estimation of the leaf area of Coffea dewevrei. The use of
these equations in practice, allows the
measurement of leaf area for studies related to
physiology, agronomic performance and
evaluation of phytosanitary damages [27]. In addition, this is a non-destructive method where the leaf area can be measured by simply measuring the length of the leaf without the use of specific and expensive equipment, which can be obtained with the help of a ruler.
Fig. 4. Equation of quadratic model and determination coefficient (R2), using the foliar area observed (OLA) as dependent variable, in function of the width (W) of leaves Coffea dewevrei
Schmildt et al.;IJPSS, 28(6): 1-8, 2019; Article no.IJPSS.50007
Table 1. Equation with linear adjustment of first degree, quadratic and power and its respective coefficient of determination (R2) using the observed leaf area (OLA) as dependent variable, in
function of length (L), width (W), product of length with width (LW) of leaves Coffea dewevrei
Model Equation R2 Linear ELA = −240.2285 + 19.1133(L) 0.9438 Linear ELA = −242.9450 + 37.6048(W) 0.9607 Linear ELA = −7.9437 + 0.6904 (LW) 0.9923 Quadratic ELA = 6.6028 − 0.8532(L) + 0.3629(L) 0.9700 Quadratic ELA = −10.255 + 1.020(W) + 1.293(W) 0.9858 Quadratic ELA = −1.84249928 + 0.65569642(LW) + 0.00003585(LW) 0.9925 Power ELA = 0.3030(L) . 0.9700 Power ELA = 1.2518(W). 0.9856 Power ELA = 0.5409(LW) . 0.9925
Table 2. Linear coefficient ( ), angular coefficient ( ) and determination coefficient (R2), obtained from equations with first line linear adjustment between Observed Leaf Area (OLA) and Estimated Leaf Area (ELA) by length (L), width (W) and length product with the width (LW)
of leaves Coffea dewevrei used for validation, besides the Mean Absolute Error (MAE), Root Mean Square Error (RMSE) and Willmott d Index
Model Variable β0(1) β1(2) R2 MAE RMSE d
Linear L 77.22202* 0.81777* 0.7993 49.9785 61.8682 0.9138 Linear W 5.42754ns 0.98986ns 0.7804 47.6024 58.1432 0.9339 Linear LW 31.71138* 0.85933* 0.8159 39.6977 47.3674 0.9487 Quadratic L 64.95468* 0.79508* 0.8088 40.1321 52.0069 0.9350 Quadratic W 20.80696ns 0.90213ns 0.8071 42.4635 49.5631 0.9465 Quadratic LW 33.37097* 0.84877* 0.8160 39.5509 47.2243 0.9484 Power L 65.19517* 0.79474* 0.8088 40.1915 52.0804 0.9348 Power W 12.76778ns 0.87648* 0.8050 45.0336 51.3635 0.9348 Power LW 32.1960* 0.85341* 0.8163 39.5838 47.2339 0.9487 (1) ns
Value of β0 does not differ from zero by Student's t-test, at a level of 5% (1) *
Value of β0 differs from zero by Student's t-test, at a level of 5% (2) ns
Value of β1 does not differ from one, by Student's t-test, at a level of 5% (2) *
Value of β1 differs from one, by Student's t-test, at a level of 5%
4. CONCLUSION
The area of the leaves of Coffea dewevrei can be determined by its greater width (W), through the equation of quadratic
model represented by ELA = −10.255 +
1.020 (W) + 1.293(W) , precise and
non-destructive way.
COMPETING INTERESTS
Authors have declared that no competing interests exist.
REFERENCES
1. Ferrão RG, Fonseca AFA, Ferrão MAG,
Muner LH. Coffea canephora. In: Ferrão RG, Fonseca AFA, Ferrão MAG, Muner LH. Café Conilon. 2 ed. Vitoria: Incaper. 2017;37-53.
2. Davis AP, Tosh J, Ruch N, Fay MF.
Growing coffee: Psilanthus (Rubiaceae) subsumed on the basis of molecular and morphological data, implications of size, morphology, distribution and evolutionary history of Coffee. Botenical Journal of Rehinneon Society. 2011;167:1-21. Available:https://doi.org/:10.1111/j.1095-8339.2011.01177.x
3. Fazuoli LC. Resistance of coffee to the root-knot nematode species Meloidogyne
exigua and Meloidogyne incognita. ln:
Colloque international sur la protection des cultures tropicales, Lyon. Resumes. Lyon, Fondation Scientifique de Lyon et du Sud.-Est. 1981;57.
4. Medina Filho HP, Carvalho A, Monaco LC.
Melhoramento do cafeeiro: XXXVII.
Observações sobre a resistência do cafeeiro ao bicho mineiro. Bragantia. 1977; 36(1):131-137.
Available:https://doi.org/10.1590/S0006-87051977000100011
5. Otoboni CEM. Eficiência do controle de nematóides, ferrugem e bicho mineiro em cafeeiros. 102f. Tese (Doutorado em
Agronomia) - Universidade Estadual
Paulista, Faculdade de Ciências Agrárias e Veterinárias, Jaboticabal; 2003.
6. Krug CA, Carvalho A. Melhoramento do
cafeeiro V - Melhoramento por hibridação. Bragantia. 1952;12(4-6):141-152.
Available:https://doi.org/10.1590/S0006-87051952000200003
7. Medina DM, Conagin CHTM.
Auto-incompatibilidade em Coffea dewevrei de Wild. Et Th. Dur. Bragantia. 1959;18(19): 283-293.
Available:https://doi.org/10.1590/S0006-87051959000100019
8. Carvalho A, Fazuoli LC, Teixeira AA,
Guerreiro Filho O. Use of Excelsa coffee in blends with Arabica. Bragantia. 1990; 49(2):335-343.
Available:https://doi.org/10.1590/S0006-87051990000200013
9. Flumignan DL, AdamI M, Faria RT. Leaf area of entire and damaged leaves of coffee determined by leaf dimensions and digital image. Coffee Science. 2008;3(1): 1-6.
10. Silva WZ, Brinate SVB, Tomaz MA, Amaral
JFT, Rodrigues WN, Martins LD. Métodos de estimativa de área foliar em cafeeiro. Enciclopédia Biosfera. 2011;7(13):746-759.
11. Schmildt ER, Amaral JAT, Schmildt O, Santos JS. Comparative analysis of mathematical equations to estimate leaf area in coffee trees. Coffee Science. 2014; 9(2):155-167.
12. Toebe M, Cargnelutti Filho A, Loose LH, Heldwein AB, Zanon AJ. Leaf area of snap bean (Phaseolus vulgaris L.) according to
leaf dimensions. Semina: Ciências
Agrárias. 2012;33(1):2491-2500. Available:https://doi.org/10.5433/1679-0359.2012v33Supl1p2491
13. Sarker SK, Das N, Chowdhury MQ, Haque
MM. Developing allometric equations for estimating leaf area and leaf biomass of Artocarpus chaplasha in Raghunandan Hill Reserve, Bangladesh. Southern Forests, 2013;75(1):51-57.
Available:https://doi.org/10.2989/20702620 .2013.773601
14. Schmildt ER, Martin JJH, González JC. modelos alométricos para determinação
da área foliar de uva de mesa ‘sugraone’ em casa de vegetação e área livre.
Ciência e Técnica Vitinícola. 2014;
29(10):61-81.
15. Antunes WC, Pompelli MF, Carretero DM,
DaMatta FM. Allometric models for
nondestructive leaf area estimation in
coffee (Coffea arabica and Coffea
canephora). Annals of Applied Biology.
2008;153:33-40.
Available:https://doi.org/10.1111/j.1744-7348.2008.00235.x
16. Misgana Z, Daba G, Debela A. Modeling leaf area estimation for arabica coffee (Coffea arabica L.) grown at different altitudes of mana district, jimma zone. American Journal of Plant Sciences. 2018; 9:1292-1307.
Available:https://doi.org/10.4236/ajps.2018 .96095
17. Partelli FL, Vieira HD, Detmann E,
Campostrini E. Estimative of leaf foliar area of coffea canephora based on leaf length. Revista Ceres. 2006;53(306):204-210.
18. Schmildt ER, Amaral JAT, Santos JS,
Schmildt O. Allometric model for estimating leaf area in clonal varieties of coffee
(Coffea canephora). Revista Ciência
Agronômica. 2015;46(4):740-748. Available:https://doi.org/10.5935/1806-6690.20150061
19. Monteiro JEBA, Sentelhas PC, Chiavegato
EJ, Guiselini C, Santiago AV, Prela A. Cotton leaf area estimates based on leaf
dimensions and dry mass
methods. Bragantia. 2005;64(1):15-24. Available:https://doi.org/10.1590/S0006-87052005000100002
20. Willmott CJ. On the validation of models. Physical Geography. 1981;2(2):184-194. Available:https://doi.org/10.1080/02723646 .1981.10642213
21. R Core Team. R: A language and
environment for statistical computing. Vienna: R Foundation for Statistical Computing. Vienna, Austria; 2018.
22. Ferreira EB, Cavalcanti PP, Nogueira DA. Package ‘ExpDes.pt’; 2018.
23. Levine DM, Stephan DF, Szabat KA.
Estatistic for managers using Microsoft Excel: Global edition (8th ed., p. 728). London: Person; 2017.
24. Cargnelutti Filho A, Toebe M, Burin C, Fick AL, Casarotto G. Estimate of leaf area of forage turnip according to leaf dimensions. Bragantia. 2012;71(1):47-51.
Schmildt et al.;IJPSS, 28(6): 1-8, 2019; Article no.IJPSS.50007
25. Oliveira VS, Galote JKB, Damaceno IV, Furtado NS, Santos KTH, Santos JSH, Santos GP, Chisté H, Schmildt O, Czepak MP, Arantes SD, Vitória EL, Schmildt ER. Estimation of Single Leaf
Area of Acacia mangium
Willd. International Journal of Plant & Soil Science. 2019;28(3):1-7.
Available:https://doi.org/10.9734/ijpss/2019 /v28i330107
26. Fascella G, Darwich S, Rouphael Y.
Validation of a leaf area prediction model proposed for rose. Chilean Journal of Agricultural Research. 2013;73(1):73-76. Available:http://doi.org/10.4067/S0718-58392013000100011
27. Borghezan M, Gavioli O, Pit FA, Silva AL.
Mathematical models for leaf area
estimative of the grapevine cultivars (Vitis
vinifera L.). Ciência Técnica e Vitivinicola.
2010;25(1):1-7.
28. Toebe M, Souza RR, Mello AC, Melo PJ, Segatto A, Castanha AC. Leaf area estimation of squash ‘Brasileirinha’ by leaf dimensions. Ciência Rural. 2019;49:1-11. 29. Espindula MC, Passos AMA, Araújo LFB,
Marcolan AL, Partelli FL, Ramalho AR. Indirect estimation of leaf area in genotypes of 'Conilon' coffee (Coffea
canephora Pierre ex A. Froehner). Australian Journal of Crop Science. 2018; 12(6):990-994.
Available:https://doi.org/10.21475/ajcs.18.1 2.06.PNE1090
30. Tsialtas JT, Koundouras S, Zioziou E. Leaf area estimation by simple measurements and evaluation of leaf area prediction models in Cabernet-Sauvignon grapevine leaves. Photosynthetica. 2008;46(3):452-456.
Available:https://doi.org/10.1007/s11099-008-0077-x
________________________________________________________________________________
© 2019 Schmildt et al.; This is an Open Access article distributed under the terms of the Creative Commons Attribution License (http://creativecommons.org/licenses/by/4.0), which permits unrestricted use, distribution, and reproduction in any medium, provided the original work is properly cited.
Peer-review history:
The peer review history for this paper can be accessed here: http://www.sdiarticle3.com/review-history/50007