HAL Id: hal-02963190
https://hal.archives-ouvertes.fr/hal-02963190
Submitted on 5 Nov 2020
HAL is a multi-disciplinary open access
archive for the deposit and dissemination of
sci-entific research documents, whether they are
pub-lished or not. The documents may come from
teaching and research institutions in France or
abroad, or from public or private research centers.
L’archive ouverte pluridisciplinaire HAL, est
destinée au dépôt et à la diffusion de documents
scientifiques de niveau recherche, publiés ou non,
émanant des établissements d’enseignement et de
recherche français ou étrangers, des laboratoires
publics ou privés.
Copyright
Salim Chaki, Walid Harizi, Patricia Krawczak, Gérard Bourse, Mohamed
Ourak
To cite this version:
Salim Chaki, Walid Harizi, Patricia Krawczak, Gérard Bourse, Mohamed Ourak. Structural health
of polymer composites: Non-destructive diagnosis using a hybrid NDT approach. JEC Composites,
2016, pp.62-65. �hal-02963190�
N
on-destructive testing (NDT) methods have proved to be inval-uable both in detecting initial defects and assessing the damage process of polymer composites [1]. Recent NDT applications for damage monitoring include the use of non-contact optical [2-4], thermal [5, 6] or acoustic-based [1, 7-9] techniques. Such methods have had some success in characterizing the damage behaviour of com-posite materials. However, a more global NDT approach is required to efficiently and reliably track and quantify both damage initiation and subsequent damage evolution [10], i.e. to go towards efficient structur-al hestructur-alth monitoring for preventive maintenance purposes. Therefore, Mines Douai suggested a hybrid NDT approach to evaluate compos-ites damage under mechanical loading in a more comprehensive man-ner [11]. This approach uses five different NDT techniques in situ and in real time: bulk and guided ultrasonic waves [1], acoustic emission, passive [5] and active infrared thermography [6].Composite materials
A cross-ply E-glass/epoxy laminate (prepreg) with a [0/90/90/0] stacking sequence and a 54% fibre volume fraction was chosen to im-plement the hybrid NDT approach. Plates were compression-mould-ed at 120°C for 60 min. Tensile tests were performcompression-mould-ed according to the ISO 527-5 standard.
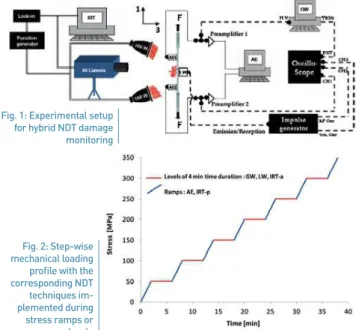
Experimental setup for the hybrid NDT approach
Figure 1 shows the experimental setup including the five NDT meas-urements in situ and in real-time. Three piezoelectric probes were fixed to the composite sample, named AE1 and AE2 for the two
iden-tical acoustic emission (AE) sensors (125-750 kHz), and longitudinal waves (LW) for the bulk pulse-echo longitudinal wave transducer (5 MHz frequency and 13-mm diameter) placed for a normal beam in-cidence on the other face of the sample. For acoustic emission, the acquisition threshold of the acoustic events was fixed at 30 dB in order to avoid surrounding noises. The AE1 probe also acts as an emitter, when excited by a high-voltage function generator, in order to gener-ate guided waves (GW), namely the S0 mode, at a frequency of 200 kHz, with the AE2 probe ensuring the reception of the GW. An IR camera (320x240 pixels with a temperature sensitivity of 10 mK) was
Structural health of polymer composites:
non-destructive diagnosis using a hybrid NDT approach
A hybrid non-destructive testing (NDT) approach has been developed to
characterize composites damage using simultaneously bulk and guided
ultrasonic waves, acoustic emission, and passive and active infrared
thermography. Combining multiple NDT techniques makes it possible to
optimize the diagnosis of a material’s structural health.
S. CHAKI, Associate Professor W. HARIZI, PhD Student P. KRAWCZAK, Professor G. BOURSE, Associate professor
Polymers and Composites Technology & Mechanical Engineering Department, Mines Douai
M. OURAK, Professor
Valenciennes University, IEMN-DOAE
Fig. 1: Experimental setup for hybrid NDT damage monitoring
Fig. 2: Step-wise mechanical loading profile with the corresponding NDT techniques im-plemented during stress ramps or levels
placed in front of the specimen in order to measure its surface temper-ature in real-time during the mechanical loading (passive thermogra-phy, hereafter abbreviated IRT-p) as well as during the heating of the sample by two halogen lamps (320 W, with a three-cycle sinusoidal signal of 0.1 Hz), and then during its cooling (active thermography, hereafter abbreviated IRT-a).
The mechanical loading was applied at room temperature with a cross-head speed of 0.5 mm/min using a standard tensile machine accord-ing to the loadaccord-ing profile shown in Figure 2, which consists in a step-wise tensile test of 50 MPa each time (7 ramps and 6 levels of 4 min duration). The thermal scene (specimen under loading, lamps and IR camera) was isolated from the external environment using an opaque and insulating curtain. During the ramps, the AE and passive thermal activity of the composite specimen were acquired in real-time by, re-spectively, the AE1-AE2 sensors and the IR camera. The GW, LW and IRT-a measurements were applied sequentially (GW before LW, then IRT-a to avoid potential harmful interference) during the constant stress levels and before the first ramp. The sample cooling phase under constant stress, for 125 s after heating by the lamps, was monitored by the infrared camera and the cooling rate was measured for each con-stant applied stress.
Damage assessment
Raw data analysis
Glass fibre-reinforced plastics are not very heat-dissipative under stat-ic tensile loading (see Figure 3). During the first five loading ramps, almost no damage was detected on the thermal maps, which were uniform over the entire surface of the specimen. During the 6th ramp, three damaged areas were identified, labelled 1, 2 and 3 on the corre-sponding thermal map. Both areas 1 and 3 were rather large and dif-fused heat for a long time (over 102 seconds), while area 2 was thin with very brief heat diffusion (flash lighting for about 4 seconds). The two damaged zones 1 and 3 may be ascribed to localized delamination between the 0° and 90° plies, whereas the longitudinal damaged zone
2 corresponds to a fibre/matrix debonding area located on the 0° ply on the rear face of the specimen. During the 7th ramp, the final failure of the specimen gave rise to a very high heat emission.
The acoustic activity during the applied stress ramps is illustrated in Figure 4 in terms of amplitude vs time. Once loading started, the acoustic emission began with low amplitudes (38 to 50 dB) and grad-ually became denser and higher as the load increased. The growth of the acoustic emission events in terms of quantity and amplitude in-dicates that the damage induced in the material was heterogeneous, including different mechanisms such as matrix cracking, fibre/matrix debonding, delamination and fibre rupture [12].
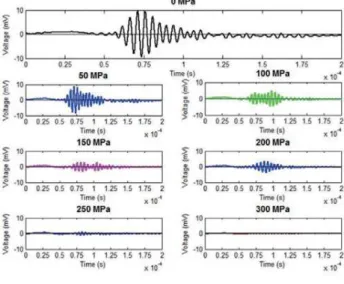
The guided wave signals (S0 Lamb mode) are shown in Figure 5 for stress-free conditions and for the six applied stress levels. The signal amplitudes decrease sharply and continually until the transmitted ul-trasonic energy at the highest stress level totally disappears. This am-plitude decrease is due to the damage induced in the material,
result-Fig. 3: Thermal maps under the applied tensile stress ramps
Fig. 4: Acoustic emission amplitude under the applied tensile stress ramps
Fig. 5: Guided waves during the applied tensile stress levels
ing in multiple scatters that certainly weaken the signals.
A global characterization of the material damage and its quantitative monitoring under different mechanical loading further requires the calculation of certain damage indicators.
Definition and analysis of damage indicators
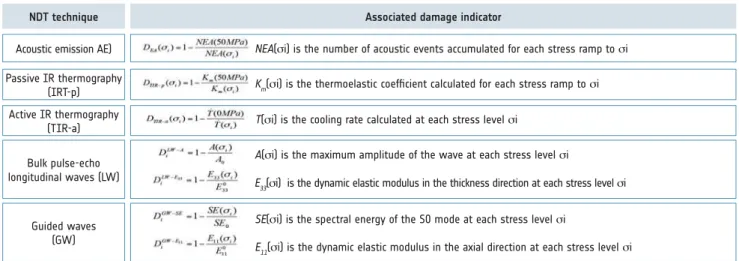
Table 1 defines seven damage indicators (dimensionless variables nor-malized between 0 and 1) representing a relative variation of certain physical characteristics of the material obtained from the five NDT techniques.
Figure 6 shows the evolution of the previously defined damage indica-tors versus applied stresses. Each damage indicator value corresponds to the mean of five measurements obtained on five samples with a maximum standard deviation of 1%. These damage indicator evolu-tions indicate the damage initiation from the same stress value (50 MPa), which can be considered as a damage threshold of the tested material. They also indicate that damage increases as the stress increas-es, but with different sensitivitiincreas-es, which are due to the anisotropic and multi-scale features of the induced damage.
Actually, the GW used in the axial direction is more sensitive to the damage that occurs parallel to the loading direction. This axial
dam-age was evaluated by measuring both the variations of the spectrum energy (DGW-SE) and the axial elastic modulus (DGW-E11), which reach respectively 100% and 60% at the material failure. The LW propagat-ing in the through-thickness direction examines the material perpen-dicularly to the loading direction, where the variation due to the elastic constant (E33) versus the applied stress is very small [12]. Therefore, this small variation may not reflect the real extent of the induced dam-age. However, the measured attenuation of the LW in the thickness direction becomes increasingly higher as the stress increases. This at-tenuation could be due to multiple reflections of the ultrasonic beam with the discontinuities created in the material, which grow more and more as the stress increases. Therefore, the defined damage indicator,
DLW-A associated with the maximum back-wall amplitude variation of the LW, allows a more realistic evaluation of the damage induced in the thickness direction.
On the other hand, the AE sensors can detect signals coming from any direction and take into account all damage mechanisms from the mi-croscopic (matrix cracking, matrix/fibre debonding, fibre breakage) to the macroscopic (delamination) scale. These are the reasons why the associated damage indicator (DAE) is higher.
At last, the thermography measurements are exploited differently when compared with previous conventional analyses (based on ther-mal images or temperature variation curves). Concerning passive thermography, the thermoelastic coefficient (K) is measured as well as its variation for each applied stress interval of 50 MPa up to failure. The associated damage indicator (DIRT-p) increases continuously when the stress increases. Concerning the active infrared thermography meas-urement, the associated damage indicator (DIRT-a) also increases con-tinuously when the stress level increases. This means that the material cools more and more quickly when the damage increases.
Conclusion
The proposed hybrid NDT approach makes it possible to accurately characterize the mechanical damage of composite materials. Its bene-fit is a more efficient interpretation of the damage characteristics and their cross-validation in order to increase the reliability of the moni-toring strategy, based on an original definition of damage indicators that provides a quantitative evaluation of the material’s damage state.
NDT technique Associated damage indicator
Acoustic emission AE)
Guided waves (GW)
NEA(mi) is the number of acoustic events accumulated for each stress ramp to mi
E33(mi) is the dynamic elastic modulus in the thickness direction at each stress level mi Passive IR thermography
(IRT-p) Km(mi) is the thermoelastic coefficient calculated for each stress ramp to mi
SE(mi) is the spectral energy of the S0 mode at each stress level mi Bulk pulse-echo
longitudinal waves (LW) Active IR thermography
(TIR-a)
A(mi) is the maximum amplitude of the wave at each stress level mi T(mi) is the cooling rate calculated at each stress level mi
E
11(mi) is the dynamic elastic modulus in the axial direction at each stress level mi
Tab. 1: Definition of the damage indicators associated to the NDT techniques used
On-going work addresses the issue of data fusion (see figure 7), com-bining the results of the five NDT techniques in order to help users make decisions about the damage state of industrial composite struc-tures.
More information: http://tpcim.mines-douai.fr/ salim.chaki@mines-douai.fr References [1] Harizi W. et al., Mechanical damage characterization of glass fiber-reinforced polymer laminates by ultrasonic maps. Composites Part B. 2015; 70:131-137. [2] Canal L.P. et al., Application of digital image correlation at the microscale in fiber-reinforced composites. Composites Part A. 2012; 43:1630-38. [3] Heinz S.R., Wiggins J.S., Advanced analysis of yield characteris-tics of composite polymer matrices using digital image correlation.
SAMPE, Baltimore, MD, USA; May 18-21, 2009. [4] Gao X. et al., Study on mechanical properties and damage be-haviors of Kevlar fiber reinforced epoxy composites by digital image correlation technique under optical microscope. Proc. SPIE 7657, 5th International Symposium on Advanced Optical Manufacturing and Testing Technologies: Design, Manufacturing, and Testing of Micro- and Nano-Optical Devices and Systems, 76571L, October 21, 2010.
[5] Harizi W. et al., Mechanical damage assessment of glass fi-bre-reinforced polymer composites using passive infrared thermog-raphy. Composites Part B. 2014; 59: 74-79. [6] Harizi W. et al., Mechanical damage assessment of polymer matrix composites using active infrared thermography. Composites Part B. 2014; 66: 204-209. [7] Loutas T.H. et al., Fatigue damage monitoring in carbon fiber reinforced polymers using the acousto-ultrasonics technique. Polym. Compos. 2010; 31:1409-17. [8] Bentahar M., El Guerjouma R., Monitoring progressive damage in polymer-based composites using nonlinear dynamics and
acous-tic emission. J. Acousacous-tical Soc. Am. 2009; 125(1). EL39-44. [9] Reis P. et al., Fatigue damage characterization by NDT in polypropylene/glass fibre composites. Appl. Compos. Mater. 2011; 18:409-19. [10] Talreja R., Damage and fatigue in composites – a personal
account. Compos. Sci. Technol. 2008; 68(13):2585-91. [11] Chaki S. et al., Multi-technique approach for non destructive diagnostic of structural composite materials using bulk ultrasonic waves, guided waves, acoustic emission and infrared
thermogra-phy, Composites Part A. 2015; 78:358-361. [12] Harizi W., Caractérisation de l’endommagement des composites
à matrice polymère par une approche multi-technique non destruc-tive. PhD thesis. Mines Douai and UVHC, France. 2012