Vanlierde A.(1); Froidmont E.(2); Soyeurt H.(3, 4);Dardenne P.(1) and Dehareng F.(1)
(1) Walloon Agricultural Research Centre (CRA-W), Valorisation of Agricultural Products Department, 24 Chaussée de Namur, 5030 Gembloux (Belgium); (2) CRA-W, Products and Sectors Department, 8 Rue de Liroux, 5030 Gembloux (Belgium);
(3) University of Liège, Gembloux Agro-Bio Tech, Animal Science Unit, 2 Passage des Déportés, 5030 Gembloux (Belgium); (4) National Fund for Scientific Research (FRS-FNRS), 5 Rue d’Egmont, 1000 Bruxelles (Belgium).
Development of a method to predict
individual enteric methane emissions from cows
based on milk mid-infrared spectra
Objectives
Results and discussion
Materials and methods
Conclusion
Reducing enteric methane emissions from dairy cattle through the development of a method to predict those emissions from each dairy cow based on mid-infrared spectra of individual milk.
The results are very encouraging and it seems possible to predict individual emissions of CH4 through the MIR spectra of milk.
More data should be collected in order to confirm this trend and improve the reliability of predictions. Then this equation can be used to select cows which are high milk producers and low methane emitters but also to define which diets, herd management, etc. are the most appropriate to reduce methane emissions.
Searching for CH4 variability
Four trials were conducted (Table 1)
CH4/24h X 5 days (CH4 /kg milk)
50 ml of individual milk AM and PM 2 MIR spectra/day
Average daily milk spectrum (AMS) Methane emission of day X // AMS of day X
Equation of prediction Partial least squares regression Cross-validation
R²cv of 0.74 and RPD of 1.96 are very promising Predicting the amount of enteric methane emitted from the milk MIR spectra appears to be possible and a first screening is feasible.
Increasing the amount of data is crucial to confirm this trend and to compensate errors in the measurement of CH4.
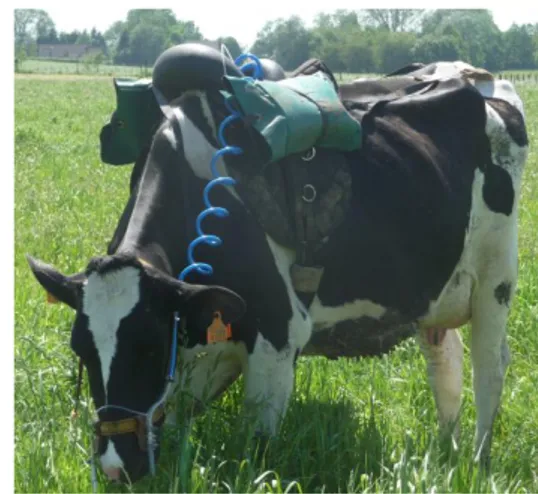
Fig. 2 : Device for collecting a sample of daily enteric CH4 emissions
Table 2 : Statistical parameters for the methane prediction equation
Fig. 3 : Relationship between CH4 emissions measured and those predicted according to the type of feeding
Methane measurement by the SF6 method (tracer gas)
Walloon Agricultural Research Centre Valorisation of Agricultural Products Departement
Agricultural Products Technologies Unit
a.vanlierde@cra.wallonie.be - www.cra.wallonie.be
This study was carried out as part of the “Méthamilk” research project supported by the Agricultural Head Office of the Walloon region - DGARNE DGO-3 (Belgium).
N R²c R²cv SEC SECV RPD
165 0.84 0.74 3.1 3.94 1.96
Trial N cows Mean of kg milk/d Diet
1 2X4 17.4 ± 3.9 kg/d Fresh pasture/
Corn silage(Cross-over)
2 3 26.2 ± 1.9 kg/d Grass silage
3 12 25.5 ± 3.7 kg/d TMR 1
4 6 26.0 ± 2.1 kg/d TMR 2
Fig. 1 : Bolus containing and emitting SF6
Table 1 : Daily milk production and diet for each trial
SEC : standard error of calibration ; SECV : standard error of cross validation ; RPD : Ratio of performance to deviation
0 10 20 30 40 50 60 70 0 10 20 30 40 50 60 L CH 4 /k g m il k m er su re d L CH4/kg milk predicted Grass silage Corn silage Fresh pasture TMR 1 TMR 2 In rumen