arXiv:astro-ph/0409199v2 12 Nov 2004
A PERIOD AND A PREDICTION FOR THE OF?P SPECTRUM ALTERNATOR HD 191612
Nolan R. Walborn1, Ian D. Howarth2,3, Gregor Rauw4,5, Daniel J. Lennon6,
Howard E. Bond1,7, Ignacio Negueruela8,9, Ya¨el Naz´e4, Michael F. Corcoran10,
Artemio Herrero11, and Anne Pellerin12
Draft version February 2, 2008
ABSTRACT
The observational picture of the enigmatic O-type spectrum variable HD 191612 has been sharpened substantially. A symmetrical, low-amplitude light curve with a period near 540 d has recently been reported from Hipparcos photometry. This period satisfies all of the spectroscopy since at least 1982, including extensive new observations during 2003 and 2004, and it has predicted the next transition during September–October 2004. Measurements of the Hα equivalent width reveal a sharp emission peak in the phase diagram, in contrast to the apparently sinusoidal light curve. The He II absorption-line strength is essentially constant, while He I varies strongly, possibly filled in by emission in the O6 state, thus producing the apparent spectral-type variations. The O8 state appears to be the “normal” one. Two intermediate O7 observations have been obtained, which fall at the expected phases, but these are the only modern observations of the transitions so far. The period is too long for rotation or pulsation; although there is no direct evidence as yet for a companion, a model in which tidally induced oscillations drive an enhanced wind near periastron of an eccentric orbit appears promising. Further observations during the now predictable transitions may provide a critical test. Ultraviolet and X-ray observations during both states will likely also prove illuminating.
Subject headings: stars: early-type—stars: emission-line, Be—stars: individual (HD 191612)—stars: mass loss—stars: variables: other
1. introduction
The discovery of two recurrent spectral states in the Of?p star HD 191612 was described by Walborn et al. (2003). The spectral type changes between O6 and O8, with correlated variations in several peculiar line profiles, including the transformation of Hα from a strong P Cygni profile to predominantly absorption, respectively. That paper left the star in the O8 state at the end of 2002, with considerable uncertainty about the (long) timescale and regularity of the spectral transitions, due to the fragmen-tary observational record. This Letter updates the obser-vational situation since then, including the definition of the timescale and period; the extensive discussions of the history and possible interpretations of the phenomenon in the earlier paper will not be repeated here. The most
significant new development is that the transition epochs can now be predicted, so that intensive observations dur-ing them can be planned. This development may well en-able progress toward an interpretation of the bizarre phe-nomenon, the characteristics of which are unprecedented in any O-type star.
As will be shown below, in May 2003 HD 191612 was found to have returned to the O6 state, where it remained through October of that year, but a December observa-tion showed signs of a transiobserva-tion, and it was recovered in the O8 state in May 2004. Thus, spectral states last less than a year, most likely 7-9 months based on the spec-troscopy alone. Concurrently, Naz´e (2004; see also Koen & Eyer 2002) reported a symmetrical, very low-amplitude light curve from Hipparcos photometry of this star, with a period of about 536 days or 18 months. This period is 1
Space Telescope Science Institute, 3700 San Martin Drive, Baltimore, MD 21218. STScI is operated by the Association of Universities for Research in Astronomy, Inc., under NASA contract NAS5-26555; walborn@stsci.edu, bond@stsci.edu.
2
Department of Physics and Astronomy, University College London, Gower Street, London WC1E 6BT, UK; idh@star.ucl.ac.uk. 3
Visiting Observer, Isaac Newton Group, La Palma, Spain. 4
Institut d’Astrophysique et de G´eophysique, Universit´e de Li`ege, All´ee du 6 Aoˆut 17, Bˆat B5c, B4000 Li`ege, Belgium. Also at the Fonds National de Recherche Scientifique, Belgium; rauw@astro.ulg.ac.be, naze@astro.ulg.ac.be.
5
Visiting Observer, Observatoire de Haute-Provence, France. The 2004 OHP run was funded by the OPTICON network supported under the FP6 program of the European Commission.
6
Isaac Newton Group, Apartado 321, 38700 Santa Cruz de La Palma, Canary Islands, Spain; djl@ing.iac.es. 7
Visiting Astronomer, Kitt Peak National Observatory, National Optical Astronomy Observatory, operated by AURA, Inc. under cooperative agreement with the NSF; and Multiple-Mirror Observatory, University of Arizona.
8
Departamento de F´ısica, Ingenier´ıa de Sistemas y Teor´ıa de la Se˜nal, Universidad de Alicante, Apartado 99, E03080 Alicante, Spain. Researcher of the Ram´on y Cajalprogram, funded by the Spanish Ministerio de Ciencia y Tecnolog´ıa and the University of Alicante. This research is partially supported by the Spanish MCyT under grant AYA2002-00814; ignacio@dfists.ua.es.
9
Visiting Observer, Loiano Observatory, Italy. 10
Universities Space Research Association, 7501 Forbes Boulevard, Suite 206, Seabrook, MD 20706 and Laboratory for High Energy Astro-physics, Goddard Space Flight Center, Greenbelt, MD 20771; corcoran@barnegat.gsfc.nasa.gov.
11
Instituto de Astrof´ısica de Canarias, 38200 La Laguna, Tenerife, Spain; ahd@ll.iac.es. 12
D´epartement de physique, de g´enie physique et d’optique and Observatoire du mont M´egantic, Universit´e Laval, Qu´ebec, QC, G1K 7P4, Canada; anpel@phy.ulaval.ca.
consistent with the timescale indicated independently by the spectroscopy. We rederived the period from a sine-wave fit to the Hipparcos data weighted by their errors, which yielded a value slightly larger than 540 d with an uncertainty of ±13 d. On the assumption that the period is stable over the longer baseline provided by the spec-troscopic observation of Peppel (1984), we then refined its value to 538 ± 3 d, where the stated uncertainty moves that point by 0.08 in phase, displacing it significantly from the trend. With this period we are thus able to phase all spectroscopic observations since 1982, deriving tight cor-relations among the spectral variations. It even accom-modates the spectral type of Walborn (1973), indicating that the period may be accurate and stable to at least a decade earlier. These results provide a strong prediction of the next transition (from the current O8 to the O6 state) during October 2004, with the Hα emission already rising significantly during September.
2. new observations
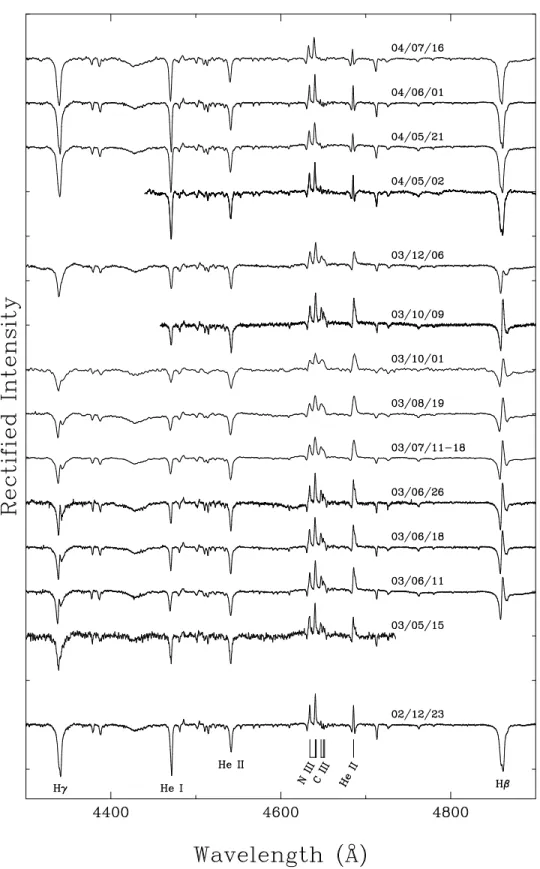
The 2003 and 2004 observations to date are listed in Ta-ble 1 and most of them are displayed in Figures 1 (blue-green wavelengths) and 2 (yellow-red). Fifteen epochs (some containing multiple observations) were obtained be-tween May and December 2003. The first of these showed that the star had (nearly) returned to the O6 state since the last 2002 observation (also shown for reference in Fig. 1; see Walborn et al. 2003). There is evidence of the transition in the May 15 spectrum, in the almost equal He I λ4471 and He II λ4541 absorption-line strengths (cor-responding to spectral type O7), and in the smaller ratio of the C III λ4650 to N III λ4640 emission-line strengths than subsequently. The December 6 observation is remarkably similar, with the addition of an intermediate Hα emission strength, indicating the onset of another transition, and that the complete duration of the O6 state was covered during 2003. The 2003 data provide several additional new results with respect to those available to Walborn et al. (2003). They are the first observations of the O6 state since the variability was discovered and include the first simultaneous blue and red digital observations in the O6 state, confirming inferences about their relationship in the earlier paper. A P Cygni profile is observed for the first time in He I λ5876, and the composite Hβ profile aids the interpretation of the Hα and Hγ profiles. Indeed, it is now clear from a comparison of the behavior of the three hydrogen lines that the peculiar profile of the Hα absorp-tion in the O8 state is caused by the persistence of a weak P Cygni profile in its core. In the O6 state, emission is visible in the Balmer lines to Hζ.
We have observed at ten epochs in May-July 2004, which document a new O8 state and definitely establish that the timescale of the spectral variations is less than a year. Thus, the possibility of a decade timescale allowed by the data available to Walborn et al. (2003) is ruled out, and evidence for the shorter timescale suggested by trends within the 2002 data is confirmed. As noted above, this shorter timescale is in excellent agreement with the inde-pendent photometric period found in the Hipparcos data.
3. discussion
3.1. Synthesis and Prediction
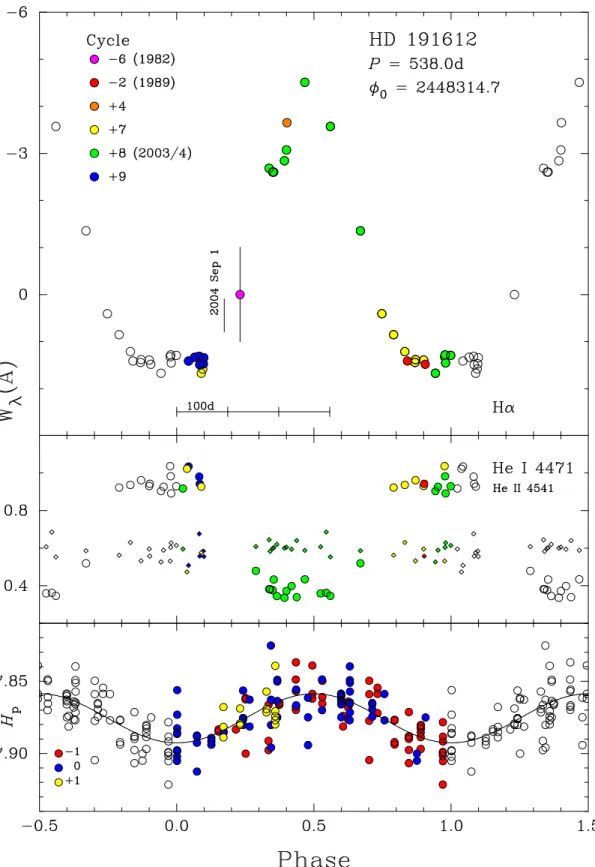
Figure 3 displays the Hipparcos phase diagram together with measurements of key hydrogen and helium spectral features. The Hipparcos observations were done between November 1989 and February 1993, while the digital spec-troscopic observations extend from June 1989 through July 2004. Blind remeasurements show that the equivalent widths typically repeat to better than 0.1 ˚A, which is con-sistent with the observed scatter about the trends; the Hα point with large error bar is a visual estimate from the plot published by Peppel (1984), corresponding to an observa-tion on August 29, 1982, which has been used to refine the value of the period as discussed above. The individual phases and measurements of these and other features will be listed in a subsequent paper. The tight correlations among the spectral features across 15 cycles demonstrate that the derived period is sufficiently accurate to phase them properly. Surprisingly, the Hα P Cygni emission has a sharp peak, in contrast to the apparently smooth light curve. As shown, the transition from O8 to O6, which has been practically unobserved by the prior spectroscopy, will next occur centered in October 2004, while a significant in-crease in the Hα emission will begin during September.
Another significant conclusion from Fig. 3 is that the O6 state (He II stronger than He I) occurs at maximum light, and conversely the O8 state at minimum. This is the opposite relationship to that predicted in Walborn et al. (2003), on the assumption of constant bolometric lu-minosity. The He II line displays little if any systematic variation in Fig. 3; in fact, little variation is predicted be-tween 35,000 K and 40,000 K at the relevant gravity and mass-loss rates. However, it is also possible that the stellar effective temperature is not changing, and that the weaker He I in the O6 state is due to emission filling of the ab-sorption line. Thus, the spectral-type variation may be only apparent. Clearly, better spectroscopic coverage of the transition phases will be essential to delineate the full behavior of the diagnostic features.
3.2. Physical Constraints
The characteristics of the HD 191612 variability present serious difficulties for all of the usual mechanisms in early-type stars. The period of ∼ 540 d is far too long to be rotational. A vsini of 77 km s−1 was derived in Walborn et al. (2003), which is an underestimate of the equatorial rotational velocity because of the unknown inclination, but may be an overestimate if turbulence or a velocity gradi-ent contributes to the line broadening. An (average) ra-dius of 17.7 R⊙was also derived in that paper, which for a fiducial rotational velocity of 100 km s−1corresponds to a period of 9 d. This issue also rules out any straightforward magnetic hypothesis for the variations as in an oblique ro-tator (although it may be well to recall that the poorly understood solar cycle is far longer than the rotational period of the Sun), and it is similarly adverse to any bi-nary model involving synchronous rotation. A precession of the rotational axis of a distorted star with different po-lar and equatorial spectra and winds might be considered, but then the apparent rotational velocity should also un-dergo extreme variations, and the physical basis of such a mechanism is unclear at best.
The period is also too long for a pulsational timescale in an O star: the sound-crossing time for a star of 40 M⊙
and 20 R⊙ yields a radial-mode period of ∼10 h, and the nonradial pulsations observed in a few O stars are also of the order of hours. A beat period of two pulsational modes might be considered, however, as has been applied to explain variations in the mass-loss rate and spectrum of the Be star µ Centauri (Rivinius et al. 2001). There is no direct observational evidence for pulsations in HD 191612 at present.
An upper limit of a few km s−1 to any radial-velocity variations in HD 191612 was derived in Walborn et al. (2003), which is not inconsistent with a low-mass com-panion in a 540 d orbit. For instance, a 2 M⊙ compan-ion in a circular orbit would induce a semi-amplitude of only 4.3 km s−1 at 90◦ inclination. However, such a sys-tem would not provide sufficient tidal distortion to induce large spectral variations in the primary, and the problem of the synchronous rotation required for phase-locked vari-ations has already been noted. An eccentric orbit with a small periastron separation is not ruled out by the radial-velocity data and might be consistent with the Hα behav-ior, although the symmetrical light curve would then be a puzzle. An interesting prospect in this regard is the model of tidally induced nonradial pulsations at periastron, in a system with nonsynchronized rotational and orbital angu-lar velocities (Koenigsberger, Moreno, & Cervantes 2002, 2003; Willems & Aerts 2002). Such pulsations could in turn drive enhanced mass loss (Owocki & Cranmer 2002), consistent with the spectral variations in HD 191612. The Herbig Be system HD 200775 may be an example (Pogodin et al. 2004). Another alternative in principle might be X-ray irradiation from a collapsed companion as a spectral-variability mechanism, but HD 191612 is a relatively weak source, and the much stronger source LMC X-4 with a 1.4 d period produces only small variations in the spec-trum of the O-type primary (Negueruela & Coe 2002 and references therein). We note that a short rotational pe-riod would not be a problem in this case, however, if the response time of the stellar atmosphere were much less. Chlebowski (1989) suggested that the Of?p stars might be binaries with collapsed companions, but Naz´e et al. (2004) concluded that HD 191612’s Of?p spectral classmate HD 108 is unlikely to be an X-ray binary from XMM-Newton observations; HD 108 displays the same kinds of optical spectral variations as HD 191612, but on a timescale of decades (Naz´e, Vreux, & Rauw 2001). Although we shall perform radial-velocity measurements in our new data, we can rule out any variations larger than 10-20 km s−1, and we are not optimistic about the precision with which smaller values can be measured, be-cause many of the data are not optimized for that purpose, and the systematic line-profile differences between the two
spectral states will obscure any small radial-velocity vari-ations. However, if the enhanced wind is a periastron event, the most favorable phases for the detection of radial-velocity variations have not yet been well observed (Fig-ure 3). The observed period is too short for an orbital precession, as found in the hierarchical triple system IU Aurigae by Drechsel et al. (1994).
Perhaps the most intriguing hypothesis is that the strange behavior of HD 191612 might be related to stellar evolution, via the Eddington Limit and/or the Luminous Blue Variable phenomenon; a binary connection to the latter is by no means ruled out. The other Galactic Of?p spectral classmate HD 148937 has ejected a spectacular, axisymmetric, nitrogen-rich nebula (Walborn et al. 2003 and references therein). Could HD 191612 be approach-ing a similar event? The short timescale and periodicity of the observed phenomena would be surprising unless a binary connection is indeed involved. Current understand-ing of such events is extremely limited, and this star could be providing critical new information about the outburst mechanism.
3.3. Outlook
The new results presented in this Letter have trans-formed the variations of HD 191612 from a temporally undefined, apparently random phenomenon into one that can be predicted. The observational implications are sub-stantial: instead of undirected monitoring, intensive cam-paigns at the key transitional and extreme epochs can be planned; we plan such for Fall 2004. Clearly it will be of great interest to obtain higher quality X-ray observations, as well as observations of the ultraviolet wind profiles, dur-ing both spectral states of HD 191612. The IU E observa-tion shown by Walborn et al. (2003) was obtained at phase 0.23, i.e. during a transition. If the entire wind is chang-ing, as suggested by the Hα variations, very large effects in the UV wind profiles would be expected, so observa-tions at the peaks of the two spectral states are of high interest. It may be hoped that this new information will provide critical guidance toward a viable physical model of the phenomenon; despite all indications to the contrary, we remain confident that there must be one! Perhaps the Of?p class is a mere curiosity among the OB Zoo (Wal-born & Fitzpatrick 2000), but it is also possible that it may be offering a missing link in massive (binary?) stellar evolution.
We are grateful to the additional observers listed in Ta-ble 1 who contributed to our 2003 and 2004 datasets. Pub-lication support was provided by the STScI Director’s Dis-cretionary Research Fund.
REFERENCES Chlebowski, T. 1989, ApJ, 342, 1091
Drechsel, H., Haas, S., Lorenz, R., & Mayer, P. 1994, A&A, 284, 853 Koen, C., & Eyer, L. 2002, MNRAS, 331, 45
Koenigsberger, G., Moreno, E., & Cervantes, F. 2002, ASP Conf. Ser. 260, Interacting Winds from Massive Stars, ed. A.F.J. Moffat & N. St-Louis (San Francisco: ASP), 507
—– 2003, in IAU Symp. 212, A Massive Star Odyssey, ed. K.A. van der Hucht, A. Herrero, & C. Esteban (San Francisco: ASP), 101 Naz´e, Y. 2004, thesis, Universit´e de Li`ege,
ftp://arachnos.astro.ulg.ac.be/pub/users/naze/these/
Naz´e, Y., Rauw, G., Vreux, J.-M., & De Becker, M. 2004, A&A, 417, 667
Naz´e, Y., Vreux, J.-M., & Rauw, G. 2001, A&A, 372, 195 Negueruela, I., & Coe, M.J. 2002, A&A385, 517
Owocki, S.P., & Cranmer, S.R. 2002, in IAU Colloq. 185, ASP Conf. Ser. 259, Radial and Nonradial Pulsations as Probes of Stellar Physics, ed. C. Aerts, T.R. Bedding, & J. Christensen-Dalsgaard (San Francisco: ASP), 512
Peppel, U. 1984, A&AS, 57, 107
Rivinius, Th., Baade, D., Stefl, S., Townsend, R.H.D., Stahl, O., Wolf, B., & Kaufer, A. 2001, A&A, 369, 1058
Walborn, N.R. 1973, AJ, 78, 1067
Walborn, N.R., Howarth, I.D., Herrero, A., & Lennon, D.J. 2003, ApJ, 588, 1025
Walborn, N.R., & Fitzpatrick, E.L. 2000, PASP, 112, 50
Willems, B., & Aerts, C. 2002, in IAU Colloq. 185, ASP Conf. Ser. 259, Radial and Nonradial Pulsations as Probes of Stellar Physics, ed. C. Aerts, T.R. Bedding, & J. Christensen-Dalsgaard (San Francisco: ASP), 76
Note in Press: Several spectroscopic observations during September and October 2004, obtained at WHT, TNG, NOT (La Palma); OHP; and Skinakas (Crete), show that the transition is in progress exactly as predicted. Measurements of Hα and the He lines fall precisely on the trends in Figure 3. These results and measurements from all available data will be discussed in a forthcoming paper.
Table 1
New Spectroscopic Observations of HD 191612
UT Date Telescope Observer Band Res (˚A) 2003
May 15 WIYN H. Bond B 0.6
June 11 INT D. Lennon BYR 1.2, 0.6
June 13 INT D. Christian B 0.3
June 18 WHT A. Herrero BYR 0.7, 0.8
June 19 WIYN H. Bond B 0.6
June 26 INT D. Lennon BYR 0.5
July 11 INT F. Prada BR 0.8, 0.7
July 11–18 INT I. Howarth BYR 1.4, 1.1
July 24 WIYN D. Harmer B 0.6
Aug 2 WIYN D. Harmer B 0.6
Aug 19–21 OMM A. Pellerin BYR 3.9
Sept 19 WIYN H. Bond B 0.6
Oct 1 MMT H. Bond BY 3.6
Oct 4–9 OHP G. Rauw BR 0.6
Dec 6 WHT D. Lennon BYR 1.8, 1.9
2004
May 2 OHP G. Rauw BYR 0.12
May 6 WIYN D. Harmer B 0.6
May 21 WHT J. Licandro BYR 1.6, 1.7
May 21 Skinakas P. Reig BYR 2.0
June 1 WHT I. Howarth BR 0.8
June 23–25 Skinakas P. Reig BYR 2.0
July 7–8 Skinakas P. Reig YR 2.0
July 15 Loiano I. Negueruela BR 3.9, 3.0
July 16 Loiano I. Negueruela BYR 1.2
Fig. 1.—Rectified blue-green spectrograms of HD 191612 during 2003 and 2004; the last 2002 observation from Walborn et al. (2003) is also plotted. The ordinate ticks represent 0.3 continuum units. The spectral features identified below are Hγ λ4340 and Hβ λ4861; He I λ4471; He II λλ4541, 4686; N III λλ4634-4640-4642; and C III λλ4647-4650-4651. The 2002 and 2004 spectra correspond to the O8 state, while the 2003 show the O6 state except that the May 15 and Dec. 6 are transitional.
Fig. 2.—Rectified yellow and red segments of the spectrum of HD 191612 during 2003 and 2004; a late 2002 observation from Walborn et al. (2003) is also plotted. The vertical line segment at lower center denotes the continuum scale, except that the 2003 red spectra with Hα emission have been reduced by a factor of 0.5. The interstellar Na I D lines have been truncated in the higher resolution data. The spectral features identified above are C III λ5696; C IV λλ5801-5812; He I λλ5876, 6678; Hα λ6563; and He II λ6683. The 2002 and 2004 spectra correspond to the O8 state, while the 2003 show the O6 state except that the Dec. 6 is transitional.
Fig. 3.—The phased Hipparcos light curve of HD 191612 (bottom); phase zero corresponds to the light-curve minimum. The sine-wave fit yields a mean magnitude of 7.876 ± 0.001 and an amplitude of 0.034 ± 0.003. Equivalent-width measurements of diagnostic He I (large circles) and He II (small diamonds) absorption lines (center) show that the apparent spectral type is earlier when the star is brighter, but the variation is entirely due to the He I line. The Hα P Cygni emission (top) is sharply peaked near phase 0.5, in contrast to the smooth light curve. As shown, the O8 to O6 transition, which has not been covered by the prior digital spectroscopy, will next occur during September–October 2004.