Predicting and managing reservoir sedimentation
in a hydropower project
B. J. Dewals, P. Archambeau, S. Erpicum, S. Detrembleur & M. Pirotton
Sediment related problems are of huge importance in most projects of dam construction. They may have long term impacts, by decreasing the reservoir capacity, as well short term ones, by damaging the turbines in the case of hydroelectric power plants. Therefore, the detailed analysis of sediment effects is increasingly present in the preliminary design of dam projects. The present poster will describe an ongoing hydropower project on the River Romanche in the South East of France, with a focus on reservoir sedimentation issues and on the long-term management of the sediments by means of periodic flushing.The River Romanche flows in the French Departments of “Hautes Alpes” and “Isère” and is part of the catchment of the River Rhone. The hydropower project involves a diversion dam (9 m high, 40 m wide) and a water intake, which diverts the flow through a penstock directly to a power plant located almost ten kilometres downstream. The total available head is over 200 m. The reservoir, which may be considered as shallow, is about two kilometers long and its storage capacity is about 200 000 m³. The main contractor of the project is EDF-CIH (Electricité de France – Centre d’Ingénierie Hydraulique).
The upper part of the catchment of the river is situated in Alpine mountainous areas and several of its tributaries are highly torrential. Therefore, high sediment inflows are expected in the reservoir especially during the flood season, which takes place in summer as a result of snowmelt in the basin. As a consequence, there is a need to assess the reservoir sedimentation process and to evaluate the feasibility and efficiency of flushing operations. To achieve those goals, a three-step procedure has been applied.
S
TEP1:
A
SSESSMENT OF SHORT-
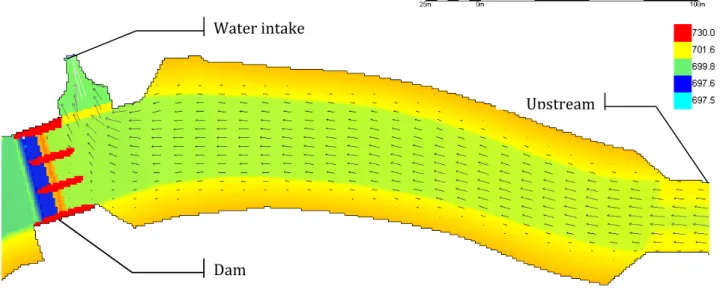
TERM SEDIMENTATION IN THE RESERVOIRFirst, the sediments likely to reach the water intake at the beginning of exploitation have been characterized. For this purpose, by means of the two-dimensional shallow water model WOLF 2D (developed at the University of Liege, Belgium), the flow field has been simulated in the reservoir with a grid resolution of 1 m by 1 m and an adequate k- turbulence closure. This flow field has then been analyzed in terms of sediment transport capacity in order to predict the maximum grain size able to reach the water intake and thus to contribute to damaging the turbines.
S
TEP2:
A
SSESSMENT LONG-
TERM SEDIMENTATION IN THE RESERVOIRSecondly, the long-term equilibrium bathymetry of the reservoir has been computed with a module of WOLF 2D handling mobile bed. Due to the long time-scale of the process, the computation is based on a quasi-steady approach (iterative steady-state hydrodynamic simulations). The sensitivity of the result has been verified to remain reasonably low with respect to variations in the main assumptions such as sediment yield and grain size.
S
TEP3:
E
VALUATION OF THE EFFICIENCY OF FLUSHING OPERATIONSFinally, the rapidly transient flow with high erosive capacity during a flushing operation has been simulated with a fully unsteady module of WOLF 2D, tightly coupling the computation of flow and sediment transport. As a result, this numerical study enables to evaluate the effect of a given flushing scenario in terms of changes in bathymetry in the downstream part of the reservoir as well as in terms of released discharge. The overall efficiency of the flushing operation can then be evaluated with respect to the recovered storage capacity and its extension in space. The integrated approach presented above takes benefit, at each stage, of the most appropriate and efficient modelling technique depending on the relevant time scales. It could also easily be applied to other similar projects. The poster will clearly describe this three-step procedure with numerous 2D and 3D figures.
Water intake
Upstream
Dam Dam
Figure 1: Bathymetry of the downstream part of the reservoir and location of the dam. Colour scale refers to the bottom elevation (m) while arrows show the velocity direction
Figure 2: Flow field in the vicinity of the dam, computed with the k- turbulence model and a grid resolution of 1 m by 1 m. Colour scale refers to the velocity magnitude (m/s) swhile arrows show the velocity