HAL Id: tel-02916194
https://tel.archives-ouvertes.fr/tel-02916194
Submitted on 17 Aug 2020HAL is a multi-disciplinary open access L’archive ouverte pluridisciplinaire HAL, est
Stratégies de survie et de croissance dans un contexte de
turbulence.Le cas des petites et moyennes entreprises
dans le photovoltaïque.
Thanh Thao Pham
To cite this version:
Thanh Thao Pham. Stratégies de survie et de croissance dans un contexte de turbulence.Le cas des petites et moyennes entreprises dans le photovoltaïque.. Gestion et management. Université Paris-Est, 2019. Français. �NNT : 2019PESC1020�. �tel-02916194�
UNIVERSITE PARIS-EST
ECOLE DOCTORALE ORGANISATIONS,
MARCHES, INSTITUTIONS
Thèse de doctorat en Sciences de Gestion
Menée au Laboratoire Interdisciplinaire Sciences Innovations Sociétés
(LISIS) de l’Université Paris-Est
Soutenue par Thanh Thao PHAM
STRATEGIES DE SURVIE ET DE
CROISSANCE DANS UN CONTEXTE DE
TURBULENCE.
LE CAS DES PETITES ET MOYENNES ENTREPRISES
DANS LE PHOTOVOLTAIQUE
Membres du Jury :
Professeur Yves LICHTENBERGER, Professeur émérite, Laboratoire Interdisciplinaire Sciences Innovations Sociétés (LISIS) (Président du Jury)
Docteur Corine GENET, Professeur associé, Grenoble Ecole de Management (Rapporteur)
Docteur Barbara BREITSCHOPF, Directrice de Recherche, Fraunhofer Institute for Systems and Innovation Research ISI (Rapporteur)
Docteur Eric JOLIVET, Maître de conférence, Toulouse School of Management (Examinateur)
Docteur Aurélie DELEMARLE, Professeur associé, Responsable Académique à l’École des Ponts et Chaussées (co-Directrice de thèse)
Professeur Philippe LARÉDO, Directeur de recherche, LISIS, ENPC, UPEM et Université de Manchester (Directeur de thèse)
Résumé
Stratégies de survie et de croissance dans un contexte de
turbulence.
Le cas des petites et moyennes entreprises
dans le photovoltaïque.
L’objectif de la thèse est d’enquêter sur les capacités de survie des acteurs opérant dans un segment fragmenté d’une chaîne de valeur, en l’occurrence le photovoltaïque, dont la partie aval subit des turbulences. En particulier cette étude porte sur les entreprises privées de petite taille, de technicité moyenne ou faible. Des entretiens suivis d’une étude quantitative sur 103 firmes ont été réalisés.
Les trois principales contributions sont les suivantes.
Premièrement, une nouvelle taxonomie de diversification industrielle est proposée basée sur les frontières du marché et de l’industrie. Il en découle quatre possibilités : (1) entreprises non-diversifiées ; (2) entreprises diversifiées au sein d’une même industrie ; (3) entreprises diversifiées dans deux industries ; et (4) entreprises diversifiées dans plus de deux industries.
Deuxièmement, quatre business models correspondent à ces quatre possibilités, me permettant de démontrer qu’il existe un nombre limité de business model dans une industrie.
Finalement, j’ai identifié deux facteurs impactant les capacités de survie et la performance de croissance des entreprises à moyen terme : l’horizon stratégique des managers et le temps de réponse. Il en découle quatre trajectoires de performance. Il est également montré que les entreprises ayant les meilleures profitabilités avant la crise optent pour une stratégie de réduction qui a pour effet de réduire leur profitabilité. Inversement, celles qui ont une profitabilité moins bonne au début s’engagent dans de gros investissements, sous condition de ressources, résultant en une meilleure profitabilité. Cela conduit à une homogénéisation des taux de retours.
Mots clés : chaines de valeur mondiales, photovoltaïque, business model, stratégies de diversification, redressement, capacités de survie, petites et moyennes entreprises.
Abstract
Survival and growth strategies in the context of a turbulent
environment.
The case of small and medium enterprises in the
photovoltaic industry.
The overall objective of this thesis is to investigate the survival capacities of actors operating in the photovoltaic industry, that is to say, in a fragmented segment of a value chain whose end-markets experienced turbulence. I intend to contribute to a better understanding of the diversification strategy of: (1) smaller and private firms; (2) non-or-low-tech companies; (3) in a specific economic environment (i.e. the context of turbulence). I conducted interviews and realized a quantitative study of 103 firms.
The contributions are threefold.
First, I propose a new taxonomy of industrial diversification based on the frontier of an industry and a market. Four possibilities derive from the intersection of intra- and inter-industry diversification: (1) single-business enterprises; (2) intra-industry diversifiers; (3) inter-industry diversifiers in two industries; and (4) inter-industry diversifiers in more than two industries.
Second, I identify four business models that derive from these four strategies, which allows me to argue that there can only be a limited number of business models in an industry.
Finally, this study identifies two factors impacting a firm’s survival capabilities and growth performance of SMEs in the medium term resulting in four growth performances: (1) the managers’ business horizon focus, and (2) timing of business responses. The results show four trajectories of firm performance. Moreover, while higher performers are more inclined to engage in retrenchment strategies that reduce their overall performance, lower performers tend to invest large amounts, resulting in a better performance. It results in a homogenization of firm performance over time.
Key words: photovoltaic, global value chain, business model, diversification strategies, turnaround, survival capacities, SMEs
Acknowledgments
None of us, acting alone, can achieve the success.
Nelson Mandela
Other things may change us, but we start and end with family.
Antony Brandt First and foremost, I wish to express my greatest thanks to my supervisors, Pr. Aurélie Delemarle and Pr. Philippe Larédo who provided me with continuous support and encouragement. They were always available for discussions, gave constructive critique and guidance when needed. Put simply, I could not have imagined having better advisors and mentors for my Ph.D study.
Besides my supervisors, I am grateful to my laboratory, Laboratoire Interdisciplinaire Sciences Innovations Sociétés (LISIS), my doctoral school Organisations, Marchés, Institutions (OMI), the Paris-Est University, and École
Supérieure d'Ingénieurs en Électrotechnique et Électronique (ESIEE). The support service
has been particularly helpful.
Profound gratitude goes to Pr. Barbara Breitschopf, Benjamin Fries, and the Fraunhofer ISI for their hospitality during the autumn 2016 and spring 2017. The stay offered me the opportunity to discover another way of working and gain valuable insights into the German photovoltaic market.
My sincere appreciation also goes to the interviewees for kindly sharing their time and thoughts!
I am also grateful to my current and former colleagues, in particular to Axel Lagnau, Jordan Mbani, Marina Oulion, and Douglas Robinson, with whom I have spoken for hours about my thesis.
I am deeply grateful to all members of the jury for agreeing to read the manuscript and to participate in the defense of this thesis.
I also add to this already long list Dr. Jocelyn Husser, Dr. Olivier Meier, Dr. Stéphane Ouvrard, Dr. Athanase Plastiras, and Dr. Guillaume Schier. They all introduced me to the research field in one form or another.
Last but not the least, my thanks would not be complete if I did not mention Stéphane, my love one, family, and friends for their unbelievable support. A special thanks to my aunt Christine who helped me for the layout of this document.
Without all these persons, this work would not have been possible. I hope that I have not forgotten anyone.
Summary
General introduction ... 21
1.Background 21 2.Research question and objectives 23 3.Contributions 24 4.Structure 25 Part 1 – Analytical framework ... 29
Chapter 1: The overlooked topics in the global value chains framework: the governance of multipolar, modular chains and of fragmented segments ... 31
Résumé 32 Introduction 33 1.Globalization and Production: Global Commodity Chains (GCC), Global Value Chain (GVC) and Global Production Networks (GPN) 34 1.1.Origins of GCC ... 34
1.2.From GCC to GVC ... 35
1.3.Similarities and differences ... 36
2.Global Value Chain evolution 38 2.1.Producer or buyer-driven chains: From a strict dichotomy… ... 38
2.2.To a fading one due to outsourcing ... 39
2.3.And the consequences of outsourcing ... 40
2.3.1. Possible multiplication of drivers ... 40
2.3.2. Possibility of modular value chains ... 41
2.3.3. Increasing complexity of coordination ... 42
3.The diversity of chain drivers 43 3.1.Lead firms ... 43
3.2.Turn-Key Suppliers ... 44
3.3.Platform Leader ... 45
3.4.Institutions and upgrading willing ... 45
4.The diversity of chain governance 45 4.1.Criteria ... 46 4.2.Market governance ... 47 4.3.Modular governance ... 47 4.4.Relational governance ... 48 4.5.Captive governance ... 48 4.6.Hierarchical governance ... 48 Conclusion 49 Chapter 2: The upstream segment of the photovoltaic value chain is illustrative of the overlooked topics in the global value chains framework ... 51
Introduction 53
1.What makes PV PV? 53
1.1.Solar power exploitation characteristics... 54
1.1.1. The sheer abundance of sun ... 54
1.1.2. PV, a variable source of power ... 54
1.1.3. The newness of PV exploitation ... 54
1.2.Solar material diversity but predominance of crystalline silicon .... 55
1.2.1. Crystalline silicon, the first category of solar materials ... 55
1.2.2. Thin-film solar cells for the second category of solar material ... 56
1.2.3. A third category not yet commercialized ... 58
1.3.PV market: growth and diversity ... 61
1.3.1. Impressive growth ... 61
1.3.2. Market diversity, where do PVs shine? ... 63
1.4.Conclusion ... 71
2.Photovoltaic value chain 72 2.1.Upstream activities, focus on module ... 72
2.1.1. Poly-silicon manufacturing ... 72 2.1.2. Wafer manufacturing ... 72 2.1.3. Cell manufacturing ... 72 2.1.4. Module manufacturing ... 73 2.2.Downstream activities ... 73 2.2.1. BOS manufacturing ... 73 2.2.2. System manufacturing ... 74 2.2.3. Project development ... 74
2.2.4. Operations and maintenance (O&M) ... 74
2.3.Conclusion ... 74
3.The upstream industry structure 75 3.1.The predominance of financial barriers to entry ... 75
3.2.Market concentration ... 77
3.3.Vertical integration ... 78
3.4.Geographical manufacturer dynamics ... 79
3.5.Conclusion ... 80
4.A heterogeneous downstream segment 80 4.1.Technical barriers to entry ... 80
4.2.Market concentration ... 81
4.3.Vertical integration ... 81
4.4.Geographic dynamics ... 82
4.5.Conclusion ... 82
Conclusion 83 Chapter 3: The public policy role, from state support to disengagement in the photovoltaic ... 85
Résumé 86 Introduction 87 1.Governments and PV 89 1.1.Support measures ... 89
1.1.1. Direct support measures ... 89
2.1.The German energy framework, triggered by its leadership in climate
change policy ... 92
2.2.The French energy framework, marked by the dominant nuclear power generation... 94
3.PV growth and deceleration 95 3.1.From the beginning to the mid-2000s: PV market for innovators and early adopters ... 95
3.1.1. Germany ... 95
3.1.2. France ... 97
3.2.Second mid-2000s: the fast-paced growth ... 99
3.2.1. Germany ... 99
3.2.2. France ... 100
3.3.The 2010s: the age of industry purification ... 102
3.3.1. Germany ... 102
3.3.2. France ... 104
Conclusion 106 Part 2 – Methodology ... 109
Chapter 4: The Design Methodology for studying the strategic choices of SMEs after the State disengagement in the photovoltaic: Combining qualitative and quantitative methods ... 111
Résumé 112 Introduction 113 1.Phase 1: The qualitative phase through interviews 114 1.1.Objective of the qualitative phase ... 114
1.2.Interviewees description ... 114
1.3.Data collection ... 114
1.4.Diversification: the main conclusion ... 115
2.Formulation of hypotheses 116 2.1.Diversification classification hypothesis ... 116
2.2.Value chain-related hypothesis – Positioning (1) ... 116
2.3.Global diversification-related hypothesis – Positioning (2) ... 117
2.4.Segmentation-related hypothesis ... 118
2.5.Resources-related hypothesis ... 118
2.6.Performance- related hypothesis ... 119
3.Phase 2: Testing the hypotheses quantitatively. 120 3.1.The perimeters of the quantitative research ... 120
3.1.1. A six-year post-moratorium period ... 120
3.1.2. Data types ... 120
3.2.The identification of relevant enterprises for the purpose. ... 121
3.2.1. The selection of a listing of enterprises. ... 121
3.2.2. Refining the listing ... 121
Conclusion 122 Part 3 - Results ... 123
Chapter 5: A characterization proposal of strategies in an industry
through its ideal business models ... 125
Résumé 126 Introduction 127 1.Diversification strategy 129 1.1.Strategy possibilities ... 129 1.2.Definition(s) of diversification ... 129 1.3.Goals of diversification ... 131
1.4.Choice of direction for diversification ... 131
1.4.1. Related versus unrelated diversification ... 131
1.4.2. Limits of related/unrelated diversification categorization ... 133
1.4.3. Intra versus inter-industry diversification ... 133
1.5.Conclusion ... 134
2.Presentation of the taxonomy 134 3.Business model 136 3.1.Business model definition(s) ... 136
3.2.Identifying the selected business model elements ... 137
3.2.1. Value proposition ... 138
3.2.2. Target market segment or market segmentation ... 139
3.2.3. Channels ... 139
3.2.4. Key activities ... 140
3.2.5. Key resources ... 140
3.2.6. Partner or value network ... 141
3.2.7. Customer relationships, cost structure, and revenue model. ... 141
Conclusion 143 Chapter 6: Characterization of ideal business models ... 145
Résumé 146 Introduction 147 1.The non-survivors 148 1.1.Dead? Not all! ... 148
1.2.Middle-sized firms exit the most from the PV market ... 150
1.3.Most of the companies that exited were in the BM3 class ... 151
2.Presentation and exclusion of the BM4 group 151 3.Movement analysis: toward intra-industry diversification 153 3.1.The stable business models ... 154
3.1.1. BM2: stay and fight ... 154
3.1.2. BM3: should I stay or should I go? ... 156
3.2.BM1, an unstable business model ... 158
3.2.1. Those who stayed solely on PV activities ... 158
3.2.2. Those who changed their business model ... 159
3.3.Conclusion ... 160
4.Positioning and segmentation criteria 161 4.1.Vertical diversification in the PV value chain especially towards project development and for actors in energy (Hypothesis 2) ... 161
4.1.1. Predominance of service-based vertically integrated suppliers ... 161
4.1.2. Project development, the most attractive activity, but an increasing importance of O&M ... 163
4.3.Broad customer segmentation for BM1 and specialization for BM3
(Hypothesis 4) ... 171
4.4.Conclusion ... 173
5.Firm-based/resources criteria (Hypothesis 5) 173 5.1.Large partner network for BM1 companies; small for BM3 ... 173
5.2.Small and medium-sized BM1 and BM2, large BM3 ... 175
5.3.Capitalization choice ... 176
5.4.Conclusion ... 178
Conclusion 178 Chapter 7: Relations between business model and performance growth, mitigated results ... 181
Résumé 182 Introduction 184 1.Methodology 185 1.1.Identification of performance indicators ... 185
1.2.Clustering Methodology ... 187
2.Classes overall description 188 2.1.Classes’ closeness ... 188
2.2.Link between classes and the business turnaround literature ... 189
3.Best growth performance classes 191 3.1.Investment strategies ... 191
3.2.Class 1, top-performance class ... 191
3.3.Class 2, investing firms but not yet profitable ... 193
3.4.Comparison ... 195
4.Poor growth performance classes 197 4.1.Retrenchment strategies ... 197
4.2.Class 3, stable performance class ... 197
4.3.Class 4, the lowest-performing class ... 199
4.4.Comparison ... 201
5.Industrial diversification and class performance 201 5.1.BM3 group, the most homogeneous one in terms of performance 202 5.2.BM1 and BM2 groups, highly heterogeneous regarding performance ... 203
5.2.1. To be an energy producer or not to be ... 203
5.2.2. BM1 companies, largely non-energy producer with a decreasing profitability ... 204
5.2.3.BM2 Companies, largely energy producers with a stable profitability ... 208
Conclusion 209 General conclusion ... 213
Résumé 214 1.Context 216 1.1.Global value chain literature and photovoltaic value chain ... 216
1.2.Government ... 217
1.3.Strategy ... 219
2.Contributions 219 2.1.Classification of industrial diversification based on the boundaries of the PV market and energy industry ... 219
2.2.A handful of business models in an industry ... 220 2.3.Survival strategies and performance ... 221
3.Limitations and direction for further research 222
References ... 225 Abbreviations and acronyms... 241 Annexes ... 243
Table summary
Table 1. 1.: Comparative table of GCC, GVC, and GPN literature 37 Table 1. 2.: Comparative table of producer-driven and buyer-driven chains 39
Table 1. 3.: Characteristics of governance types 49
Table 2. 1: Solar material characteristics 60
Table 2. 2.: Top 10 solar module manufacturers by installed capacity
(2007-2014) 76
Table 3. 1.: Cumulative installed PV power in Germany in MW 93
Table 3. 2.: Cumulative installed PV power in France in MW 95
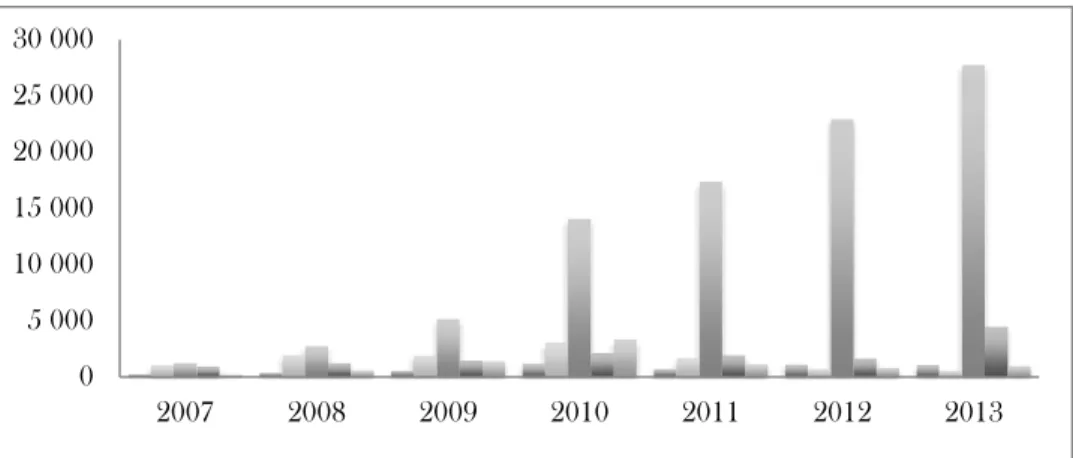
Table 3. 3.: Evolution of feed-in-tariff for building integrated PV and number of jobs in the downstream segment in Germany from 2001 to 2005 97 Table 3. 4.: Evolution of feed-in-tariff for building integrated PV and number of jobs in the downstream segment in France from 2001 to 2005 99 Table 3. 5.: Evolution of feed-in-tariff for building integrated PV and number of jobs in the downstream segment in Germany from 2005 to 2010 100 Table 3. 6.: Evolution of feed-in-tariff for building integrated PV and number of jobs in the downstream segment in France from 2005 to 2010 101 Table 3. 7.: Evolution of feed-in-tariff for building integrated PV and number of jobs in the downstream segment in Germany from 2010 to 2015 104 Table 3. 8.: Evolution of feed-in-tariff for building integrated PV and number of jobs in the downstream segment in France from 2010 to 2015 106
Table 5. 1.: Selected business model building blocks 144
Table 6. 1.: Analysis of non-survivors by business model 149
Table 6. 2.: Analysis of non-survivors by type of exit 151
Table 6. 3.: Trajectories of business model types 153
Table 6. 4.: Summary statistics of positioning in the PV value chain 162
Table 6. 5.: Combination of activities 163
Table 6. 6.: Summary statistics of positioning in the PV value chain 166
Table 6. 7.: Spatial coverage 170
Table 6. 8.: Statistics per customer segmentation type 172
Table 6. 9.: Partner network 174
Table 6. 10.: Linking customer segmentation to partner network 175
Table 6. 11.: Frequency of size 176
Table 6. 12.: Capitalization 177
Table 7. 1.: Main performance measures on diversification 186 Table 7. 2.: Pairwise distances comparisons between the class centroids
(Euclidean distance) 189
Table 7. 3.: Class centroids per class 190
Table 7. 4.: Growth performance levels and changes for Class 1 192 Table 7. 5.: Profitability levels and changes for Class 1 193 Table 7. 6.: Growth performance levels and changes for Class 2 194 Table 7. 7.: Profitability levels and changes for Class 2 195
Table 7. 8.: Comparison of two companies 196
Table 7. 9.: Growth performance levels and changes for Class 3 198 Table 7. 10.: Profitability levels and changes for Class 3 199 Table 7. 11.: Growth performance levels and changes for Class 4 200 Table 7. 12.: Profitability levels and changes for Class 4 201 Table 7. 13.: Distribution of business model across classes 202 Table 7. 14.: Variables' median per business model in 2015 202 Table 7. 15.: Distribution of energy producers (EP) across business model and
classes 204
Table 7. 16.: Summary statistics of the six BM1 energy producers 205 Table 7. 17.: Summary statistics of the 14 BM1 non-energy producers 205
Table 7. 18.: BM1 characteristics 207
Table 7. 19.: BM2 characteristics 207
Table 7. 20.: Summary statistics for the 22 BM2 energy producers 208 Table 7. 21.: Summary statistics for the 15 BM2 non-energy producers 209
Box summary
Box 2. 1.: Sharp's solar story 56
Box 2. 2.: FirstSolar’s story 57
Box 2. 3.: Soitec’s Solar story 59
Box 2. 4.: Silicon price variation 63
Box 2. 5.: Importance of deserts and arid regions 67
Box 2. 6.: SunPower 69
Box 2. 7.: Rise and Fall of the Desertec Foundation 70
Box 5. 1.: Assessing the degree of diversification 129
Box 5. 2.: Choice of mode of diversification 130
Box 6. 1.: Marchegay, a moving out BM3 company 149
Box 6. 2.: AEG Power Solutions, an example of BM4 enterprise 152
Box 6. 3.: UNITe, a BM2 company 154
Box 6. 4.: Apex Energies, Transformation of business model from BM2 to BM1 155
Box 6. 5.: GagnePark, a BM3 firm 157
Box 6. 6.: kiloWattsol, a BM1 company that stayed BM1 158
Box 6. 7.: Arkolia Energies, Transformation of business model from BM1 to
BM2 159
Box 6. 8.: Imerys Toiture, a BM3 company that proposes a mixed offer 163 Box 6. 9.: GenSun, a BM1 company whose O&M activity is crucial 164 Box 6. 10.: Urbasolar, a BM1 corporation that relies on its partner network174
Figure summary
Figure 2. 1.: Average annual growth rates of renewable energy capacity,
2002-2015 61
Figure 2. 2.: Solar PV total world capacity, 1995-2015 62
Figure 2. 3.: Ratio of decentralized versus centralized Solar PV installation 64
Figure 2. 4.: Global cell production by region (2007-2013) 79
Figure 5. 1.: The product-market growth matrix 129
Figure 5. 2.: Classification of industrial diversification of Wrigley (1970) 132
Figure 5. 3.: What is your strategy? 135
Figure 5. 4.: What is your business model? 136
Figure 6. 1.: Sample allocation of the 103 companies in 2010 148
General introduction
1.Background 21
2.Research question and objectives 23
3.Contributions 24
4.Structure 25
1. Background
Energy is one of humankind’s main preoccupations. In the last decades, there have been growing concerns regarding shortages of certain resources (e.g., crude oil), not to mention environmental degradation (notably from coal). There is a wide consensus among policymakers, notably at the European Commission (as illustrated by the Horizon 2020 program), that the energy industry must respond adequately and rapidly to rising power demand, uncertainty in commodity pricing, and tougher environmental requirements. To tackle these urgent needs, systematic attention has been devoted to a search for effective alternatives, particularly technologies that enable more sustainable energy production and consumption. This doctoral thesis deals with one specific technology which commercial age started in 1954: solar photovoltaic (PV) cells. In a nutshell, this technology converts solar energy into electricity. A PV system consists of PV modules, inverters, batteries and a mounting structure. Extra-terrestrial and other terrestrial applications such as small mobile devices are not considered here.
PV generation is a promising option and has distinguished itself from the other clean energy sources for mainly two reasons. Firstly, its generation is mainly distributed (i.e. electrical generation performed by small grid-connected generation units, typically up to 50MW). Secondly, not only is this technology recent but it is also experiencing the fastest growth of all the renewable energy sources (REN21, 2016, p. 29). The number of distributed solar PV installations is rising rapidly across the world. As PV technology matures, it has the potential to provide a significant and increasing share of the international community’s electricity demand.
Paradoxically, even though PV energy has been technically possible for many years and there seems to be a demand for it, its exploitation has not yet become a dominant solution. One of the main reasons for this is the cost, despite it having dropped substantially over the years (e.g., SETIS, 2011). Another significant reason is the wide technological variations that exist (IEA-ETSAP and IRENA, 2013, p. 1; International Energy Agency, 2010, p. 7; van de Kaa et al., 2014). Currently, five main commercial technologies compete in the global PV market, and many others are arriving. The last significant reason for this paradox is that the PV market has experienced setbacks.
It is worth considering more closely the latter point. For years, government subsidies and other demand-driven policies (the most important of which are feed-in-tariffs and the obligation of power utilities to buy excess power from customers at relatively high prices) created a financial windfall for energy producers (be they companies or individuals). The result was a proliferation of companies engaging in the PV downstream market – and consequently fraudulent offers as well. This scramble among companies to enter the PV market created confusion and a tremendous financial burden on Governments. In response, in many countries, including Germany and France, Governments implemented a drastic reduction of these financial subsidies from the years 2010-2011 (ADEME, 2011; Fulton and Mellquist, 2011). Specifically, in addition to reducing such supports, the French Government, through a moratorium at the end of the year 2010, temporarily suspended the obligation of Electricité de France (EDF), the main French utility, and other local distribution companies to purchase electricity generated from solar sources. It was furthermore decided that no more new PV projects superior to 3 kWp could be permitted during this period, except for residential installations.
This abrupt and unforeseen policy change, called policy inconsistency, led to a turbulent time for the solar market. The impact of this turbulence was evident on both sides of the market: supply and demand. As subsidies dwindled, companies struggled financially to make up for revenue lost after the moratorium, and some of them exited the market. This was the case throughout the PV value chain, despite the differences between the two parts of the chain (IEA PVPS, 2016a; Platzer, 2015). In the upstream part, which is highly technological, concentrated, and global, only a handful of large and multinational manufacturers dominate the segment. On the other hand, the downstream part is occupied largely by local, low-tech companies and, service providers. This segment is much more fragmented: in France alone, the number of actors is in the thousands, even after the moratorium (ADEME, 2017; ADEME and IEA PVPS, 2016).
It is certain that rigor struck the PV market seven years ago, but time and strategy changes allowed some of them to survive and grow. The ecology of population literature has shed light on the need for enterprises in the affected industry to develop new skills to respond to the new environment. The turnaround literature focuses on the development of new strategies in this context. Adaptation is a matter of time. But the speed and effectiveness of developing new skills of adapting new strategies quickly after a market shock has been shown to influence the survival capacity of many actors (Cooper and Schendel, 1976; Mitchell and Singh, 1996, p. 174; Nelson and Winter, 2004). By survival capacity, I mean “the capacity of an actor (e.g., company) or a group of actors to stay in operation ‘alive’ when confronted by forces that tend to destroy them” (Camarinha-Matos and Afsarmanesh, 2008, p. 256). Also, how managers envision the future when the crisis occurs may influence the speed of recovery (Mitchell and Singh, 1996, p. 174). The survival capacities of businesses facing a sudden turbulence are the subject of this doctoral study.
It is worth pointing out that the global value chain literature does not provide clues to understand the survival capacities of enterprises, especially in a fragmented segment not dominated by large firms. In fact, this literature eclipses sectors that are not dominated by powerful actors, namely lead firms, which determine the division of labor. This is unfortunate because modular global value chains where no-lead-firm actors orchestrate at least a part of the value chain are not a rare occurrence. In such cases, there is value in looking at what is going on through the lenses afforded by a complementary theory.
This thesis focuses on strategic behavior in general and on diversification strategies in particular as a primary determinant of survival in a context of turbulence. The link between survival and diversification, while intensively examined, has been overlooked in many respects.
Firstly, empirical studies on diversification in general, and on the diversification-performance relationship in particular, predominantly focus on large and publicly traded companies (Ramanujam and Varadarajan, 1989; Robson et al., 1993; Stern and Henderson, 2004, p. 488). Thus, small firms’ diversification strategies are neglected, with few exceptions such as in the work of Robson et al. (1993) and Stern and Henderson (2004). This is unfortunate as the results could be entirely different from the well-studied perspective of large corporations. That is to say that the likelihood of diversification strategy success, i.e. the survival rate, of these two populations is different (Stern and Henderson, 2004, p. 488; Zahavi and Lavie, 2013, p. 978).
Furthermore, diversification strategy has been studied extensively for high-technology firms (Colombo et al., 2014; Tanriverdi and Lee, 2008; Zahavi and Lavie, 2013), while efforts to better understand the challenges related to the impact of diversification strategy on the survival of non-or-low-tech companies have been virtually inexistent.
Finally, although the question of the performance of diversification strategy is in many respects an age-old question, it does not yet enjoy consensus. I believe that this is due to the general context of earlier studies, and therefore consider that the question merits examination in a specific situation: the context of turbulence. Most studies, such as Rumelt (1974), investigate diversification performance in a period characterized by stability, low inflation, and low-interest rates. Conversely, the Michel and Shaked (1984) study involves a period of high uncertainty due largely to the oil shock. It ends with a conclusion in stark contrast to that of Rumelt (1974): unrelated diversifiers outperform related diversifiers in terms of risk returns. As a result, the question in a situation of turbulence may also lead to a different set of results than those reached in a stable environment.
2. Research question and objectives
Against this backdrop, in the wake of the recent PV market crisis and from the perspective of smaller and non-or-low-tech actors, the overall objective is to investigate the survival capacities of actors operating in a fragmented segment of a
value chain whose end-markets experienced turbulence. This poses the following central question:
Which strategies are the most rewarding for the survival and growth of small, private, non-or-low- tech companies in response to turbulence?
It follows that this doctoral thesis addresses three shortcomings. I intend to contribute to a better understanding of the diversification strategy of: (1) smaller and private firms; (2) non-or-low-tech companies; (3) in a specific economic environment, which is the context of turbulence. In order to address the question, I will draw elements from the literature on global value chains, strategies, and business models. Considering that the context of the study, i.e. turbulence, "moves away from everyday phenomena" (Eisenhardt and Graebner, 2007, p. 28), I undertook an exploratory study.
3. Contributions
The contributions of the doctoral thesis are threefold.
First, I propose a new taxonomy of industrial diversification considering the porosity of value chains. In particular, some activities in the PV value chain are common to another value chain. Admittedly, the literature of industrial diversification is full of categories, all based on the relatedness concept between business lines. The most popular are the ones of Wrigley (1970) and Rumelt (1974). Yet, the concept is challenging as it lays on subjectivity and required detailed information about the repartition of a firm’s revenues between the various business lines. This raises two issues: replicability and private firm information accessibility. To overcome these limitations, I build my taxonomy based on the frontier of an industry and market instead of relatedness. Four possibilities derive from the intersection of intra- and inter-industry diversification: (1) single-business enterprises; (2) intra-industry diversifiers; (3) inter-industry diversifiers in two industries; and (4) inter-industry diversifiers in more than two industries.
For deepening my understanding of firm’s survival capacities, I draw on the business model literature as a business model is a reflection of the strategy which the company has implemented (Casadesus-Masanell and Ricart, 2010). For this purpose, drawing from the business model canvas of Osterwalder et al. (2010), I elaborate a model of ideal business model based on value propositions, key activities, channel, partner network, and key resources. It results from the study that all but the ‘channel' component are characteristic for at least one strategy. That is to say, I also contribute in testing the assertion of Teece (2010) and Baden-Fuller and Morgan (2010), that is there is only a limited number of business models in an industry, and confirm the argument of Casadesus-Masanell and Ricart (2010).
industries; and the general-purpose products business model (BM4) for inter-industry diversifiers in more than two industries. Considering the insensibility of inter-industry diversifiers in more than two industries regarding the PV market crisis, I do not study this case.
Finally, I also establish a link between industrial diversification, business model and, growth performance. A review of the turnaround literature shows that a firm’s survival capabilities and performance may depend on not only the business horizon focus of managers largely depending on a firm's capacity to change (cf. resources), but also the timing of business responses. It identifies two possible reactions: retrenchment (i.e. cost efficiencies, asset retrenchment, focus of firm’s core activities; (Schoenberg et al., 2013) and investment strategies (i.e. investment, innovation, and diversification into new markets; Civi, 2013; Hayter, 1985; Kitching et al., 2009; Pearce and Michael, 2006, 1997; Roberts, 2003; Sands and Ferraro, 2010).
The first one is by far the most popular strategy especially in the short run (Geroski and Gregg, 1997), but results in limiting their potential gains from the PV market upturn. The two variables (i.e. business horizon focus and timing of business responses) lead to four performance growth groups. What is striking is that there is no perfect match between a class performance growth and a business model. However, there is a general trend. BM2 firms, and to a lesser extent BM1, tend to start the period with a low performance but increase it over time thanks to investment strategies. Conversely, BM3 companies were the best performers in 2010 but decrease their level due to retrenchment strategies. A linked result is that the performance range between groups reduced with the crisis. The results obtained contradict those of Geroski and Gregg (1997).
4. Structure
This doctoral thesis is composed of seven chapters, which can be grouped into three parts. The first three chapters lay the theoretical foundations of my doctoral research. In part 2, Chapter 4 provides details of the methodological work. The last part, which contains Chapter 5 to 7, presents the results.
In Chapter 1, my attention is on the global value chain literature. Specifically, this chapter shows that global value chain scholars are interested in various industries (e.g., automobile, apparel, and vegetables) but have almost exclusively investigated the power exercised by lead firms (i.e. a handful of large companies determining the division of labor). Lead firms are primarily active in unipolar value chains, whose governance is hierarchical.
It is worth noting that previous studies on global value chains have been unsatisfactory for analyzing modular value chains (i.e. the internal workings of a value chain segment are highly independent of those of the other segments) since their stories and potentially their governance are totally different. It follows that little is known about modular value chains. I, therefore, intend to fill this gap with the case of the PV value chain. The PV value chain is interesting for my research as it is modular.
This characteristic offers a wide variety of governance and presumably a segment without lead firms. This leads us to Chapter 2.
After outlining the specific features of the PV technologies and value chain, Chapter 2 concludes that, at first glance, the global value chain literature is insightful for the study of the upstream PV value chain. As the upstream part is governed largely by lead firms, studying this segment fits into the mainstream global value chain research. Turning to the downstream segment, in many countries the industry encompasses a large number of actors, mainly new entrants. Unlike traditional electricity production, small players (i.e. small and medium enterprises and local communities) occupy center stage in this segment. None of the large companies in the downstream segment could be considered as lead firms. This suggests that the global value chain literature does not explain the downstream situation.
Considering that the energy sector is a regulated market, investigating the impact of government policies provides important insight to understand the proliferation of actors, be they small or large, in the downstream part. This is the topic of Chapter 3. Specifically, this chapter describes the regulatory framework as the main driver for the development of PV technologies and markets. In particular, based on the French and German cases, it draws attention to the variation of the regulatory framework that has resulted in turbulence. The lack of policy consistency in many countries (e.g., on-again-off-again renewable energy policies) is considered to demonstrate the indirect impact of demand-focus policies on the number of actors in the downstream segment. In the midst of the chaos, few companies have managed to make their mark. One may wonder what makes some actors able to survive. That leads my research to the question of survival capacities.
In particular, six hypotheses are elaborated and presented in Chapter 4. This chapter also presents the design of my research on these questions. Specifically, I used a mixed method with a qualitative research based on 18 interviews as a preliminary phase. The first and foremost conclusion drawn from these interviews is that companies adopted various strategies when confronted with declining prospects in the PV market. The common thread is diversification, be it industrial, vertical, or global. Departing from this first step, I elaborated six hypotheses.
Considering that I did not want to confine the research to a descriptive approach, I also undertook quantitative research on the capacities of firms that enable them to recover from the turbulence. This was the second step. The objective of the quantitative phase was to enrich my research, based on the analysis of the recovering capacities of diversified, small and medium companies in the context of turbulence. The emphasis here is on SMEs and the French situation.
For this purpose, the six hypotheses were tested on a six-year longitudinal sample of companies (from 2010 to 2015). I used a sample of companies listed from two significant databases of French PV-based enterprises. The initial sample considered 276 enterprises operating in the PV value chain, from which 103 firms met the
survive. Looking at this issue from the standpoint of diversification strategy should allow us to deepen our understanding of this diversity of actors and industry structure. Specifically, Chapter 5 relates to the classification of diversification strategies.
It is worth pointing out that classifications of diversification strategies proposed in the literature are criticized on the grounds of being based on subjectivity and therefore not being appropriate for the study of small and medium-sized private companies. I devised my own taxonomy to overcome these shortcomings, distinguishing between intra- versus inter-industry diversification, rather than related versus unrelated diversification.
I also drew on the business model literature, as the business model is a reflection of the actual strategy that is implemented (Casadesus-Masanell and Ricart, 2010). This implies that there are as many business models as there are strategies. Furthermore, as suggested by Teece (2010) and Baden-Fuller and Morgan (2010), there is only a handful of business models in an industry. This confirms the possibility of a taxonomy. The chapter ends with the classification of firms on the basis of the intra- and inter-industry diversification distinguishing four possibilities. Chapter 5 lies the basis on which I will test my first hypothesis on classification.
Having presented the taxonomy of industrial diversification strategies, I was able to highlight commonalities and divergences between business models and resources of the panel, in Chapter 6. Hypotheses 1 to 5 are addressed in this chapter.
Note that, as the main focus of this thesis is the impact of turbulence on companies’ strategy and positioning, exiting companies and the industrial strategy type (and therefore its respective business model) that is the most independent of the PV market evolution (i.e. inter-industry diversifiers in more than two industries) have been excluded. A total of 70 firms corresponding to three business model types are analyzed.
I have proposed my own criteria inspired by the Business Model Canvas of Osterwalder et al. (2010) to describe the business model of the three remaining types. This results in a clearer picture of the observed abundance of actors in the downstream segment of the PV value chain. Some criteria have proved to be more relevant than others, depending on the business model type.
The question of the performance of a business model or of diversification strategies remains unanswered. It is to this point that the last chapter is devoted. In Chapter 7, I quantitatively analyze the strategic performance growth of the companies in the three most PV market-dependent types. Specifically, five accounting performance indicators and their respective growth between 2010 and 2015 are studied. The evolution of performance sheds light on four different performance scenarios which I first describe, before seeking to link strategies, business model, and performance growth.
Chapter 1: The overlooked topics in
the global value chains framework: the
governance of multipolar, modular
chains and of fragmented segments
Résumé 32
Introduction 33
1.Globalization and Production: Global Commodity Chains (GCC), Global
Value Chain (GVC) and Global Production Networks (GPN) 34
1.1.Origins of GCC ... 34 1.2.From GCC to GVC ... 35 1.3.Similarities and differences ... 36
2.Global Value Chain evolution 38
2.1.Producer or buyer-driven chains: From a strict dichotomy… ... 38 2.2.To a fading one due to outsourcing ... 39 2.3.And the consequences of outsourcing ... 40
2.3.1. Possible multiplication of drivers ... 40
2.3.2. Possibility of modular value chains ... 41
2.3.3. Increasing complexity of coordination ... 42
3.The diversity of chain drivers 43
3.1.Lead firms ... 43 3.2.Turn-Key Suppliers ... 44 3.3.Platform Leader ... 45 3.4.Institutions and upgrading willing ... 45
4.The diversity of chain governance 45
4.1.Criteria ... 46 4.2.Market governance ... 47 4.3.Modular governance ... 47 4.4.Relational governance ... 48 4.5.Captive governance ... 48 4.6.Hierarchical governance ... 48 Conclusion 49
Résumé
Chapitre 1 : Les zones d’ombre dans l’étude des chaines de valeur mondiales : la gouvernance des chaines multipolaires et modulaires et des segments atomisés
Les chaînes de valeur mondiales (global value chains en anglais) sont notre point de départ dans ce travail de thèse. Elles proposent un cadre d’analyse de l’organisation des industries au niveau mondial et de leurs évolutions. Plus précisément, elles s’intéressent au pouvoir, à la gouvernance et aux dynamiques des chaînes dans un contexte international. Ce cadre d’analyse prend tout son intérêt dans un contexte de fragmentation des chaînes de valeur remarquée depuis les années 1980. En d’autres termes, ces chaînes sont devenues plus géographiquement dispersées et l’organisation de la production et de la distribution plus fragmentée.
La littérature propose cinq modes de gouvernance : par le marché, modulaire, relationnel, captif et hiérarchique. Chaque mode a son ou ses “gouvernant(s)”. Il est important de préciser que dans une chaîne de valeur modulaire où les différents maillons évoluent indépendamment des autres, plusieurs modes de gouvernance peuvent coexister.
Un état de l’art des recherches précédentes permet de mettre en lumière l’attention quasi-exclusive portée sur des industries, certes variées, mais dont le point commun est le pouvoir détenu par une poignée d’acteurs, nommées firmes motrices (lead firms en anglais), sur l’ensemble de la chaîne de valeur. Cette configuration fait référence aux situations de monopole et d’oligopole. Ces firmes motrices jouent le rôle de chef d’orchestre et définissent ainsi la division du travail.
Il est important de souligner que ces firmes motrices peuvent partager leur pouvoir de gouvernance avec des acteurs tant internes (tels que des fournisseurs) qu’externes (tels que des institutions ou gouvernements) à la chaîne de valeur. Dans ce cas on qualifie ces chaînes de multipolaires, à opposer à unipolaire quand seules les firmes motrices tiennent les rênes.
Cependant, les chaînes de valeur multipolaires ou celles marquées par l’absence des firmes motrices sont peu abordées par la littérature. Or, elles sont bien plus complexes à étudier que les chaînes unipolaires. De plus, les situations de forte compétition sont également négligées par les chercheurs. Ce chapitre propose donc de mettre en lumière ces lacunes et l’importance de les combler.
Ce chapitre attire donc notre attention sur la gouvernance de chaînes de valeur modulaires caractérisées par un marché très concurrentiel sur au moins une partie de la chaîne, autrement dit sans firme motrice comme gouvernant. Pour illustrer cette situation, nous nous intéresserons à la chaîne de valeur du photovoltaïque. Ce sera le sujet du Chapitre 2.
The individual has always had to struggle to keep from being overwhelmed by the tribe.
Nietzsche
Introduction
Competition is no longer confined within national boundaries but, instead, is spreading across country boundaries. The trend is not new, as internationalization has been observed since at least the 17th century (Gereffi et al., 2001, p. 1). Interestingly, what differentiates the current era of ‘globalization' from the earlier era of ‘internationalization' is the functional integration of internationally dispersed activities (Ponte and Sturgeon, 2014, p. 197). Technology transfers (through acquisitions, importation of manufacturing equipment, and talent recruitment) have modified a lot the industry structure, with new market entrants from developing countries (Gallagher and Zhang, 2013, p. 15;19). It is worth pointing out the significant, yet still increasing, participation in manufacturing activities from Asia. This geographic spread implies long-distance business relationships with legally independent firms. The Global Value Chain (GVC) literature is very insightful to examine the ease with which companies establish and manage such business relationships (Humphrey and Schmitz, 2001, p. 20; Ponte and Sturgeon, 2014, p. 198). Specifically, its interest is in the governance of globally dispersed and organizationally fragmented production and distribution networks over time. Prior research of GVCs illustrates the wide variety of interest regarding the industry: e.g. automobile (Sturgeon et al., 2008), electronics (Sturgeon, 2002), apparel (Schmitz and Knorringa, 1999), horticulture (Dolan and Humphrey, 2000), garments (Gereffi, 1999), and coffee production industry (Fitter and Kaplinksy*, 2001). These industries are characterized by a handful of powerful companies, namely lead firms, which determine the division of labor. It follows that the GVC studies mainly analyze the power exercised by these powerful actors. In other terms, the literature pays scant attention to the governance of GVCs with no lead firm. This first chapter aims to underline this gap and highlighting the importance of filling this gap.
For this purpose, Section 1 analyzes and traces back the origin of the concept of GVC. Particularly, I present related pieces of literature to clarify the notion of GVC along with the ‘upgrading’ concept. Section 2 describes the different types of GVC structure resulting from the changes in the organization of global industries over time, notably the chain structure shifts into buyer-like one. Particularly, I will steer the attention on the most disaggregated chain structure, which is the modular value chain. Modular value chain is of particular interest as it implies the independence of each stage of a value chain and then enables some linkages to be governed without a single lead firm. Reckoning that actors are at the heart of the governance issue, lead firms, along with the other players impacting the GVC, are exposed in the following section. Considering that the GVC structure variety discussed in Section 2 implies governance variety, I address the governance topic in Section 4. Finally, I establish the conclusions that can be drawn from the chapter.
1. Globalization and Production: Global Commodity Chains (GCC), Global Value Chain (GVC) and Global Production Networks (GPN)
1.1. Origins of GCC
In past decades, some phenomena resulted in an increasing globalization of value chains in general (Organisation for Economic Co-operation and Development, 2008, p. 21). Among others, there are three well-acknowledged factors. Firstly, an increasing number of low-cost suppliers come from emerging countries with significant industrial capacity, especially China and India. Secondly, technological progress, in particular, the development of information and communication technologies (ICTs), coupled with market deregulation, offers significant possibilities of offshoring services. Thirdly, improved transport facilities make the economic question of geographical distances more easily surmountable (Organisation for Economic Co-operation and Development, 2008, p. 22). These changes have resulted in an international expansion and geographical fragmentation of supply chains.
To grasp these world economy changes and the dynamics of new power games, a direct tie was missing between the concept of value-added chain and global organization of industries (Gereffi et al., 2005, p. 82). Aiming at filling this gap, in their seminal book, “Commodity chains and global capitalism”, Gereffi and Korzeniewicz (1994), generate an analytical framework: Global Commodity Chains (GCCs)1
. A commodity chain designates “a network of labor and production processes whose end result is a finished commodity” ((Hopkins and Wallerstein, 1986, p. 159). “The whole range of activities [is] involved in the design, production, and marketing of a product” (Gereffi, 1999, p. 1).
A notion that is at the heart of GCC is upgrading. Upgrading studies focus on the strategies used not only by firms and groups of firms but also countries, regions, individual localities and other economic stakeholders to maintain or improve their relative competitive positions in the global economy (Gereffi and Fernandez-Stark, 2011, p. 12; Ponte and Sturgeon, 2014, p. 196). The notion of ‘upgrading' is intrinsically related to the first reason for the development of GCC literature. Indeed, initially, while it is always the case, the focus of research work was on how and why developing countries and economies in transition integrate the GCC. That is why the GCC topic aroused such great excitement among researchers and international organizations in connection with economic development, encompassing the WTO, the World Bank, and the OECD (Gereffi and Lee, 2012, p. 24).
These strategies result in a shift between different stages of the chain. This change aims at increasing either value creation or value learning, or both. Gereffi et al. (2001, p. 6) distinguish various types:
1. Product upgrading designates a move made by firms into more sophisticated product lines.
2. Process upgrading is achieved through superior technology or reorganizing the production systems leading to a more efficient transformation of inputs into outputs.
3. Intra-chain upgrading encompasses the functional upgrading (i.e. the acquisition of new functions in the chain), the upgrading via vertical integration (i.e. the move upstream or downstream to different stages in a supply chain) and, the network upgrading (i.e. the diversification of buyer-supplier linkages).
4. Inter-chain upgrading refers to a competence acquired in a particular function of a chain, which has been applied to a new sector.
1.2. From GCC to GVC
Since the book of Gereffi and Korzeniewicz (1994), numerous contributions have been made to the GCCs literature, whose name has evolved to ‘global value chains’ (GVCs). The name change occurred due to numerous critics about the name (Ponte and Sturgeon, 2014, p. 202; Vind and Fold, 2007, p. 70). Indeed, the term ‘commodities’ leads to misunderstandings due to popular connotations with undifferentiated products. Ponte and Sturgeon (2014, p. 202) specify that this confusion is particularly observable with primary commodities, including crude oil and bulk agricultural goods.
The term ‘value' is preferred as it refers to the ‘value added’ concept and refocuses to the main sources of economic development, that are of human effort and capital2
. Furthermore, Gereffi et al. (2001, p. 2) spotted ‘incomplete’ firms that have specialized in certain value chain functions, to be opposed to complete firms which are vertically integrated within the chain. Thus, GVC is defined as “a full range of activities that firms and workers perform to bring a specific product from its conception to its end use and beyond” (Gereffi and Fernandez-Stark, 2011, p. 4).
2
It is of utmost importance to distinguish GVC literature from related concepts, including the “value chain” of (Porter, 1998a). On the one hand, (Porter, 1998a) defines the value chain internal to a company. This is to say that it takes into consideration ‘complete' firms that internalize all the business functions. On the other hand, a series of articles use the term ‘value chain' preceded by global (Gereffi et al., 2001; Gereffi and Fernandez-Stark, 2011) to describe a broader situation than the one proposed
1.3. Similarities and differences
Undoubtedly, GVC and GCC have a common theoretical background, which is the world-systems theory of Wallerstein but differ in their approach (Vind and Fold, 2007, p. 70). To a lesser extent, another related strand of literature is also of interest for this comparison work: ‘global production network’ (GPN). A production network is defined as “a set of inter-firm linkages that bind a group of companies into larger economic groups (Sturgeon, 2001). Therefore, it seems that the framework of both GVC and GPN is an extension of the GCC's one. Precisely, there is a gray line between the GCC, GVC, and GPN pieces of literature. The following table should allow the reader to grasp the similarities and differences between them easily. It is evident from Table 1.1 that when observing the definitions, the researchers are all talking about the same thing. However, a few differences emerged between the three strands of literature along four criteria.
First, Gereffi et al. (2001, p. 2) shed light on the difference of the unit of analysis: the firm for GCC and the chain or organizational network for GVC. Specifically, Gereffi and Lee (2012, p. 25) state that the new framework evolved and now focuses on “globally expanding supply chains and how value is created and captured therein." This focal point refers to the ‘business model’ concept, as value creation and value capture are the two dimensions of business activity that help to build and sustain a competitive advantage (Teece, 2010).
Second, while the GCC framework pays particular attention to the internal explanatory factors for industry dynamics, GVC and GPN frameworks take into consideration all influences from the exterior, in addition to the internal actors and factors to the chain. Precisely, the GVC literature took a bold step in taking a broader interest in the contextual, developmental and strategic issues than the GCC approach did, and raised interest in the characteristics of inter-firm relationships (Ponte and Sturgeon, 2014, pp. 202–203; Vind and Fold, 2007, p. 70).
A similar extension was applied to production networks on both the unit of analysis (shift from the firm to the production network) and the limit of the framework (the inclusion of the external environment). On the one hand, Borus, Ernst and Haggard (2000 in Vind and Fold, 2007, p. 70) define the international production network of a transnational corporation as “the set of relationships (across national borders) through which the firm organizes its entire range of business activities: R&D, product definition and design, procurement, manufacturing, distribution, branding, marketing, and support services”. On the other hand, Sturgeon et al. (2008) propose an alternative definition, under the name of global production networks (GPN), to include the wider institutional framework with non-corporate actors. These actors include Governments and labor unions.
Global Commodity
Chains (GCCs) Global Value Chains (GVCs)
Global Production Networks (GPNs) De fi ni tio n
“A network of labour and production processes whose end result is a finished commodity” (Hopkins and Wallerstein, 1986, p. 159).
“A full range of activities that firms and workers perform to bring a specific product from its conception to its end use and beyond” (Gereffi and Fernandez-Stark, 2011, p. 4).
A set of inter-firm linkages that bind a group of companies into larger economic groups (Sturgeon, 2001).
Fr
amework
Internal explanatory factors for industry dynamics
GCC + external factors to the chain (contextual, developmental and strategic issues)
Internal and external to the network.
Focus
Actors, i.e. drivers of the chain (developed in
Section 3) Chain dynamics
Inter-firm relationships’ nature and extent G over nance q ues tio n
Who governs? How is it governed? (developed in Section 4) How is it governed?
Table 1. 1.: Comparative table of GCC, GVC, and GPN literature
Source: Compiled by author from Hopkins and Wallerstein (1986), Gereffi and Fernandez-Stark (2011) and Sturgeon (2001)
Third, another evolution is observable on how the pieces of literature address the governance issue: it moves from “who governs?” (GCC) to “how is it governed?” (GVC and GPN). While GCC has a strong focus on the chain drivers, GVC and GPN are interested on the mechanisms of the chain governance. Put simply, the governance structure explains how value chains are controlled. Governance is defined as the “authority and power relationships that determine how financial, material, and human resources are allocated and flow within a chain” (Gereffi and Korzeniewicz, 1994, p. 97). Governance in the context of GVC lays on the idea that governance dynamics do not occur spontaneously, automatically or even systematically. Rather they are the consequences of strategies and decisions of specific actors (Gibbon et al., 2008, p. 319; Ponte and Sturgeon, 2014, p. 200). Indeed, the question of governance arises when some firms set up parameters under which others in the chain operate (Humphrey and Schmitz, 2001, pp. 20–22). Finally, GVC and GPN pieces of literature are interested in different aspects of the governance question. Sturgeon (2001, p. 10) proposes the following distinction between them. On the one hand, GVC literature highlights the chain dynamic side, as GVC are reused and reconfigured on an ongoing basis, and as some economic
actors bypass them. On the other hand, GPN researchers focus on inter-firm relationship's nature and extent that bind sets of firms into larger economic groups. Beyond these points, it seems that these three frameworks are all pointing the same issue at least for this doctoral research: the chain governance. Consequently, I combine the three pieces of literature, and I use the term GVC that encompasses GCC and GPN. For a better understanding of the issue of governance, I believe that a presentation of the various GVC types is needed. That is the topic of the following section.
2. Global Value Chain evolution
The context has changed over time. So do GVC configurations. This section is dedicated to highlighting a specific change, that is the outsourcing trend, along two axes: (1) the activities endeavored by the most powerful actors in the chain (Section 2.1.); and (2) the consequences of the disaggregation of a GVC (Section 2.2.).
2.1. Producer or buyer-driven chains: From a strict dichotomy…
Relating to the issues raised by governance in GVC, Gereffi (1999, 2001) proposes as a starting place to distinguish two distinct types of international chain configurations: producer-driven and buyer-driven chains3
. Both types of chain require coordination from powerful actors, namely lead firms. The Organisation for Economic Co-operation and Development (2008, p. 47) defines lead firms as “enterprises (major players) that consistently operate value adding processes on both sides of the focal point, i.e. both in production and in marketing/distribution”. The tabular comparison below provides us a fairly accurate idea of the similarities and differences between the two types of interest in this study.
The classical form of GVC is producer-driven. Here, a handful of transnational corporations (TNC) and final product manufacturers govern the chain and have the role of lead firms. In this situation, the key parameters are set by these lead firms that control key product and process technologies (Humphrey and Schmitz, 2001, pp. 21–22). Thus, companies take advantage of economies of scale and technological advances to earn money. Indeed, in capital-, technology- and, skill-intensive industries, such as electronics (e.g. Sturgeon, 2002) and automobile industries (e.g., Sturgeon et al., 2008), technology and production expertise are core competencies that require to be developed and deployed either in-house (i.e. vertically integrated chain), or by “closely affiliated ‘captive' suppliers that can be blocked from sharing them with competitors” (see Section 4.5.; Ponte and Sturgeon, 2014, pp. 201–202). Thus, actors evolve in a vertically integrated chain.


![[Why teams in charge of children after a pediatric intensive care unit stay do not take into account the treatment limitation decisions previously made by intensivists].](data:image/gif;base64,R0lGODlhAQABAIAAAP///wAAACH5BAEAAAAALAAAAAABAAEAAAICRAEAOw==)