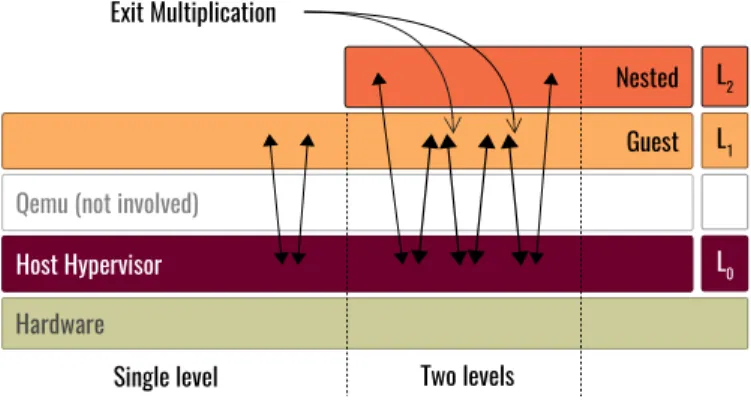
Hypertracing: Tracing through virtualization layers
Texte intégral
Figure


Documents relatifs
LOADING PEST FROM TAPE 2 LOADING PEST FROM DRUM 4 Legitimate Control Characters 4 Illegitimate Control Characters 4 FILES FROM TAPE 5 THE EDITOR UNDER PEST CONTROL 6 EDITOR
o An operating system, Including a text editor, 'debugger, window and file system, written entirely in Lisp.. LABEL -HI XItt- DRAI.I-LABEL -MET HOD TV:
Zaprionus indianus is assigned to the subgenus Zaprionus, species group armatus and species subgroup vittiger (Chassagnard, 1988; Chassagnard and Tsacas, 1993).. We provide here
Figure 3: Detection rate of our classifiers against mimicry attacks in which an increasing number of benign samples is added to each malware sample, for JavaScript and
La version lampadaire est équipée d’un câble prévu pour l’extérieur d’une longueur de 5 mètres avec prise Schuko IP44 et interrupteur variateur à pédale rétro-éclairé
1 ARBORESCENCE Suspension, lampadaire, lampe de table – Pendant light, floor & table lamp Hervé Langlais 2021.. Collection ouverte, Arborescence est une
using other records in the lake sediment, including pollen (vegetation change), diatoms (lake water pH and chemistry), SOOt (coal combustion), charcoal (wood combustion),
(.tbereallllrltetforldf'-directedieaminginaworid with values largely framed within a formal context? A5educaton,exploringooD- forma1 autonomous leaming, weseek clues 10
