HAL Id: hal-00620362
https://hal-upec-upem.archives-ouvertes.fr/hal-00620362
Submitted on 30 Sep 2011
HAL is a multi-disciplinary open access
archive for the deposit and dissemination of
sci-entific research documents, whether they are
pub-lished or not. The documents may come from
teaching and research institutions in France or
abroad, or from public or private research centers.
L’archive ouverte pluridisciplinaire HAL, est
destinée au dépôt et à la diffusion de documents
scientifiques de niveau recherche, publiés ou non,
émanant des établissements d’enseignement et de
recherche français ou étrangers, des laboratoires
publics ou privés.
Genes Order and Phylogenetic Reconstruction:
Application to γ-Proteobacteria
Guillaume Blin, Cedric Chauve, Guillaume Fertin
To cite this version:
Guillaume Blin, Cedric Chauve, Guillaume Fertin. Genes Order and Phylogenetic Reconstruction:
Application to γ-Proteobacteria. 3rd Annual RECOMB Satellite Workshop on Comparative Genomics
(RECOMB-CG’05), Sep 2005, Dublin, Ireland, Ireland. pp.11-20. �hal-00620362�
Genes order and phylogenetic reconstruction:
application to γ-Proteobacteria
Guillaume Blin1, Cedric Chauve2 and Guillaume Fertin1
1 LINA FRE CNRS 2729, Universit´e de Nantes
2 rue de la Houssini`ere, BP 92208 - 44322 Nantes Cedex 3, France [blin,fertin]@lina.univ-nantes.fr
2 LaCIM et D´epartement d’Informatique, Universit´e du Qu´ebec `A Montr´eal
CP 8888, Succ. Centre-Ville, H3C 3P8, Montr´eal (QC), Canada [email protected]
Abstract. We study the problem of phylogenetic reconstruction based on gene order for whole genomes. We define three genomic distances between whole genomes represented by signed sequences, based on the matching of similar segments of genes and on the notions of breakpoints, conserved intervals and common intervals. We use these distances and distance based phylogenetic reconstruction methods to compute a phy-logeny for a group of 12 complete genomes of γ-Proteobacteria.
Keywords: Phylogenetic reconstruction, breakpoints, common inter-vals, conserved interinter-vals, γ-Proteobacteria, gene families.
1
Introduction
Methods based on gene orders have proved to be powerful for the study of evolu-tion, both for eukaryotes [8, 9] and for prokaryotes [11, 2]. The main algorithmic methods developed for this purpose are based on a representation of a genome by a signed permutation (see several survey chapters in the recent book [12] for example). At first, this representation of genomes implies that these methods should be limited to the comparison of genomes having the exact same gene content and where there is a unique copy of each gene in each genome. This model thus fits perfectly with the study of gene order in mitochondrial genomes, for example [5]. However, in general, genomes do not share the same gene content or some gene families are not trivial – a given gene can occur more than once in a genome –, which implies that such genomes should be represented by signed sequences instead of signed permutations. There has been several attempts to develop methods for the comparison of such genomes and most of these methods are based on the transformation of the initial data, a set of signed sequences representing genomes, into a set of signed permutations, in order to apply one or several of the algorithms developed in this context. For example, the approach developed by the group of Pevzner for eukaryotic genomes is based on represent-ing a genome by a sequence of synteny blocks, where such a block can contain several genes [8, 9]. Another approach, developed by Sankoff [16], suppresses in
every genome all but one copy of the genes of a gene family (the remaining gene of this family in a genome being called the exemplar gene), which leads to rep-resenting genomes by signed permutations. It is also natural to consider only a subset of the genes of a genome, that belong to families of size one, as it was done for a set of 30 γ-Proteobacteria in [2]. Finally, a recent approach is based on the computation of a matching of similar segments between two genomes that immediately allows to differentiate the multiple copies of a same gene and to represent genomes by signed permutations [19, 6]. This method, combined with the reversal distance between signed permutations, has been shown to give good results on simulated data [19].
In the present work, we are interested in the computation of genomic dis-tances between bacterial genomes, based on gene order for whole genomes, and to assess the quality of these distances for the reconstruction of phylogenies. We define three distances in terms of gene orders based on two main ingredi-ents: (1) the computation of a matching of similar genes segments between two genomes, following the approach of [19], and (2) three measures of conservation of the combinatorial structure: breakpoints, conserved intervals and common in-tervals. This last aspect differs from most of previous works that relied on the reversal distance. Moreover, this is, as far as we know, the first time that dis-tances based on conserved intervals and common intervals are used on real data. We test our distances on a set of 12 γ-Proteobacteria complete genomes studied in [15, 11], and, for two different sets of gene families, we compute phylogenies for these data, using the Fitch-Margoliash method. We then compare the trees we obtain to the phylogenetic tree proposed in [15], based on a Neighbor-Joining analysis of the concatenation of 205 proteins.
2
Distances and gene matching
In this section, we introduce the combinatorial notions and algorithms used in the computation of distances based on gene order conservation for whole genomes. Genomes representation. We represent a genome by a signed sequence on the alphabet of gene families. Every element in a genome is called a gene1 and
belongs to a gene family. For a signed sequence G, one denotes by githe signed
integer representing the ithgene in G. Two genes belong to the same gene family
if they have the same absolute value.
Gene matching. Given two signed sequences G and H, a matching M between G and H is a set of pairs (gi, hj), where gi and hj belong to the same gene family.
Genes of G and H that do not belong to any pair of the matching M are said to be unmatched for M . A matching M between G and H is said to be complete if for any gene family, there are no two genes of this family that are unmatched for
1 This terminology is restrictive as one could use the methods described in this work
considering any kind of genetic marker located on a genome, but we follow the classical terminology and use the word gene through all this paper.
M and belong respectively to G and H. A matching M between G and H can be seen as a way to describe a putative assignment of orthologous pairs of genes between G and H (see [10] for example where this notion was used, together with the reversal distance, to the precise problem of orthologous assignment). In this view, segments of consecutive unmatched genes could represent segments of genes that have been inserted, by lateral transfer for example, or deleted, due to functional divergence of loss of genes after a lateral transfer or a segmental duplication for example, during the evolution.
Given a matching M between two genomes G and H, once the unmatched genes have been removed from these two genomes, the resulting matching M is a perfect matching between the remaining genes of the two genomes. It follows immediately that M defines a signed permutation of |M | elements, denoted PM, as illustrated in Figure 1. We also denote by del(G, M ) and del(H, M ) the
number of maximum segments of consecutive unmatched genes in G and H.
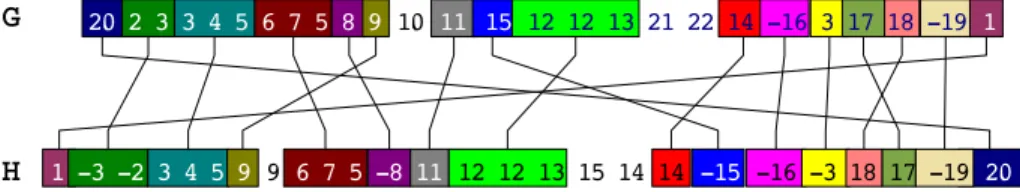
Fig. 1.A possible complete matching M between two genomes G and H represented as signed sequences. In this example, del(G, M ) = del(H, M ) = 2 and PM = 23 -3
-2 4 5 6 11 7 8 9 -10 12 14 15 16 17 -13 18 -19 21 20 22 1
Given G, H and a matching M between G and H, one can define a distance between G and H, induced by M , in terms of one of the classical distances based on signed permutations, applied to the permutation PM, corrected with
del(G, M ) and del(H, M ) in order to take into account modifications of gene order due to events like lateral transfer or loss of genes. In the following, we consider three different distances, based on three measures of the conservation of the combinatorial structure in signed permutations: breakpoints, conserved intervals and common intervals.
The rationale for using the above ideas in the design of a gene order distance between bacterial genomes relies on the observation that during their evolution, prokaryotic genomes seem to have been rearranged mostly by short reversals [14, 18], which implies that close genomes will share similar clusters of genes [17]. Based on this hypothesis, one of the goals of our work was to study how distances based on the conservation of structure allow to capture phylogenetic signal, and we tried the three known measures of conservation of structures: breakpoints is the simplest and has been used for a long time, while the two other distances, based on intervals are more recent but capture more subtle similarities than breakpoints.
Breakpoints distance. Let P = p1, . . . , pmbe a signed permutation. A breakpoint
in P is a pair of consecutive elements pipi+1 such that pi+1!= pi+ 1. We denote
by bkpts(P ) the number of breakpoints of P . Given a matching M between G and H, and the corresponding signed permutation PM, we define the breakpoints
distance between G and H given M as follows:
d Breakpoints(G, H, M ) = bkpts(PM) |M | + del(G, M ) |G| + del(H, M ) |H|
Note that this definition considers, in the computation of the distance, the size of the matching M and the size of the compared genomes, both characteristics that can vary a lot as it appears in our study of γ-Proteobacteria. In the example given in Figure 1, bkpts(PM) = 14, and del(G, M ) = del(H, M ) = 2. We thus
obtain d Breakpoints(G, H, M ) = 14 23+ 2 26+ 2 26 = 0, 806.
Distances based on intervals. The number of breakpoints in a signed permutation is a very natural measure of conservation of the structure of this permutation with respect to the identity permutation. Recently, several more complex mea-sures of such structure conservation have been introduced, and in this work we consider two of them: conserved intervals and common intervals.
A common interval in a signed permutation P is a segment of consecutive elements of this permutation which, when one does not consider signs and order, is also a segment of consecutive elements of the identity permutation (see [3] for an example of the relationship between common intervals and the study of gene order). Conserved intervals of signed permutations were defined in [4]: a segment pi, . . . , pj of a signed permutation P , with i != j, is a conserved interval if it is
a common interval of P and either pi > 0 and pj = pi+ (j − i), or pi< 0 and
pj = pi− (j − i) (in other words, in absolute value, pi and pj are the greatest
and smallest elements of the common interval pi, . . . , pj). For a given signed
permutation P , one denotes respectively by ICommon(P ) and IConserved(P ), the number of common intervals in P and the number of conserved intervals in P .
Given a matching M between G and H, and the corresponding signed permu-tation PM, we introduce here two new distances, based on ICommon(PM) and
IConserved(PM) : one defines the common intervals distance between G and H
given M by d ICommon(G, H, M ) = 1 − 2 ∗ ICommon(PM) |M |2 + del(G, M ) |G| + del(H, M ) |H| and the conserved intervals distance between G and H given M by
d IConserved(G, H, M ) = 1 −2 ∗ IConserved(PM) |M |2 + del(G, M ) |G| + del(H, M ) |H| Computation of a matching. For a given distance model, a parsimonious ap-proach for the comparison of two genomes G and H searches for a matching
M between G and H involving the smallest distance between G and H. Un-fortunately, this problem has been shown to be NP-complete, when using the breakpoints and conserved intervals distances [6, 7]. Swenson et al. [19] proposed a fast heuristic to compute a matching based on a greedy approach consisting on (1) identifying the longest common segment of unmatched genes of G that is also a segment of unmatched genes in H, up to a reversal, (2) matching these two segments of G and H, and (3) repeating the process until a complete matching is found. In [7], Blin and Rizzi have designed a quite similar heuristic using a suffix-tree. We have used the heuristic of Swenson et al. in the present work. Let MG,H denote the matching returned by the heuristic with G as first and H
as second parameters. As our implementation of the heuristic does not return a symmetric matching – matching MG,Hmay differ from MH,G–, we have defined
the distances, respectively of breakpoints, conserved intervals and common in-tervals, between G and H as follows:
d Breakpoints(G, H) = (d Breakpoints(G, H, MG,H) + d Breakpoints(H, G, MH,G))/2 d ICommon(G, H) = (d ICommon(G, H, MG,H) + d ICommon(H, G, MH,G))/2 d IConserved(G, H) = (d IConserved(G, H, MG,H) + d IConserved(H, G, MH,G))/2
3
Experimental results and discussion
Input data. The data set we studied is composed of 12 complete genomes from the 13 γ-Proteobacteria studied in [15]. We have not considered the genome of V.choleraebecause it is composed of two chromosomes, and this is not considered in our model. This data set is composed of the genomes of the following species: Buchnera aphidicola APS(Genbank accession number NC 002528), Escherichia coli K12 (NC 000913), Haemophilus influenzae Rd (NC 000907), Pasteurella multocida Pm70 (NC 002663), Pseudomonas aeruginosa PA01 (NC 002516), Salmonella typhimurium LT2 (NC 003197), Xanthomonas axonopodis pv. citri 306 (NC 003919), Xanthomonas campestris (NC 0 03902), Xylella fastidiosa 9a5c (NC 002488), Yersinia pestis CO 92 (NC 003143), Yersinia pestis KIM5 P12 (NC 004088), Wigglesworthia glossinidia brevipalpis (NC 004344).
Data set and programs used and mentioned in this article can be found on a companion web site at http://www.lacim.uqam.ca/~chauve/CG05.
Gene families. From these 12 genomes, the initial step was to compute a parti-tion of the complete set of genes into gene families, where each family is supposed to represent a group of homologous genes. This partition induces the encoding of the genomes by signed sequences, that is the input of the matchings computa-tion that leads to distance matrices. Hence, the result of a phylogenetic analysis
based on gene order depends strongly on the initial definition of families. Due to this importance of the partition of genes into families, and in order to assess the quality of the distances we defined on our data set of γ-Proteobacteria genomes without relying on a single set of families, we used two different methods to partition genes into gene families. Both are based on alignments of amino-acid sequences with BLAST [1].
The first partition we used is the one computed in [15], in order to define families of orthologous genes used in a Neighbor-Joining analysis of these γ-Proteobacteria genomes, and has been provided to us by Lerat. Briefly, this partition is given by the connected components of a directed graph whose nodes are the coding genes and pseudo-genes of the 12 genomes and there is an edge from gene g to gene h if the bit-score of the BLAST comparison of g against h is at least equal to 30% of the bit-score of the BLAST comparison of g against itself. Details are available in [15].
To compute the second partition we used all coding genes of our 12 genomes, as well as ribosomal and transfer RNAs. For RNAs, the families were decided on the basis of the annotation of the genes. For coding genes, a family is a connected component of the undirected graph whose vertices are genes and where there is an edge between two genes g and h if the alignment computed by BLAST between the sequences of g and h has at least 25% of identity for both sequences, and overlaps at least 65% of both sequences.
We can notice that the matchings of the second partition are always bigger than the ones of the first partition. However, the difference between the two is always relatively small compared to the size of the matchings.
Details on partitions and matchings can be found on the companion web site.
Phylogenetic trees computation. Given a matrix distance, obtained by the algo-rithms described in Section 2, we computed phylogenetic trees using the following Fitch-Margoliash phylogenetic reconstruction method implemented in the fitch command (version 3.63) of the PHYLIP package available at
http://evolution.genetics.washington.edu/phylip.html, where we have used the G (global rearrangements) and J (jumbling, with parameters 3 and 1000) options. We chose this method instead of the classical Neighbor-Joining method because it examines several tree topologies and optimizes a well defined criterion, based on the least-squared error. We have used the retree command of the PHYLIP package to re-root and flip some branches of the trees in order to harmonize the representation of our results with the tree obtained by Lerat et al.in [15, Figure 5].
Results and analysis. Figures 2 and 3 present the trees obtained by applying our method on the breakpoints, common and conserved intervals distances, and the tree given by Lerat et al. using NJ method with the concatenation of 205 proteins [15, Figure 5], that we call the reference tree below.
One can notice that these trees agree relatively well with the reference tree. Indeed, we can stress the following points:
1. Using either set of gene families, one can notice that there are always differ-ences that concern the taxa Buchnera aphidicola and Wigglesworthia glossini-dia brevipalpis. However, Herbeck et al. [13] suggested that the fact that this clade exists in the results from Lerat et al. [15] is due to a bias in GC com-position.
2. Using the first partition, and if we do not consider the case of Buchnera aphidicola and Wigglesworthia glossinidia brevipalpis discussed above, one can notice that the tree obtained with the breakpoints distance agrees with the reference tree (Figure 2 (a)). Concerning the two other distances (con-served intervals and common intervals distances), the only difference lies in the position of Pseudomonas aeruginosa (Figures 2 (b) and 2 (c)).
3. Using the second partition, we also see that the tree obtained with the breakpoints distance agrees with the reference tree (Figure 3 (a)), if Buchn-era aphidicolaand Wigglesworthia glossinidia brevipalpis are not considered. Using any of the two other distances (conserved intervals and common inter-vals distances), the only difference concerns the group of taxa Haemophilus influenzaeand Pasteurella multocida, that is placed at a different position (Figures 3 (b) and 3 (c)).
Thus, we can say that the distances we defined capture a significant phyloge-netic signal, and provide good results on real data. However, the use of distance relying on intervals, as opposed to the one based on breakpoints, seems to imply some inaccuracy in the trees we obtained. This should not come as a surprise, since our matching computation method is optimized for the breakpoints dis-tance.
4
Conclusion
In this first study, we proposed a simple approach for the phylogenetic recon-struction for prokaryotic genomes based on the computation of gene matchings and distances expressed in terms of combinatorial structure conservation. De-spite its simplicity, our approach gave interesting results on a set of 12 genomes of γ-Proteobacteria, as the trees we computed agree well with the tree computed in [15] and based on the concatenation of the sequences of 205 proteins. It should be noted that our results agree well too with another recent study based on gene order and signed permutations [2]. Moreover, this study raises several interesting questions.
First, the initial computation of gene families plays a central role in the gene order analysis. In [2] for example, where 30 γ-Proteobacteria genomes were considered, these families were designed in such a way that each one contains exactly one gene in every genome. As a consequence, if one considers all other genes as member of families of size one, there is only one possible matching for every pair of genomes. Based on these families, phylogenetic trees based on the reversal and breakpoints distances were computed. Our approach can be seen as less strict in the sense that pairwise genomes comparisons are not based only on
Fig. 2.Experimental results with the first set of gene families ([15]). (a) breakpoints distance. (b) common intervals distance. (c) conserved intervals distance. (d) reference tree obtained by Lerat et al. [15, Figure 5]. In gray, the genome not considered in our experiments. In black, Buchnera aphidicola and Wigglesworthia glossinidia brevipalpis.
genes that are present in all genomes, and our results agree quite well with the results of [2]. But more generally, it would be interesting to study more precisely the influence of the partition of the set of all genes into families on the whole process, and in particular the impact of the granularity of such a partition.
Second, a method for the validation of the computed trees, similar to the bootstrap commonly used in phylogenetic reconstruction, would be a very valu-able tool. This lack of a validation step in our analysis was one of the main reasons that led us to use the Fitch-Margoliash method, that tries several topolo-gies, instead of the Neighbor-Joining method. A validation method, based on a Jackknife principle was introduced in [2], but it was not clear how to use it in
Fig. 3.Experimental results with the second set of gene families. (a) breakpoints dis-tance. (b) common intervals disdis-tance. (c) conserved intervals disdis-tance. (d) reference tree obtained by Lerat et al. [15, Figure 5]. In gray, the genome not considered in our experiments. In black, Buchnera aphidicola and Wigglesworthia glossinidia brevipalpis.
our context where the matchings used in pairwise comparisons can have very different sizes.
Finally, we think that an important point in the development of methods similar to the one described in this work should rely into the link between the computation of a matching and the kind of measure of structure conservation that is used to define a distance. Indeed, the principle of computing a matching by the identification of similar segments is natural when breakpoints are used, as two similar matched segments define only breakpoints at their extremities. But when using distances based on intervals, it would clearly be more interesting to consider also segments of similar gene content but maybe not with the same order of the genes.
References
1. S.F. Altschul, T.L. Maden, A.A. Schaffer, J. Zhang, Z. Zhang, W. Miller, and D.J. Lipman. Gapped blast and psi-blast: a new generation of protein database search programs. Nucleic Acids Res., 25(17):3389–3402, 1997.
2. E. Belda, A. Moya, and F.J. Silva. Genome rearrangement distances and gene order phylogeny in γ-proteobacteria. Mol. Biol. Evol., 22(6):1456–1467, 2005. 3. S. B´erard, A. Bergeron, and C. Chauve. Conserved structures in evolution
scenar-ios. In Comparative Genomics, RECOMB 2004 International Workshop, volume 3388 of Lecture Notes in Bioinformatics, pages 1–15. Springer, 2004.
4. A. Bergeron and J. Stoye. On the similarity of sets of permutations and its appli-cations to genome comparison. In 9th International Computing and Combinatorics Conference (COCOON ’03), volume 2697 of Lecture Notes in Computer Science, pages 68–79. Springer, 2003.
5. M. Blanchette, T. Kunisawa, and D. Sankoff. Gene order breakpoint evidence in animal mitochondrial phylogeny. J. Mol. Evol., 49(2):193–203, 1999.
6. G. Blin, C. Chauve, and G. Fertin. The breakpoints distance for signed sequences. In 1st International Conference on Algorithms and Computational Methods for Biochemical and Evolutionary Networks, CompBioNets 2004, volume 3 of Texts in Algorithms, pages 3–16. KCL Publications, 2004.
7. G. Blin and R. Rizzi. Conserved interval distance computation between non-trivial genomes. In 11th International Computing and Combinatorics Conference (COCOON ’05), 2005. To appear in Lecture Notes in Computer Science.
8. G. Bourque, P.A. Pevzner, and G. Tesler. Reconstructing the genomic architecture of ancestral mammals: lessons from human, mouse and rat genomes. Genome Res., 14(4):507–516, 2004.
9. G. Bourque, E.M. Zdobnov, P. Bork, P.A. Pevzner, and G. Tesler. Compara-tive architectures of mammalian and chicken genomes reveal highly variable rates of genomic rearrangements across different lineages. Genome Res., 15(1):98–110, 2005.
10. X. Chen, J. Zheng, Z. Fu, P. nan, Y. Zhong, S. Lonardi, and T. Jiang. Computing the assignment of orthologous genes via genome rearrangement. In 3rd Asia-Pacific Bioinformatics Conference 2005, pages 363–378. Imperial College Press, 2005. 11. J.V. Earnest-DeYoung, E. Lerat, and B.M.E. Moret. Reversing gene erosion:
Re-constructing ancestral bacterial genomes from gene-content and order data. In Algorithms in Bioinformatics, 4th International Workshop, WABI 2004, volume 3240 of Lecture Notes in Bioinformatics, pages 1–13. Springer, 2004.
12. O. Gascuel, editor. Mathematics of Evolution and Phylogeny. Oxford University Press, 2005.
13. J.T. Herbeck, P.H. Degnan, and J.J. Wernegreen. Nonhomogeneous model of se-quence evolution indicates independent origins of primary endosymbionts within the enterobacteriales (γ-proteobacteria). Mol. Biol. Evol., 22(3):520–532, 2004. 14. J-F. Lefebvre, N. El-Mabrouk, E. Tillier, and D. Sankoff. Detection and validation
of single gene inversions. Bioinformatics, 19(Suppl. 1):i190–i196, 2003.
15. E. Lerat, V. Daubin, and N.A. Moran. From gene tree to organismal phylogeny in prokaryotes: the case of γ-proteobacteria. PLoS Biology, 1(1):101–109, 2003. 16. D. Sankoff. Genome rearrangement with gene families. Bioinformatics, 15(11):909–
917, 1999.
17. D. Sankoff. Short inversions and conserved gene clusters. Bioinformatics, 18(10):1305–1308, 2002.
18. D. Sankoff, J-F. Lefebvre, E. Tillier, A. Maler, and N. El-Mabrouk. The distri-bution of inversion lengths in prokaryotes. In Comparative Genomics, RECOMB 2004 International Workshop, RCG 2004, volume 3388 of Lecture Notes in Bioin-formatics, pages 97–108. Springer, 2005.
19. K.M. Swenson, M. Marron, J.V Earnest-DeYoung, and B.M.E. Moret. Approxi-mating the true evolutionary distance between two genomes. In Proceedings of the seventh Workshop on Algorithms Engineering and Experiments and Second Work-shop on Analytic Algorithmics and Combinatorics (ALENEX/ANALCO 2005). SIAM, 2005.
![Fig. 2. Experimental results with the first set of gene families ([15]). (a) breakpoints distance](https://thumb-eu.123doks.com/thumbv2/123doknet/8121189.272539/9.918.218.720.119.595/fig-experimental-results-set-gene-families-breakpoints-distance.webp)

