HAL Id: hal-00665939
https://hal.archives-ouvertes.fr/hal-00665939
Submitted on 3 Feb 2012
HAL is a multi-disciplinary open access
archive for the deposit and dissemination of
sci-entific research documents, whether they are
pub-lished or not. The documents may come from
teaching and research institutions in France or
abroad, or from public or private research centers.
L’archive ouverte pluridisciplinaire HAL, est
destinée au dépôt et à la diffusion de documents
scientifiques de niveau recherche, publiés ou non,
émanant des établissements d’enseignement et de
recherche français ou étrangers, des laboratoires
publics ou privés.
2D NO-REFERENCE VIDEO QUALITY MODEL
DEVELOPMENT AND 3D VIDEO TRANSMISSION
QUALITY
Kjell Brunnström, Inigo Sedano, Kun Wang, Marcus Barkowsky, Maria Kihl,
Borje Andrén, Patrick Le Callet, Marten Sjöström, Andreas Aurelius
To cite this version:
Kjell Brunnström, Inigo Sedano, Kun Wang, Marcus Barkowsky, Maria Kihl, et al..
2D
NO-REFERENCE VIDEO QUALITY MODEL DEVELOPMENT AND 3D VIDEO TRANSMISSION
QUALITY. Sixth International Workshop on Video Processing and Quality Metrics for Consumer
Electronics - VPQM 2012, Jan 2012, Scottsdale, Arizona, United States. pp.1-6. �hal-00665939�
2D NO-REFERENCE VIDEO QUALITY MODEL DEVELOPMENT AND 3D VIDEO TRANSMISSION QUALITY
Kjell Brunnström1, Iñigo Sedano2, Kun Wang 1,5, Marcus Barkowsky3, Maria Kihl4, Börje Andrén1, Patrick LeCallet3,Mårten Sjöström5 and Andreas Aurelius1
1Acreo AB, Kista, Sweden, 2Tecnalia Research & Innovation, Bilbao, Spain, 3IRCCyN, Nantes; France, 4Lund University,
Lund, Sweden, 5Mid Sweden University, Sundsvall, Sweden
ABSTRACT
This presentation will target two different topics in video quality assessment. First, we discuss 2D no-reference video quality model development. Further, we discuss how to find suitable quality for 3D video transmission.
No-reference metrics are the only practical option for monitoring of 2D video quality in live networks. In order to decrease the development time, it might be possible to use full-reference metrics for this purpose. In this work, we have evaluated six full-reference objective metrics in three different databases. We show statistically that VQM performs the best. Further, we use these results to develop a lightweight no-reference model.
We have also investigated users’ experience of stereoscopic 3D video quality by performing the rating of two subjective assessment datasets, targeting in one dataset efficient transmission in the transmission error free case and error concealment in the other. Among other results, it was shown that, based on the same level of quality of experience, spatial down-sampling may lead to better bitrate efficiency while temporal down-sampling will be worse. When network impairments occur, traditional error 2D concealment methods need to be reinvestigated as they were outperformed switching to 2D presentation.
1. INTRODUCTION
The field of video quality assessment is maturing, which means that there exist useful solutions for some problems. One example that could be mentioned is 2D offline video quality assessment targeting errors induced primarily by video coding using objective metric. Here, there exist both standardized, e.g. [1], and commercial well performing solutions. Of course, there are still many unsolved problems. Two recent trends have drawn quite a lot of attention, which also stressed the need for new solutions. One trend is that streaming high quality digital video over Internet is increasing in popularity both among users and operators. Two examples of these applications are IPTV and Over The Top (OTT) Video. IPTV systems are managed by one operator, from video head-end to the user, and are based on ordinary broadcast television, using IP multicast. OTT Video is used to describe the delivery
of TV over the public Internet, using unicast. Another trend is the emerging 3D video distribution. 3D videos are riding their success from cinema to home entertainment markets such as TV, DVD, Blu-ray, video games, etc. There is an industrial push for bringing the 3D video into the home and it has reached the early adopters, but it is still a long way to a more general embracement of the new technology.
This paper will give an overview of two recent studies that we have performed to address these new recent trends. First, we will present the work targeting quality assessment of streaming digital video over the Internet and how to decrease development time in the development of no-reference video quality models. Then, we will present some results of subjective experiments in 3D video quality, which will give hints on efficient 3D video transmission, but also will provide useful insight into subjective testing methodologies and cross laboratory comparisons.
2. 2D NO-REFERENCE VIDEO QUALITY MODEL DEVELOPMENT
Video quality model development usually involves extensive subjective testing. Since this is both time consuming and expensive, it would be good if some of the subjective testing could be exchanged with the usage of stable and mature video quality models. For the case of most interest at the moment i.e. no-reference models for streaming video quality monitoring, this may indeed be possible by using off-line full-reference video quality metrics. For finding a suitable full-reference model, we have evaluated six video quality metrics against three publicly available databases. We performed this evaluation of two reasons. First, the databases contain errors that are of interest for the application we are studying. Second, most earlier evaluations have been performed comparing to a high quality, assumed uncompressed, reference, which is not available in most practical monitoring situations, so we have here compared to a compressed reference. For more detail on this work, see [2].
2.1. Full-reference model evaluation
2.1.1. Method
1 that corresponds to compressed reference. The reference videos are lightly compressed to ensure high video quality in the absence of packet losses. The references are thus similar in quality to the uncompressed original. Therefore, in the compressed reference scenario, the video is first compressed before used in the evaluation. The decompressed video with compression distortions is compared to the decompressed video with compression and transmission distortions.
Figure 1 Full-reference scenario with compressed reference. We have evaluated and compared several well-known objective video quality algorithms using the videos and subjective results in the three databases. The objective algorithms are: Peak Signal to Noise Ratio (PSNR), Structural SIMilarity (SSIM)[3], Multi-scale SSIM (MS-SSIM)[4], Video Quality Metric (VQM)[5], Visual Signal to Noise Ratio (VSNR)[6] and MOtion-based Video Integrity Evaluation (MOVIE)[7]. The default values of the metrics were used for all the metrics. No registration problems, i.e. a misalignment between the reference and degraded videos due to the loss of entire frames, occurred in the dataset.
In order to test the performance of the objective algorithms we computed the Spearman Rank Order Correlation Coefficient (SROCC), the Pearson correlation coefficient, the Root Mean Square Error (RMSE) and the Outlier Ratio (OR), as performed by the Video Quality Experts Group (VQEG)[8].
The Pearson, RMSE and Outlier Ratio were computed after a non-linear regression. In the analysis of the EPFL-PoliMI video database the regression was performed using a monotonic cubic polynomial function with four parameters. The function is constrained to be monotonic:
𝐷𝑀𝑂𝑆𝑝 = 𝑎 ∙ 𝑥3+ 𝑏 ∙ 𝑥2+ 𝑐 ∙ 𝑥 + 𝑑
In the above equation, the DMOSp is the predicted value.
In the analysis of the other two databases a monotonic logistic function with four parameters was used instead:
𝐷𝑀𝑂𝑆𝑝 = 𝛽1− 𝛽2 1 + exp (− 𝑥 − 𝛽3
|𝛽4| )
+ 𝛽2
In each of the databases, we used the function providing the best fitting. The performance of the metrics is compared by means of a statistical significance analysis based on the Pearson, RMSE and Outlier Ratio coefficients[8]
The subjective video quality databases used in this evaluation was EPFL-PoliMI video database[9], the HDTV database[10], and the LIVE Wireless video database[11].
2.1.1. Results
From the EPFL-PoliMI video database it was found that the values for the Pearson correlation coefficient ranged from 0.92 (for TEMPORAL MOVIE) to 0.98 (for SPATIAL MOVIE). The values for the Spearman rank order correlation coefficient were confined within 0.91 (TEMPORAL MOVIE) and 0.98 (SPATIAL MOVIE). Looking also at the RMSE, the TEMPORAL MOVIE performed significantly worse than the other methods. In general the magnitude of the coefficients was high and the differences between them were small. The statistical significance analysis based on Pearson and RMSE confirms that at 95% confidence level MS-SSIM, VSNR, VQM, MOVIE and SPATIAL MOVIE performed better than TEMPORAL MOVIE, being SPATIAL MOVIE the best performing metric.
The values for the Pearson correlation coefficient in the HDTV video database, when the reference was lightly compressed, were distributed within 0.82 (for PSNR) and 0.89 (for MS-SSIM). The values for the Spearman rank order correlation coefficient were confined within 0.80 (for PSNR) and 0.88 (for MS-SSIM). The general magnitude of the coefficients was high. The statistical significance analysis based on Pearson and RMSE shows that at 95% confidence level there were no significant differences between the studied metrics.
Further, for the HDTV video database when the reference was uncompressed, the values for the Pearson correlation coefficient ranged from 0.63 (for VSNR) to 0.84 (for VQM). The values for the Spearman rank order correlation coefficient had the lowest value at 0.51 (VSNR) and the highest at 0.78 (VQM). The general magnitude of the coefficients was low. The statistical significance analysis based on RMSE shows that at 95% confidence level VQM performed better than VSNR.
The analysis of the LIVE Wireless database showed that the values for the Pearson correlation coefficient were
Video uncompressed original
Video uncompressed with compression and transmission distortions
Video compressed
Transmission distortions
Video compressed with transmission distortions Full reference metric
Video uncompressed with compression distortions
distributed within 0.93 (for VSNR) and 0.97 (for VQM). The values for the Spearman rank order correlation coefficient were confined within 0.95 (VSNR) and 0.97 (VQM). The general magnitude of the coefficients was very high and the differences between them were small. The statistical significance analysis based on Pearson and RMSE shows that at 95% confidence level VQM performed better than all the other metrics.
2.1.1. Discussion
Our results showed that VQM had a very good performance in all the tested databases, being the best metric among the studied in the HDTV video database (uncompressed reference) and in the LIVE Wireless video database. In the EPFL-PoliMI video database, SPATIAL MOVIE performed better than the other metrics. On the other hand, the performance of TEMPORAL MOVIE was lower than the other metrics, at least for the EPFL-PoliMI video database.
In the results from the HDTV video database we can appreciate that the accuracy in the prediction can be increased if the reference is compressed, compared to the case where the reference is uncompressed.
2.2 No-reference model development
2.2.1. Generation of training data
We selected the VQM metric to develop a no-reference model because of the very good performance shown in the previous section.
Sequences with resolution 1920x1080 pixels were downloaded from the Consumer Digital Video Library (CDVL) database [12], with different characteristics. In five of the videos, the final part was removed to generate videos of a total length of 17s at 30 fps. One of the sequences had a total length of 14s at 25 fps. The videos were converted from YUV packed 4:2:2 to YUV planar 4:2:0. The videos were compressed with the Quantization Parameter set to 26, 32, 38 and 44. The parameter keyint in the x264 encoder, corresponding to the interval between IDR-frames, was set to 12, 36, 60 and 84. The maximum slice size was set to 1400 bytes. We consider that the keyint parameter is important since the distortion due to a packet loss propagates until the next IDR frame. Thus a higher value implies more error propagation and lower video quality. Finally the packet loss rate was set to 0.1%, 1%, 3%, 5% and 10%. In total 6x4x4x5=480 distorted videos were evaluated using the VQM metric.
The videos were encoded with the x264 encoder [13] random packet losses were inserted using a packet loss simulator [14] and the videos were decoded with the ffmpeg decoder. The ffmpeg decoder produces incomplete video files when random packet losses are inserted. To be
able to apply the VQM metric, the videos were reconstructed so that they had the same length as the original. The reconstruction was done in two steps. First, the frame numbers were inserted into the luminance information of the uncompressed original sequence. After decoding the videos the frame numbers were read and used to identify the missing frames and reconstruct the decoded video.
2.2.2. Model development
In this case, our objective was to develop a lightweight model to predict the quality of the video as a function of two parameters: packet loss rate in percentage, denoted p, and interval between IDR-frames in number of frames, denoted I. p b p b p b I b I b I b b VQM = + ⋅ + ⋅ + ⋅ + ⋅ + ⋅ + 6⋅ 2 5 3 4 3 2 2 3 1 0
With the nonlinear fit, we obtained the following no-reference model for the predicted quality, f(I,p):
p p p I I p I f ⋅ + ⋅ − ⋅ + ⋅ + ⋅ − − = 1106 . 0 0092 . 0 0003 . 0 0064 . 0 0001 . 0 16 . 0 ) , ( 2 3 2 2.2.2. Model validation
To validate the no-reference model, we applied the model to the EPFL-PoliMI and LIVE Wireless Video Quality Assessment databases and we calculated the linear correlation coefficient with the subjective values. As the interval between IDR frames is fixed in all the databases used, we are only able to verify the part of the equation related to the packet loss rate. For the EPFL-PoliMI we obtained a linear correlation coefficient of 0.945 and for the LIVE Wireless Video Quality Assessment database we obtained a linear correlation coefficient of 0.903. We believe that the model can be improved by adding new parameters and improving the fitting function used. The important fact is that these results validate the methodology followed in order to develop a no-reference model.
3D VIDEO TRANSMISSION QUALITY The perceived video quality is of highest importance for the adoption of a new technology from a user’s point of view and thus, consequently, from an industry perspective. Subjective assessment is commonly used to measure users’ quality of experience. For the evaluation in 2D, many standards exist and they have been used over the years in small and large scale evaluations, e.g. VQEG [8]. In 3DTV, some traditional image quality parameters such as perceived sharpness or perceived resolution will affect the users’ experience differently when compared to the same image characteristics in traditional 2D e.g. [15]
In this paper, users’ experience of stereoscopic 3D video quality was investigated on two subjective data sets.
The Absolute Category Rating with Hidden unimpaired Reference video (ACR-HR) assessment method was used. The two data sets are distinguished by focusing on error concealment methods in one set and focusing on different coding and transmission scenarios in the other data set. The performance of state of the art video compression standards and various pre-processing techniques were evaluated in the second experiment. For the second data set, two subjective assessments were conducted in two different laboratories which gave quality judgments based on two distinct panels of observers in two different countries. In addition to answering on a general five point ACR scale, the subjects were asked to indicate visual comfort on a second scale. For more details on this work, see [16,17].
3.1. Methods
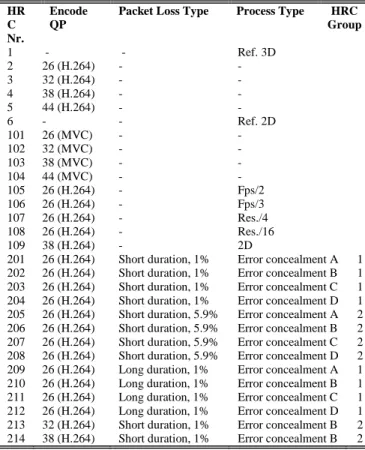
All video sequences for the subjective experiments were prepared in a simulated transmission chain, as shown in Figure 2. Several different scenarios, called Hypothetical Reference Circuits (HRC) or processing conditions were used in creating the Processed Video Sequences (PVS), see Table 1. In total, 11 source stereoscopic video sequences (SRC) were extracted out of 7 different longer video clips for the subjective experiments. Each SRC was about 10 seconds long and had a higher resolution than SDTV. The sequences cover content from low motion and low detail to high motion and high detail.
Figure 2: General outline of the processing chain for generating 3D test video sequences
Table 1 lists all HRC conditions. HRC1-6 were used in both experiments, HRC 101-109 were only used in coding efficiency experiment, and HRC201-214 were used only in the packet loss and error concealment experiment. In order to cover the range of typical coding qualities, the quantization parameter (QP) was varied from 26 to 44 with a step size of six.
Temporal and spatial resampling was based on the simulcast coding with QP at 26. HRC 1 is an uncompressed and undistorted video that acted as a reference 3D video to compare to the other conditions. For each source video, a corresponding 2D reference presentation, HRC 6, was also introduced by duplicating the left view video and displaying the same view for the left and the right eye. This provides a pure 2D impression
with zero disparity on the 3D screen while avoiding deactivation of the shutter glasses.
Table 1: HRC used in the 3D video test
Most processes were symmetrically applied to both views, thus for a certain sequences the video processing was equally imposed on both the left and the right view of the stereoscopic videos. The exception was that the packet losses were introduced only in one of the two views. In order to avoid obvious patterns for the choice of the degraded view, the PVS were split in two groups in the packet loss experiment as indicated by the rightmost column of Table 1. For group 1, the left view was distorted for all odd SRC and the right view was distorted for all even SRC. The inverse applies to group 2.
The transmission errors were grouped as follows. A “short” duration means that the bitstream was only degraded from 39% to 58% while a “long” degradation indicates that the packets were lost in between 10% and 70% of the 10 seconds PVS.
Most of the transmission error scenarios were based on encoding at the highest evaluated video quality with a QP equal to 26. However, HRC213 and HRC214 were included with the smallest transmission error impairment but a QP of 32 and 38.
Four different error concealment strategies were
AVC or MVC coding Subjective Experiment Spatial / temporal Downsampling (optional) Spatial / temporal Upsampling (optional) SRC AVC or MVC decoding Network simulation (optional packet losses)
3D error concealment (optional) PVS HR C Nr. Encode QP
Packet Loss Type Process Type HRC Group 1 - - Ref. 3D 2 26 (H.264) - - 3 32 (H.264) - - 4 38 (H.264) - - 5 44 (H.264) - - 6 - - Ref. 2D 101 26 (MVC) - - 102 32 (MVC) - - 103 38 (MVC) - - 104 44 (MVC) - - 105 26 (H.264) - Fps/2 106 26 (H.264) - Fps/3 107 26 (H.264) - Res./4 108 26 (H.264) - Res./16 109 38 (H.264) - 2D
201 26 (H.264) Short duration, 1% Error concealment A 1 202 26 (H.264) Short duration, 1% Error concealment B 1 203 26 (H.264) Short duration, 1% Error concealment C 1 204 26 (H.264) Short duration, 1% Error concealment D 1 205 26 (H.264) Short duration, 5.9% Error concealment A 2 206 26 (H.264) Short duration, 5.9% Error concealment B 2 207 26 (H.264) Short duration, 5.9% Error concealment C 2 208 26 (H.264) Short duration, 5.9% Error concealment D 2 209 26 (H.264) Long duration, 1% Error concealment A 1 210 26 (H.264) Long duration, 1% Error concealment B 1 211 26 (H.264) Long duration, 1% Error concealment C 1 212 26 (H.264) Long duration, 1% Error concealment D 1 213 32 (H.264) Short duration, 1% Error concealment B 2 214 38 (H.264) Short duration, 1% Error concealment B 2
applied. Error concealment strategy “A” consists of directly playing back the decoded video. Error concealment strategy “B” implements a switching to a 2D presentation when an error occurs in one view. In error concealment strategy “C”, the last frame that was correctly received for both views is displayed while the effects of the transmission errors are affecting one view. The fourth error concealment strategy “D” is similar to “C” but instead of stopping the video completely, it is assumed that a buffer of video frames exists which contains half a second of decoded content, corresponding to 12 frames in our experiment. These 12 frames were slowly played back during the recovery time of the decoder.
The subjective data set for coding efficiency was assessed in two distinct subjective experiments at two labs independently: at the University of Nantes IRCCyN, France (Lab 1) and Acreo AB, Sweden (Lab 2). The packet loss experiment was only conducted at Lab 1.
The lab environments adhere to the lab setup defined in the recommendation ITU-R BT.500-11[26]. The 23” Dell Alienware OptX LCD display (120Hz, resolution 1920x1080p) was used for displaying 3D videos in the experiment together with a pair of active shutter glasses from the Nvidia 3D vision system. The viewing distance was set to 3 times of the display height. The voting interface for the viewers to rate the video quality was shown on a separate display. The video sequences were displayed in uncompressed format in order to make sure that all observers were given the same presentation of the same video sequence.
In both experiments rating session were using the ACR-HR method, using a five-point quality scale defined (Excellent, Good, Fair, Poor and Bad, which are later mapped to the scores 5, 4, 3, 2, and 1 respectively)
3.1. Results
In total 41 (21 male and 20 female) valid naïve observers (24 at each lab) participated in the coding efficiency subjective experiment. For the packet loss experiment, a total of 28 valid observers participated.
After analyzing the similarities and difference between the experiments it was judged that it could be combined into a common dataset and analyzed together.
One the analysis performed was to look at bitrate efficiency. The “bitrate gain” indicates the amount of bitrate that can be saved while the MOS remains constant, i.e. the service provider offers a guaranteed quality of 3DTV services. In Figure 3, it can be seen that MVC is more efficient than AVC, and also the resolution reduction is bitrate efficient, but frame rate reduction is not.
Figure 3: Bitrate gain compared to AVC
Regarding the evaluation of error concealment strategies for the stereoscopic videos with transmission errors, the error concealment method B, (switch to 2D mode) used in the HRC number 202, 206, and 210, was significantly preferred to all other methods in all 3 error categories (1% packet loss for short duration, 5.9% for short duration and 1% for long duration). The MOS value of HRC202 and HRC206 was still voted as “good”. The standard error concealment method of the H.264 decoder (version A), used in HCR number 201 and 209, was preferred compared to the versions C (HCR 203 and 211) and D (HCR 204 and 212), when the percentage of errors was low (1% in both short and long duration). However, for a high percentage of packet loss of 5.9%, it became the opposite, where concealment case A (HRC205) was rated lowest. There was no statistical significant difference between the method C and D, which indicates that immediate “freezing” was similarly annoying as slowing down.
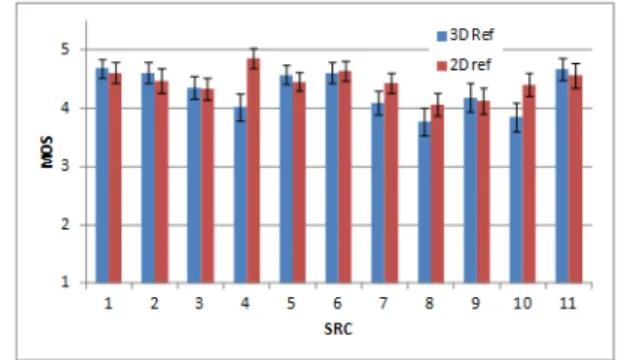
One somewhat unexpected result was that the observers preferred 2D before 3D. In Figure 4 the MOS for 2D reference compared to the 3D reference. The preference was very content dependent and in most cases not significantly different, but in two cases the difference were significantly different (SRC 4 and SRC 10) the 2D were preferred.
Figure 4: Comparison of the MOS for the 2D reference and the 3D reference per SRC.
Analyzing the potential causes to this phenomena. The
0% 50% 100% 150% 200% 250% 300% 350% MVC QP32 MVC QP38 Res/4 AVC
QP26 Res/16 AVC QP26 FR/2 AVC QP26 FR/3 AVC QP26
Bitrate gain compared to AVC
differential MOS (DMOS) was analyzed
𝐷𝑀𝑂𝑆 (𝑃𝑉𝑆) = 𝑀𝑂𝑆(𝑃𝑉𝑆) − 𝑀𝑂𝑆 (𝑟𝑒𝑓. 𝑆𝑅𝐶) + 5
Figure 5 shows a scatter plot comparing the 2D and the 3D DMOS for QP38. It can be noted that the video sources which were judged significantly better in 2D for the uncompressed reference (SRC4 and 10) are slightly below the main diagonal, indicating that the perceived degradation was more pronounced for 2D than for 3D coding. This may indicate that at higher compression rates, the difference between 2D and 3D becomes smaller.
Figure 5: 1 Compare 2D and 3D DMOS for H.264 coding at QP38 4. CONCLUSIONS
4.1 2D No-reference video quality model development
To demonstrate the suggested strategy of model development, we present a no-reference model trained and optimized using full-reference model evaluation. The objective of the model is to accurately enough predict the video quality when transmission distortions are introduced. We fit the model using videos from the Consumer Digital Video Library (CDVL) database and the VQM metric. Then the model is validated using the video databases EPFL-PoliMI and LIVE Wireless Video Quality Assessment database with reasonable performance.
4.2 3D Video transmission quality
We discovered that a pre-processing technique using resolution reduction of four may result in higher bitrate efficiency when H.264 video coding is used. The reduction of the frame rate did not save a significant amount of bitrate but it reduced the video quality to a large extent.
5. REFERENCES
[1] ITU-T, "Objective Perceptual Video Quality Measurement Techniques for Digital Cable Television in the Presence of Full Reference", International Telecommunication Union, Telecommunication standardization sector, ITU-T Rec. J.144, (2004)
[2] Sedano, I., Kihl, M., Brunnström, K., and Aurelius, A., "Evaluation of video quality metrics on transmission distortions in H.264 coded video", IEEE International
Symposium on Broadband Multimedia Systems and Broadcasting, (2011)
[3] Wang, Z., Bovik, A. C., Sheikh, H. R., and Simonelli, E. P., "Image quality assessment: From error visibility to structural similarity", IEEE Transactions on Image Processing 13, 600-612 (2004)
[4] Wang, Z., Simonelli, E. P., and Bovik, A. C., "Multi-scale structural similarity for image quality assessment", Proc.
IEEE Asilomar Conference Signals, Systems and Computers,
(2003)
[5] Pinson, M. and Wolf, S., "A New Standardized Method for Objectively Measuring Video Quality", IEEE Transactions
on Broadcasting 50, 312-322 (2004)
[6] Chandler, D. M. and Hemami, S. S., "VSNR: A Wavelet-Based Visual Signal-to-Noise Ratio for Natural Images",
IEEE Transactions on Image Processing 16, 2284-2298
(2007)
[7] Seshadrinathan, K. and Bovik, A. C., "Motion Tuned Spatio-temporal Quality Assessment of Natural Videos", IEEE
Transactions on Image Processing 19, 335-350 (2011)
[8] VQEG, "Final Report From the Video Quality Experts Group on the Validation of Objective Models of Multimedia Quality Assessment, Phase I", Video Quality Experts Group (VQEG), VQEG Final Report of MM Phase I Validation Test, (2008)
[9] de Simone, F. and Ebrahimi, T., EPFL-PoliMI video quality assessment database [on-line], http://vqa.como.polimi.it, Accessed:
[10]Barkowsky, M., Pinson, M., Pépion, R., and Le Callet, P., "Freely Available Subjective Dataset for HDTV including Coding and Transmission Distortion", Proc. 5th Inter.
Workshop on Video Processing and Quality Metrics for Consumer Electronics (2011)
[11]Moorthy, A. K., Seshadrinathan, K., Soundararajan, R., and Bovik, A. C., "Analysis of Wireless Video Quality Assessment: A study of subjective scores and objective algorithms", IEEE transactions on Circuits and Systems for
Video Technology 20, 513-516 (2010)
[12]CVDL, The Consumer Digital Video Library [on-line], http://www.cdvl.org/about/index.php, Accessed:
[13]x264, x264 software [on-line], http://www.videolan.org/developers/x264.html, Accessed: [14]Guo, Y., Li, H., and Wang, Y. K., JVT-Q069 SVC/AVC
loss simulator [on-line], http://wftp3.itu.int/av-arch/jvt-site/2005_10_Nice/, Accessed:
[15]Heynderickx, I. and Kaptein, R., "Perception of detail in 3D images", Proc. of SPIE-IS&T Image quality and system
performance VI, 7242, S. P. Farnand and F. Gaykema Eds.,
(2009)
[16]Barkowsky, M., Wang, K., Cousseau, R., Brunnström, K., Olsson, R., and Le Callet, P., "Subjective Quality Assessment of Error Concealment Strategies for 3DTV in the Presence of Asymmetric Transmission Errors", Proc
IEEE Packet Video Workshop, Hong Kong, China 13-14 Dec, 2010, paper 50 (2010)
[17]Wang, K., Barkowsky, M., Cousseau, R., Brunnström, K., Olsson, R., Le Callet, P., and Sjöström, M., "Subjective evaluation of HDTV stereoscopic videos in IPTV scenarios using absolute category rating", Proc. of SPIE-IS&T
Stereoscopic Displays and Applications XXII (2011)
2 2.5 3 3.5 4 4.5 5 2 2.5 3 3.5 4 4.5 5 DMOS 3D D MO S 2 D SRC Diagonal 5 10 9 4 8 3 1 11 6 2 7