HAL Id: hal-00920598
https://hal.archives-ouvertes.fr/hal-00920598
Submitted on 19 Dec 2013
HAL is a multi-disciplinary open access
archive for the deposit and dissemination of
sci-entific research documents, whether they are
pub-lished or not. The documents may come from
teaching and research institutions in France or
abroad, or from public or private research centers.
L’archive ouverte pluridisciplinaire HAL, est
destinée au dépôt et à la diffusion de documents
scientifiques de niveau recherche, publiés ou non,
émanant des établissements d’enseignement et de
recherche français ou étrangers, des laboratoires
publics ou privés.
Low Complexity RDO Model for Locally Subjective
Quality Enhancement in LAR Coder
Yi Liu, Olivier Déforges, François Pasteau, Khouloud Samrouth
To cite this version:
Yi Liu, Olivier Déforges, François Pasteau, Khouloud Samrouth. Low Complexity RDO Model for
Locally Subjective Quality Enhancement in LAR Coder. IEEE International Conference on Signal
and Image Processing Applications (ICSIPA), Oct 2013, Malaysia. �hal-00920598�
Low Complexity RDO Model for Locally Subjective
Quality Enhancement in LAR Coder
Yi Liu, Olivier Déforges, François Pasteau, Khouloud Samrouth
UMR CNRS 6164 IETR Group Image, INSA de Rennes35708 Rennes France
{yiliu, olivier.deforges, fpasteau, khouloud.samrouth1}@insa-rennes.fr
Abstract—this paper introduces a rate distortion optimization
(RDO) scheme with subjective quality enhancement applied to a still image codec called Locally Adaptive Resolution (LAR). This scheme depends on the study of the relation between compression efficiency and relative parameters, and has a low complexity. Linear models are proposed first to find suitable parameters for RDO. Next, these models are combined with an image segmentation method to improve the local image quality. This scheme not only keeps an effective control in balance between bitrate and distortion, but also improves the spatial structure of images. Experiments are done both in objective and subjective ways. Results show that after this optimization, LAR has an efficient improvement of subjective image quality of decoded images. This improvement is significantly visible and compared with other compression methods using objective and subjective quality metrics.
Index Terms— rate distortion optimization, visual improvement, quadtree, image coding
I.INTRODUCTION
Image compression techniques have been used in various image/video coding systems. To achieve an efficient com-pression performance with a high reconstructed image quality, much effort has been made on different compression algorithms and image coding standards are proposed for multimedia applications. JPEG is commonly used as a still image format. Although its functionalities and compression quality are limited, it provides an acceptable computing complexity for practical use. With a high quality of the recovered image, JPEG2000 [1] [2] gains a lot in PSNR and supports useful functionalities such as progressive transmission by pixel accuracy and resolution, lossless and lossy com-pression, etc. However, the outstanding compression efficiency requires a high computation complexity which impedes its widespread application. JPEGXR shows close results in Mean Square Error (MSE) to JPEG2000 [3] and has a lower complexity. The improvement to JPEGXR is still in progress [4].
In addition to standards, LAR offers a coding framework providing a number of functionalities such as lossy/lossless compression, resolution and quality scalability and Region of Interest coding [5]. The complexity of LAR is similar to that of JPEG XR and can keep low at high compression ratios. LAR adopts a multi-layer pyramidal structure to adapt to constraints such as variable bitrates and multi-resolution [6]. The drawback is that the encoding process has to set different parameters in the multi-layer structure. Therefore, a suitable
method for the optimal coding configuration is required for LAR.
This paper first describes a parametric model derived from the analysis of the compression efficiency of LAR. Based on the model, a rate distortion optimization (RDO) technique for LAR can be applied to select the parameters and achieve an optimal or near-optimal configuration to reduce the objective distortion of decoded images. Furthermore, in view of the fact that, although objective distortion measurements, such as mean square error (MSE) and peak signal-to-noise ratio (PSNR), can show the difference extent between reference and distorted image, they are not very well matched to the perceived visual quality [7] [8]. The changes in structure information are considered as important image degradations in subjective quality [9]. As a result, in this paper, a seg-mentation method using a quadtree structure is combined with the proposed RDO model to enhance the partial image quality. The improvement is visible by comparison and evaluated by the subjective oriented quality metric: MSSIM [9].
The remainder of this paper is organized as follows. Section II gives a general introduction to the LAR codec framework. Section III presents key parameters and the rate-distortion optimization model based on compression efficiency. Section IV introduces the segmentation method and local quality enhancement. Experimental results are shown in section V. Conclusions are provided in section VI.
II.COLOR LAR CODER FRAMEWORK
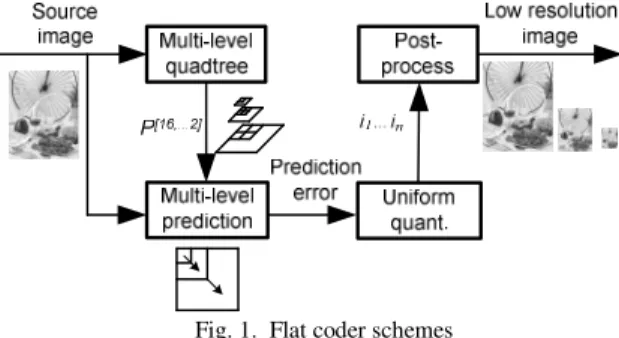
Locally Adaptive Resolution (LAR) is an efficient content-based 2D image coder for both lossless and lossy image compressions. It supports two coding layers: a Flat coder for global image information and a Texture coder for detail information. The Flat coding scheme is given in Fig. 1.
Fig. 1. Flat coder schemes
It starts at a pyramidal partition of the original image, followed by pixel value predictions in the use of the Wu
pre-diction algorithm [10]. The prepre-diction error is then sent to be quantized. A simple bi-linear filter is used to smooth block effects for the post-process at low bitrates. The texture coder is used to complete the scalability function in quality. However, this structure increases codec complexity and bit-resource required. In this paper, only the flat coder is under study. Two parameters: the threshold for the quadtree de-composition and quqp for the quantization of prediction errors, are studied for their effects on compression efficiency. Based on the global feature shown by threshold and quqp, the method of optimal configuration to parameters is presented in section III. With this method, the complexity of LAR is directly dependent on the number of blocks, and it is approximately linear with the bitrate. At low bitrates, the threshold selected by this method remains large and blocks produced by quadtree become less than in high bitrates. This action decreases a lot of coding processes and time consumed at high compression ratios.
III.RATE DISTORTION OPTIMIZATION MODEL
This section introduces an optimization method in para-meters based on the performance of LAR codec. Key parameters are presented first, then a useful distribution of parameters are given and correlative factors are considered together to build models to keep a high coding quality for LAR.
A. Quadtree Partitioning
In the LAR codec, the quadtree structure is constructed by the bottom-up method and begins with the smallest block size (2×2). If all relevant sub-blocks can be seen as a larger block, then a decision is made whether to combine the larger blocks into a yet larger block. The decision is determined by the difference between the maximum and minimum luminance values in the block and a threshold set before coding. If the difference is less than the threshold, this block is judged as a leaf for upper level partitioning, or it stays as four separated sub-blocks. For color images with three components Y:Cr:Cb, a single threshold mainly supplied from the Y component is chosen.
B. Quantization Process
While processing pyramidal levels for different resolutions, prediction errors are uniformly quantized by a quantization factor Q which is controlled by the quantization parameter
quqp.
QLi =quqp F⋅ Li, for level Li. (1) As predictions are based on intra and inter-level data, quantization performed at a given level will impact all the following ones. Therefore, the FLi factors reflect the
distribution of the quantization (distortion) among the pyramid levels. The relationship between two levels is about
FLi = (FLi-1)/2, with i ≥ 0 and i = 0 set for full resolution.
C. Proposed RDO Model
As a multi-layer image coder, LAR has many parameters to be modified if an optimal performance is to be achieved. It is
possible to repeat some key processes to find suitable choices. However, the high time-consumption makes them impractical. To search an effective and low-complex method, global features on compression efficiency of LAR are presented here and relative factors are studied to build a model for RDO.
2 4 6 8 10 12 14 0 50 100 150 200 250 300
Rate (bits per pixel)
M S E Distortion curve Optimal compression 0 50 100 150 200 250 0 20 40 60 80 100 quqp T h re s h o ld Optimal combination Region I Region II quqp = 53
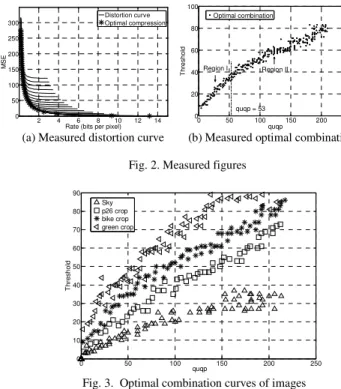
(a) Measured distortion curve (b) Measured optimal combination Fig. 2. Measured figures
0 50 100 150 200 250 0 10 20 30 40 50 60 70 80 90 quqp T h re sh o ld Sky p26 crop bike crop green crop
Fig. 3. Optimal combination curves of images
An example of the compression distortion is shown in Fig. 2 (a). In each distortion curve, the threshold is fixed and quqp increases. So each curve reflects the distortion trend caused by quantization at a specific threshold. If only the objective distortion is considered, the optimal compression performance should be as low as possible in both bitrate and mean square error (MSE). For these optimal dots, there are corresponding combinations of threshold and quqp. These combinations are drawn in Fig. 2 (b). It can be seen that the combinations are not in a mass, but locate in a curve which has an inflexion approximately in quqp = 53. So this curve is divided into two regions as shown in Fig.2 (b). To describe the curve trend clearly, linear models are used for each region and correlative factors are presented as follows.
Fig. 3 shows optimal combination curves of four different images as examples. The four images have different texture complexity from low to high. Image Sky has a simple texture structure with the single background, while image green crop has plenty of the detailed information. Fig. 3 shows that the distribution of optimal combinations is relevant with the complexity of the image: the suitable threshold is greater at a specific quqp for an image with more detail information. To express this trait, entropy of the gradient, HG is introduced.
(
)
(
)
2 2 2 ( ) log ( ) , max ( ( , )) min ( ( , )) G i i i H p g p g where g I b x y I b x y = − ⋅ = −
∑
(2)An image is separated into 2×2 blocks. The difference between the maximum and minimum luminance values in each block is named the gradient in this block HG. HG is
calculated as in (2). p(g) is the probability of gradient.
HG reflects the extent of partial pixel variety and offers the
information of optimal combination curves as shown in Table I. They generally correspond to the curves in Fig. 3.
TABLEI ENTROPIES OF THE GRADIENT
Sky p26 crop bike crop green crop HG 2.335 4.495 5.498 5.892
Another factor r(g) is introduced here to study the global complexity of an image. It is a summation of probabilities of gradient p(g), as given in (3). 0 20 40 60 80 100 120 140 160 0.4 0.5 0.6 0.7 0.8 0.9 1 Gradient r( i) Sky p26 crop bike crop green crop
Fig. 4. r(g) curves of images
0 ( )
( )
g i rg
p i = =∑
(3) In an image which has large parts of the same color or moderate transitions, most gradients are in small values. Ther(g) curve locates higher and reaches 1 more quickly as shown in Fig.4. To reflect the speed of this trend, the difference between r(45) and r(7) is used to evaluate the slope of a curve. The indexes g for r(g) in (4) are tested on training images and the values are selected to reflect the trend more accurately.
∆ =
r
( )
45−
r
(7)
(4) With the help of HG and r(g), two linear models are used tosimulate the boundaries of the belt in each region as shown in Fig. 5 (a). The models are expressed in (5).
(
)
(
)
(
)
(
)
1 2 1 2 53 10 53 53 10 53 , 53 , 53 G G G G H Thr quqp f quqp H Thr quqp H Thr quqp if quqp H Thr quqp i β α β α β α β α + = + ∆ ⋅ = + ∆ ⋅ + = + ∆ ⋅ ⋅ = + ∆ ⋅ ⋅ ≥ <
(5)Thr1 is the result of model 1 and Thr2 is model 2. α and β
are the model parameters that are obtained by learning at an image database which includes cropped images from ISO
12640 and images authorized for testing on the internet. During the learning, α and β are optimized by curve fitting in the least square deviation and α = 17.93 and β = 121.07 are selected under the consideration of the overall performance of the training images. In practical use, threshold can be the average of model 1 and 2. Fig. 5 (b) gives one example result of this choice. It shows that the performance is exactly or close to the optimal result.
0 50 100 150 200 250 0 20 40 60 80 100 quqp T h re s h o ld Optimal pair model 1 model 2 0 5 10 15 0 50 100 150 200 250 300 350
Rate (bits per pixel)
M
S
E
Distortion curve Proposed method
(a) Simulated optimal combination (b) Simulated distortion curve Fig. 5. Simulated figures
IV.LOCALLY ADAPTIVE THRESHOLD SCHEME
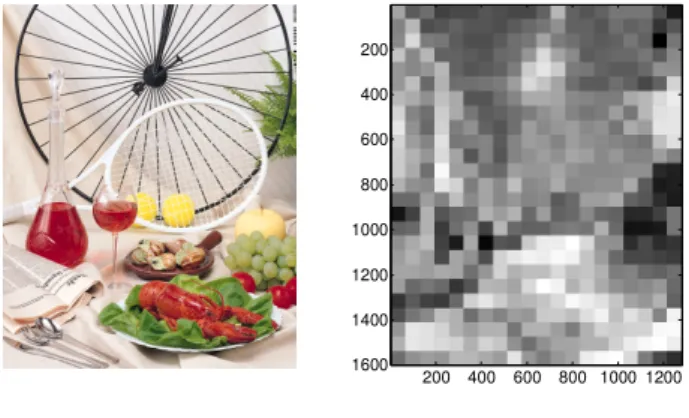
The models proposed in section 3 can help the LAR codec reach a low distortion at a specific bitrate. However, they are only derived from objective measurement and may cause visible discomfort. As the quantization parameter increases, the suitable threshold also rises and makes the blocks larger in the quadtree. This action obscures the contour of objects and loses texture information even in parts with a low variety of pixels. To solve this problem, an image is treated as a combination of many local regions instead of a whole one. RDO models are applied to each region to find a suitable threshold for quadtree by a given quantization parameter. In this paper, the region is set to be a 64×64 block and the quantization parameter of each region is equal to quqp.
200 400 600 800 1000 1200 200 400 600 800 1000 1200 1400 1600
(a) bike_crop (b) Thresholds of regions Fig. 6. Distribution of local threshold
Fig. 6 shows an example of distribution of the thresholds in different regions. Fig. 6. (a) presents the original image for comparison, and Fig. 6. (b) presents the thresholds with gray levels. A block with a greater luminance represents a higher threshold and vice versa. It can be seen that in parts with less contours, the threshold has a small value and can keep more texture information. In complex parts, the threshold rises. Although a higher distortion is caused in these parts, human eyes are less sensitive to noise in strong texture areas than in
weak texture areas [11] [12]. Thus, this scheme offers a more comfortable bit allocation way in consideration of human visual system.
V.EXPERIMENTAL RESULTS
The experimental results are shown in two parts. First, the performance of RDO models introduced in section III is checked. Second, subjective improvement based on the locally adaptive threshold scheme is presented.
A. Results of RDO Models
Four images, “p06” (4064×2704), “TOOLS” (1524×1200), “leaves” (3008×2000), and “Rokuonji” (3288×2458), which are not included in the training set are presented as examples to evaluate the performance.
0 1 2 3 4 0 50 100 150 200
Rate (Bits per pixel)
M S E Optimal curve Proposed models 0.5 0.6 0.7 0.8 0.9 1 1.1 25 30 35 40 45 50 55 60
Rate (Bits per pixel)
M
S
E
Optimal curve Proposed models
(a) Overall performance to p06 (b) Partial performance to p06
0 2 4 6 8 10 0 100 200 300 400 500
Rate (Bits per pixel)
M S E Optimal curve Proposed models 1.2 1.4 1.6 1.8 2 120 130 140 150 160 170
Rate (Bits per pixel)
M
S
E
Optimal curve Proposed models
(c) Overall performance to TOOLS (d) Partial performance to TOOLS
0 2 4 6 8 0 20 40 60 80 100 120
Rate (bits per pixel)
M S E Optimal curve Proposed models 0.5 1 1.5 2 15 20 25 30 35 40
Rate (bits per pixel)
M
S
E
Optimal curve Proposed models
(e) Overall performance to leaves (f) Partial performance to leaves
0 1 2 3 4 5 6 0 10 20 30 40 50
Rate (Bites per pixel)
M S E Optimal curve Proposed Method 0.5 1 1.5 12 14 16 18 20 22 24
Rate (Bites per pixel)
M
S
E
Optimal curve Proposed Method
(g) Overall performance to Rokuonji (h) Partial performance to Rokuonji Fig. 7. Comparison with RDO models efficiency and optimal results
Fig. 7. shows the compression efficiency of the RDO models on the four images. Optimal curves are the best results under a full searching with possible combinations of quqp and
threshold. The compression results are very close to the optimal curves.
B. Results of Locally Adaptive Threshold Scheme
Images “bike” and “p06” are used as two examples to present the visible difference in region images from decoded images with the same compression ratio in Fig. 9 and 10. By using locally adaptive thresholds, decoded images exhibit a visible enhancement in texture part with the reference of original images shown in Fig. 8.
(a) bike (b) p06 Fig. 8. Partial regions of original images
(a) without adaptive scheme (b) with adaptive scheme
Fig. 9. Encoded bike image at 0.50 bpp
(a) without adaptive scheme (b) with adaptive scheme Fig. 10. Encoded p06 image at 0.50 bpp
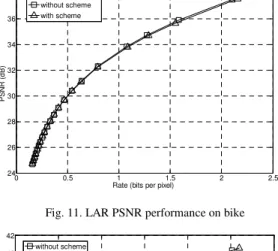
Fig. 11 and 12 present PSNR results on “bike” and “p06” image, considering the classical LAR with RDO models only and the LAR with locally adaptive threshold scheme.
Although the evident proof of visual quality improvement, the two curves are very close.
0 0.5 1 1.5 2 2.5 24 26 28 30 32 34 36 38
Rate (bits per pixel)
P S N R ( d B ) without scheme with scheme
Fig. 11. LAR PSNR performance on bike
0 0.5 1 1.5 2 2.5 3 22 24 26 28 30 32 34 36 38 40 42
Rate (Bits per pixel)
P S N R ( d B ) without scheme with scheme
Fig. 12. LAR PSNR performance on p06
Fig. 13, 14, 15 and 16 present comparison in subjective quality by Mean Structural SIMilarity (MSSIM). The test code is provided by [13]. Because most MSSIM values are located between 0.9 and 1, for illustrating them clearly, MSSIM values are presented in logarithmic domain as used in [4].
(
)
10 ( ) 20 log 1 MSSIM dB = − ⋅ −MSSIM (6) It can be seen that with the proposed scheme, LAR MSSIM score is higher especially on image p06. It also shows in this context the efficiency of the MSSIM metric compared to the PSNR one. 0 0.5 1 1.5 2 2.5 20 25 30 35 40 45 50 55 60 65Rate (bits per pixel)
M S S IM ( d B )
LAR with scheme LAR without scheme
Fig. 13. MSSIM (dB) performances on bike
0 0.2 0.4 0.6 0.8 1 1.2 1.4 1.6 1.8 2 20 25 30 35 40 45 50 55 60 65
Rate (bits per pixel)
M S S IM ( d B )
LAR with scheme LAR without scheme
Fig. 14. MSSIM (dB) performances on p06
0 0.5 1 1.5 2 2.5 3 25 30 35 40 45 50 55 60 65 70 75
Rate (Bits per pixel)
M S S IM ( d B )
LAR with scheme LAR without scheme
Fig. 15. MSSIM (dB) performances on leaves
0 1 2 3 4 5 6 20 25 30 35 40 45 50 55 60
Rate (Bits per pixel)
M M S IM ( d B )
LAR with scheme LAR without scheme
Fig. 16. MSSIM (dB) performances on TOOLS
Next, PSNR performances are compared between LAR (with scheme), JPEG, JPEGXR and JPEG2000. The compression results are provided by the JPEG Online Test Facility [14]. As shown in Fig. 17 and 18, LAR results in PSNR are lower than those of JPEG 2000, but stay close at low bitrates. JPEG2000 is considered to be the best JPEG standard in PSNR. However it has a higher complexity than JPEGXR. LAR is roughly same as JPEGXR in terms of complexity and shows flexibility such as multi-resolution coding. Indeed for LAR, as the complexity will be directly dependent on the number of blocks in the quadtree, its complexity is approximately linear with the bitrate.
0 0.5 1 1.5 2 2.5 3 22 24 26 28 30 32 34 36 38 40
Rate (bits per pixel)
P S N R ( d B ) LAR JPEG JPEG XR JPEG 2000
Fig. 17. PSNR performance on bike
0 0.5 1 1.5 2 2.5 3 22 24 26 28 30 32 34 36 38 40 42
Rate (bits per pixel)
P S N R ( d B ) LAR JPEG JPEG XR JPEG 2000 Fig. 18. PSNR performance on p06
Performances for lossless coding are also compared and results, including JPEG LS standard, are shown in Table II. It can be seen that LAR exhibits better results in lossless coding compared with JPEG XR and JPEG LS, and is close to JPEG 2000 performances.
TABLEII
BITRATE (BPP) FOR LOSSLESS CODING
bike.ppm p06.ppm JPEG 2000 12.02792 10.28096 JPEG XR 12.71170 11.75943 JPEG LS 13.42404 11.58512 LAR 12.46070 10.58485 (a)JPEG (b) JPEG XR (c) JPEG 2000 (d) LAR Fig. 19. p06 encoded at 0.25 bpp with different methods
Finally, some decoded images at low bitrates considering the JPEG standards and LAR are presented in Fig. 19. It can be observed that LAR performances are between JPEG 2000 and JPEG XR ones.
VI.CONCLUSION
In this paper, a locally adaptive scheme based on a RDO model is presented. This RDO model is first derived from global compression features of LAR coder, and enables an automatic efficient parameterization from the only quantization parameter. Then, this model is applied to local image regions to modify texture information human eyes are concern. Although objective quality is not improved from the experimental results, the subjective quality is enhanced visibly and shown by MSSIM measurement. Comparative results show that the proposed method is very efficient from low bitrates to lossless coding. Next works will focus on the prediction part of LAR for further improvements.
REFERENCES
[1] A.Skodras, C. Christopoulos, and T. Ebrahimi, “The JPEG 2000 still image compression standard,”IEEE Signal Process., vol. 18, no. 5, pp. 36-58, Sep. 2001.
[2] David S. Taubman, Michael W. Marcellin, JPEG2000 Image
Compression Fundamentals, Standard and Practice, Kluwer Academic Publishers, p. 402, 2002.
[3] T. Richer and C. Larabi: “Subjective and Objective Assesment of Visual Image Quality Metrics and Still Image Codecs”, Proc. of the
DCC, p. 541, Mar. 2008.
[4] T. Richter. “Visual quality improvement techniques of HDPhoto / JPEG-XR”, IEEE ICIP, pp. 2888 – 2891, Oct. 2008.
[5] O. Deforges, M. Babel, L. Bedat and J. Ronsin, “Color LAR Codec: a color image representation and compression scheme based on local resolution adjustment and self-extracting region representation,” IEEE
Trans. on Circuits and Systems for Video Technol., vol 17, pp. 974-987, Aug. 2007.
[6] M. Babel and O. Deforges, “Lossless and Lossy Minimal Redundancy Pyramidal Decomposition for Scalable Image Compression Technique,” IEEE ICME, vol. 3, pp. 161-164, July, 2003.
[7] Z. Wang and A. C. Bovik, “A universal image quality index,” IEEE
Signal Processing Letters., vol. 9, pp. 81-84, Mar. 2002.
[8] Z. Wang, A. C. Bovik, and L. Lu, “Why is image quality assessment so difficult,” in Proc. IEEE Int. ICASSP, vol. 4, pp 3313-3316, Orlando, FL, May 2002.
[9] Z. Wang, A. C. Bovik, H. R. Sheikh and E. P. Simoncelli, “Image Quality Assessment: From Error Visibility to Structural Similarity,”
IEEE Trans. on Image Processing, vol 13, no. 4, Apr. 2004.
[10] X. Wu and N. Memon, “Context-based, adaptive, lossless image coding,” IEEE Trans. on Comm., vol. 45, no. 4, pp. 437-444, Apr. 1997. [11] Z. W. Kang, J. Liu and Y. G. He, “Steganography based on wavelet
transform and modulus function,” ELSEVIER Journal of Systems
Engineering and Electronics, vol. 18, no. 3, pp. 628-632, 2007. [12] Soroosh Rezazadeh and Mehran Yazdi, “A Non-oblivious Image
Watermarking System Based on Singular Value Decomposition and Texture Segmentation,” International Journal of Applied Science,
Engineering and Technology, vol. 1, no. 3, Jun. 2009.
[13] Z. Wang, A. C. Bovik, H. R. Sheikh and E. P. Simoncelli, (2012) University of Waterloo webpage on SSIM Index. [Online]. Available: https://ece.uwaterloo.ca/~z70wang/research/ssim/
[14] (2012) University of Stuttgart IZUS webpage on JPEG Test Facility. [Online]. Available: http://jpegonline.rus.uni-stuttgart.de/index.py