HAL Id: hal-02661640
https://hal.inrae.fr/hal-02661640
Submitted on 30 May 2020
HAL is a multi-disciplinary open access
archive for the deposit and dissemination of
sci-entific research documents, whether they are
pub-lished or not. The documents may come from
teaching and research institutions in France or
abroad, or from public or private research centers.
L’archive ouverte pluridisciplinaire HAL, est
destinée au dépôt et à la diffusion de documents
scientifiques de niveau recherche, publiés ou non,
émanant des établissements d’enseignement et de
recherche français ou étrangers, des laboratoires
publics ou privés.
expression profiles
Daniel Baron, Jérôme Monfort, Rémi Houlgatte, Alexis Fostier, Yann Guiguen
To cite this version:
Daniel Baron, Jérôme Monfort, Rémi Houlgatte, Alexis Fostier, Yann Guiguen. Androgen-induced
masculinization in rainbow trout results in a marked dysregulation of early gonadal gene expression
profiles. BMC Genomics, BioMed Central, 2007, 8 (357), pp.1-8. �10.1186/1471-2164-8-357�.
�hal-02661640�
Open Access
Research article
Androgen-induced masculinization in rainbow trout results in a
marked dysregulation of early gonadal gene expression profiles
Daniel Baron
1,2, Jérôme Montfort
1, Rémi Houlgatte
2, Alexis Fostier
1and
Yann Guiguen*
1Address: 1INRA, UR1037 SCRIBE, IFR140, Ouest-Genopole, F-35000 Rennes, France and 2Institut National de la Santé et de la Recherche Médicale,
L'institut du thorax, INSERM U533, Faculté de Médecine, 1 rue Gaston Veil, BP 53508, 44035 Nantes cedex 1, France Email: Daniel Baron - daniel.baron@nantes.inserm.fr; Jérôme Montfort - jmontfort@rennes.inra.fr;
Rémi Houlgatte - remi.houlgatte@nantes.inserm.fr; Alexis Fostier - alexis.fostier@rennes.inra.fr; Yann Guiguen* - yann.guiguen@rennes.inra.fr * Corresponding author
Abstract
Background: Fish gonadal sex differentiation is affected by sex steroids treatments providing an efficient strategy to control the sexual phenotype of fish for aquaculture purposes. However, the biological effects of such treatments are poorly understood. The aim of this study was to identify the main effects of an androgen masculinizing treatment (11β-hydroxyandrostenedione, 11βOH∆4, 10 mg/kg of food for 3 months) on gonadal gene expression profiles of an all-female genetic population of trout. To characterize the most important molecular features of this process, we used a large scale gene expression profiling approach using rainbow trout DNA microarrays combined with a detailed gene ontology (GO) analysis.
Results: 2,474 genes were characterized as up-regulated or down-regulated in trout female gonads masculinized by androgen in comparison with control male or female gonads from untreated all-male and all-female genetic populations. These genes were classified in 13 k-means clusters of temporally correlated expression profiles. Gene ontology (GO) data mining revealed that androgen treatment triggers a marked down-regulation of genes potentially involved in early oogenesis processes (GO 'mitotic cell cycle', 'nucleolus'), an up-regulation of the translation machinery (GO 'ribosome') along with a down-regulation of proteolysis (GO 'proteolysis', 'peptidase' and 'metallopeptidase activity'). Genes considered as muscle fibres markers (GO 'muscle contraction') and genes annotated as structural constituents of the extracellular matrix (GO 'extracellular matrix') or related to meiosis (GO 'chromosome' and 'meiosis') were found significantly enriched in the two clusters of genes specifically up-regulated in androgen-treated female gonads. GO annotations 'Sex differentiation' and 'steroid biosynthesis' were enriched in a cluster of genes with high expression levels only in control males. Interestingly none of these genes were stimulated by the masculinizing androgen treatment.
Conclusion: This study provides evidence that androgen masculinization results in a marked dysregulation of early gene expression profiles when compared to natural testicular or ovarian differentiation. Based on these results we suggest that, in our experimental conditions, androgen masculinization proceeds mainly through an early inhibition of female development.
Published: 4 October 2007
BMC Genomics 2007, 8:357 doi:10.1186/1471-2164-8-357
Received: 4 April 2007 Accepted: 4 October 2007
This article is available from: http://www.biomedcentral.com/1471-2164/8/357 © 2007 Baron et al; licensee BioMed Central Ltd.
This is an Open Access article distributed under the terms of the Creative Commons Attribution License (http://creativecommons.org/licenses/by/2.0), which permits unrestricted use, distribution, and reproduction in any medium, provided the original work is properly cited.
Background
The embryonic gonad has the potential to develop into a fully functional organ able to produce the gametes neces-sary for sexual reproduction. Sex differentiation is a cru-cial step in this developmental process and is considered as the differentiation from a bipotential gonadal primor-dium towards a testis or an ovary. In teleostean fish, sex differentiation can be controlled by in vivo treatments with sex steroids (reviewed in [1]) as in reptiles and amphibians and to some extent in birds (reviewed in [2-4]). In fish, these steroid treatments are often able to induce fully functional sex-inversed phenotypes and these treatments have been widely used to produce all-male or all-female populations of fish for aquaculture purposes [5]. Many studies have been focused on the role of these hormones during gonadal sex differentiation highlighting for instance the crucial role of estrogens in ovarian differ-entiation [1]. However, most of the studies performed thus far were focused on a very small number of well char-acterized genes, proteins or hormones and mostly on nat-ural gonadal differentiation.
Rainbow trout, Oncorhynchus mykiss, has a male heteroga-metic XY genetic system and we experimentally produced XX and YY males allowing the production of genetically all-male and all-female populations [6]. These all-male or all-female populations provide a unique opportunity to work on numerous animals for which the normal gonadal development as testis or ovary is known a priori. Using the extensive collection of expressed sequenced tags (ESTs) obtained through sequencing projects in trout as a resource [7,8], we designed and built a DNA microarray in order to characterize, on a genome-wide scale, the mech-anisms by which 11β-hydroxyandrostenedione (11βOH∆4), a natural androgen in fish [9,10] is able to masculinize the embryonic ovary.
Using this genome-wide approach we characterized 2,474 genes (2372 microarray and 102 real-time RT-PCR gene expression profiles) with a clear differential temporal expression profile in females masculinized by androgen. We classified these genes in 13 different clusters of corre-lated temporal expression profiles, and searched within these clusters for significant enrichment in Gene Ontol-ogy (GO) terms. This strategy allowed us to define a few very clear biological trends potentially explaining how androgen induces masculinization of female fish. Our results clearly demonstrate that masculinization with androgen proceeds through a marked dysregulation of gene expression profiles, including a quick down-regula-tion of the ovarian pathway. Surprisingly, most of the genes over-expressed during natural testicular differentia-tion were not restored by the androgen-induced masculi-nization suggesting that the inhibition of female gonadal
development is the main required step sufficient for building a testis.
Results
The complete dataset is available through the National Center for Biotechnology Information (NCBI), in the Gene Expression Omnibus database [11] under the GSE7018 accession number. After statistical filtering, 2,474 expression profiles (2372 microarray and 102 real-time RT-PCR gene expression profiles, data available as supplemental material in Additional file 1) were identi-fied as being characteristic for either natural differentia-tion (ovarian or testicular differentiadifferentia-tion) or androgen-induced masculinization (trans-differentiating gonads). Among these 2,474 expression profiles, 73% (1,805) were associated with genes with significant homologies with well characterized proteins in Swissprot or Prodom data-bases (the complete list of clones and their annotations is available as supplemental material in Additional file 2).
Biological sample clustering and histology
This analysis was carried out on fish sampled at several stages of development from the onset of the free swim-ming period (Day 0 = D0), when fish first started to be fed with the androgen treatment until 110 days after the beginning of the treatment (D110). Unsupervised hierar-chical clustering of samples (Fig 1A) reveals 3 main groups of correlated samples according to their global gene expression profiles i.e., late ovarian samples (D60 to D110, correlation coefficient R = 0.78), middle and late gonad samples of androgen-treated fish gonads (D27 to D110, R = 0.37) and middle and late testicular samples (D27 to D110, R = 0.26). All early samples (D0 to D12) cluster together with a weak correlation (R = 0.07), indi-cating that differences in the expression profiles of these early samples are rather large. Histological analysis of gonads at D12 (Fig. 1B, panels a, c, e) reveals characteristic features of differentiating gonads in control fish with the first appearance of ovarian meiosis and lamellar structures in females, or spermatogonia cysts in males. At this time-point (D12), gonads of androgen-treated females appear as a thin structure characterized by scattered germ cells in a predominant stroma of conjunctive tissue with fibrob-last like cells. After 90 days of treatment (Fig. 1B, panels b, d, f) the gonads of androgen-treated females display a classical testicular organization with cysts of germ cells engaged at various stages of meioses whereas the control male gonads show the same organization but with only gonial mitosis. At D90, the control female gonads contain previtellogenic oocytes surrounded by flattened granulosa cells and oogonia within clearly organized ovarian lamel-lae.
Global analysis of gene expression profiles
The 2,474 expression profiles were analyzed using a k-means clustering (with k = 13) in order to individualize clusters of genes with similar expression profiles (Fig. 2). These expression profiles and the 13 k-means clusters are available online as a browseable file [12]. Among these clusters, clusters 1 to 4 are characterized by a specific high expression levels of a very large number of genes (N = 1,204) specific to the late ovarian samples (D60 to D110). These clusters could have been merged as their expression profiles seem very similar. In cluster 5 (N = 184) these high expression levels in the female group after D60 are also present in the androgen-treated group after D27. Cluster 6 (N = 89) contains genes with increasing
expres-sion profiles starting from D16 in androgen-treated females and from D27 in control males. Clusters 7 (N = 132) and 8 (N = 77) are characterized by an early (starting from D27, cluster 7) or late (starting from D90, cluster 8) increase in gene expression specific to the androgen-treated females. Genes in cluster 9 (N = 214) display a late down-regulation starting from D60 in control female gonads. Cluster 10 (N = 133) is the only cluster that does not show any difference between males, females and androgen-treated females and contains genes with contin-uously decreasing expression levels from D0 to D110. Cluster 11 (N = 172) contains genes down-regulated both in females (from D60) and androgen-treated females (from D27). Cluster 12 (N = 214) is characterized by gene
Classification of gonad samples and histological analysis of some characteristic gonadal stages
Figure 1
Classification of gonad samples and histological analysis of some characteristic gonadal stages. (A) Dendrogram of the samples ranked using a hierarchical clustering. Gonad samples are colorized according to the sex i.e., red for females, blue for males and black for androgen-treated females. Correlation coefficients (R) of the last branches of a cluster are given. (B) Histology of the gonads from the female control group (a, b), the androgen-treated group (c, d), and the male control group (e, f) at 12 days (D12) and 90 days (D90) after the beginning of the androgen treatment. BV: blood vessel; FC: fibroblast like cell; Go (A1/A2/B): gonia type (A1/A2/B); I: Interstitial space; M: mitosis; Me: meiosis; N: nucleus; n: nucleolus; OV: ovo-cyte; P: pachytene stage of meiosis; (p)G: (pre)granulosa cell ; (p)S: (pre)sertoli cell ; Spc(I/II): spermatocyte I/II; Spt: spermatid; Str: ovarian stroma.
a
OV N Me OG Pb
Ser M GoA1 GoB GoA2 I •• • •• • • • •• •• • • • • • • • • • • • • • • • •• • • • BV GoA1 I GoA1 •• • • •• • • • • • • • • • • • • ••c
d
e
f
Str Str BV SpcI Me SpcII Me Me PP Spt • • • • BV N OV n GoB GoB G Str FC pSer GoB •• • • •• •• • • ••• • • • • • • • • • • • • • • • • •• • • • • pG pG GoA1 pSer GoB I GoA2 Fem a le Fem a le AndrogenAndrogen tre a te d tre a te d fe m a le fe m a le Ma le Ma le D12 D12 D90D90 D110 D90 D27 R= 0.26 D60 D27 D0 D7 D27 D90 D110 D60 * D60 D90 D110 R= 0.05 R= 0.78 R= 0.37 R= 0.07 D0 D12 D7 D7 D12 D27 D12 D7 D12 D7 D12 D12A
B
R= -0.04 50µm 50µm 50µm 50µm 50µm 50µmexpression levels specifically down-regulated (from D27) in androgen-treated females. However, this down-regula-tion is not maintained after the end of the treatment (i.e. after D90). Cluster 13 is the smallest cluster in terms of the number of genes (N = 55) and it displays high expres-sion levels specifically in males throughout all the sam-pling times (from D0 to D110). Expression levels in androgen-treated females slightly increase after comple-tion of the treatment (> D90).
Annotation of gene clusters using Gene Ontology (GO)
We then searched for Gene ontology (GO) terms signifi-cantly enriched in these groups of correlated expression profiles compared to the overall GO terms found. Among the 1,805 genes with an annotation we selected 1,276 unique genes annotated with an official name, and 1,133 were found to be associated with at least one GO category.
The top 5 significantly enriched GO terms for each of the clusters are described in Table 1 and 2 and the complete analysis is available online (as supplemental material in Additional file 3).
As gene expression in clusters 1 to 5 displayed similar expression profiles in the control female group, these clus-ters have been analysed both all together and separately (Table 1). If considered as a homogenous cluster it dis-plays considerable enrichments in GO terms likely to be important characteristics of these late ovarian stages. Among these GO terms the most representatives (see Table 1 and Additional file 3) are the 'regulation of pro-gression through cell cycle' (GO ID 74) [including 'mitotic cycle' (ID 278)], the 'macromolecule biosynthe-sis' (ID 9059) [including 'protein biosynthebiosynthe-sis' (ID 6412)] and the cellular component ontology 'nucleolus' (ID
Gene expression profiles following androgen treatment in female rainbow trout
Figure 2
Gene expression profiles following androgen treatment in female rainbow trout. (A) Heat map of the 2,474 differ-entially expressed genes in rainbow trout gonads following androgen treatment. The 40 biological samples are ordered accord-ing to the experimental groups (red for females; blue for males; black for androgen-treated females) and to the developmental stage (D0 to D110 from left to right). (B) Relative median gene profile of the 13 clusters of temporally correlated gene expres-sion profiles. -120 -80 -40 0 40 80 120 3 -120 -80 -40 0 40 80 120 4 -120 -80 -40 0 40 80 120 1 -120 -80 -40 0 40 80 120 9 -120 -80 -40 0 40 80 120 2 -120 -80 -40 0 40 80 120 5 -120 -80 -40 0 40 80 120 6 -120 -80 -40 0 40 80 120 7 -120 -80 -40 0 40 80 120 8 -120 -80 -40 0 40 80 120 13 -120 -80 -40 0 40 80 120 12 -120 -80 -40 0 40 80 120 11 -120 -80 -40 0 40 80 120 10 Females F-11β Males 1 2 3 4 5 6 7 8 9 10 11 12 13 : Females : Males : F-11ββββ 1 0 -1 Relati ve Med ia n Ex press ion Re la ti ve M ed ia n Ex press ion Relati ve Med ia n Ex press ion Re la ti ve M ed ia n Ex press ion Relati ve Med ia n Ex press ion
A
B
5730, see figure 3 for a detailed composition of this GO term). GO term 'mitosis' (ID 7067) is highly over-repre-sented in cluster 3 (see Table 1 and figure 4 for a detailed composition of this GO term) with a 2.1 fold relative enrichment (p value of 4.10-3). Among clusters 1 to 5, only genes from cluster 5 are also highly expressed in the androgen-treated group. The main GO theme of cluster 5 is related to translation, with over-representation of GO 'ribosome' (ID 5840, see figure 5 for a detailed composi-tion of this GO term), 'ribonucleoprotein complex' (ID 30529), and 'ribosome biogenesis and assembly' (ID 42254). Within the GO term 'ribosome', a large propor-tion of genes (7 out of 13) up-regulated in cluster 5 are also annotated as 'cytosolic large ribosomal subunit' (ID 5842, e.g. rpl5, rpl7, rpl13a, rpl17, rpl19 and rpl21, see Fig. 5). Cluster 6 contains genes that are up-regulated both in control males and androgen-treated females. It con-tains genes (Table 2) involved in 'cell surface' (ID 9986), 'T cell activation' (ID 42110) and the 'immune response'
(ID 6955). Clusters 7 and 8 are of particular interest as they display an up-regulation only in androgen-treated females. Cluster 7 is characterized by the GO terms 'extra-cellular matrix' (ID 5578), 'actin binding' and 'muscle contraction' (ID 3779 and ID 6936) including genes like myosins (e.g. myl6 and myl11), tropomyosins (e.g. tpm1, tpm3 and tpm4) and some muscle markers (e.g. calponin2, cnn2 and transgelin, tagln). The GO term 'extracellular matrix' (Fig. 6) contains 30 different genes, and 10 are specifically up-regulated in cluster 7 following androgen treatment in females (4.6 fold enrichment with a p value < 4.10-4). Many of these genes (e.g. col1a1, col1a2, col6a2, and mfap2), are 'structural constituents of the extracellular matrix' (ID 5201), or are involved in 'cell adhesion' (ID 7155) (e.g. col6a2, sparc and postn). The expression profiles of some of these genes related to the extracellular matrix are shown in figure 7 along with the tgfb1 expression profile that also shows a slight up-regu-lation from D60 to D110 following androgen treatment
Table 1: The top 5 most significant Gene Ontology (GO) terms significantly enriched in K-means clusters 1 to 5
KM Term (GO ID) P-Value RE (n/N)
1 to 5 regulation of progression through cell cycle (74) 0.0002 1.36 (50/62)
nucleolus (5730) 0.0012 1.49 (23/26) mitotic cell cycle (278) 0.0016 1.37 (35/43) macromolecule biosynthesis (9059) 0.0029 1.22 (74/102)
protein biosynthesis (6412) 0.0031 1.23 (68/93)
1 cytoplasmic membrane-bound vesicle (16023) 0.0063 3.00 (7/25)
telomere maintenance (723) 0.0071 6.40 (3/5)
ion homeostasis (50801) 0.0095 3.50 (5/15)
gastrulation (7369) 0.0147 3.90 (4/11)
digestion (7586) 0.0216 4.50 (3/7)
2 cellular respiration (45333) 0.0000 5.90 (7/8)
translation regulator activity (45182) 0.0000 3.20 (13/27)
aerobic respiration (9060) 0.0001 6.70 (5/5)
pyrophosphatase activity (16462) 0.0004 2.10 (21/68)
GTPase activity (3924) 0.0012 2.80 (10/24)
3 mitosis (7067) 0.0040 2.10 (12/26)
rRNA binding (19843) 0.0064 3.30 (5/7)
nuclear hormone receptor binding (35257) 0.0088 3.70 (4/5)
replication fork (5657) 0.0141 2.90 (5/8)
interphase of mitotic cell cycle (51329) 0.0154 2.10 (9/20)
4 hydrogen-transporting ATPase activity (46961) 0.0009 4.20 (6/10)
ATP biosynthesis (6754) 0.0018 3.90 (6/11)
cell growth (16049) 0.0053 3.30 (6/13)
transcription factor binding (8134) 0.0094 2.20 (10/32)
chromatin assembly (31497) 0.0169 3.50 (4/8)
5 ribosome (5840) 0.0000 3.40 (18/48)
ribonucleoprotein complex (30529) 0.0000 2.70 (26/88)
cytoplasm organization and biogenesis (7028) 0.0003 2.90 (12/37)
cytosolic large ribosomal subunit (5842) 0.0005 4.90 (6/11)
ribosome biogenesis and assembly (42254) 0.0006 2.90 (11/34)
These GO terms were selected as the 5 most significant GO terms enriched in each K-means cluster (KM) 1 to 5 with a P-value < 0.05 and a relative enrichment RE > 2 (except for the analysis of the fusion of clusters 1 to 5). n/N: number of genes assigned with a specific GO term in the cluster (n) with regards to the number of all genes assigned with the same GO term in the 2,474 analyzed genes (N). Interesting GO terms in regard to gonad differentiation and development are underlined. Genes with GO terms in bold type are detailed in figures 3 to 5. GO categories containing fewer than 5 genes were excluded.
in females. Cluster 8 contains genes related to 'chromo-some' (ID 5694), 'condensed chromo'chromo-some' (ID 793) but also, albeit only a few (2 out of 6), to the 'progression through the first phase of meiosis' ('meiosis I', ID 7126, i.e., rad1 and the synaptonemal complex central element protein 2, syce2). Cluster 9 is characterized by enrichment in the GO terms 'organ morphogenesis' (ID 9887), 'devel-opment' (ID 48513) and 'structural constituent of cytoskeleton' (ID 5200). Cluster 10 contains genes involved in 'urogenital system development' (ID 1655) and 'lipid binding' (ID 8289). Clusters 11 and 12 contain
genes that are also assigned with the GO term 'extracellu-lar matrix' but more specifically in relation with degrada-tion of this extracellular matrix i.e., GO term 'metallopeptidase' (5.4 and 3.8 fold enrichment respec-tively) with at least 3 matrix metallopeptidases (e.g. mmp13, mmp14, mmp19) that are directly involved in 'collagen catabolism' (ID 30574). Cluster 13 contains genes related to 'sex differentiation' (ID 7548) (e.g. amh, sox9, dmrt1, gata4, lhx9), and 'steroid biosynthesis' (ID 6694) (e.g. cyp17a1, cyp11b2, star and nr5a2). According to these annotations this cluster is likely to contain other
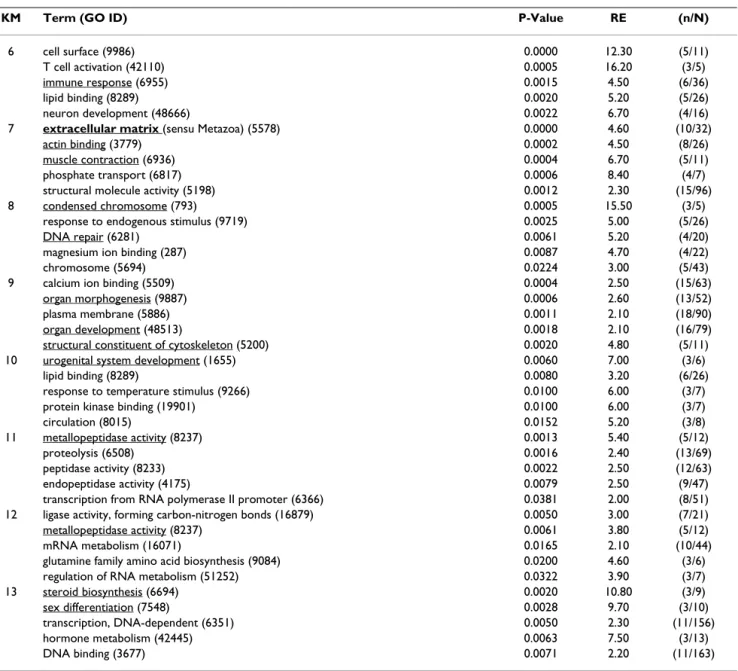
Table 2: The top 5 most significant Gene Ontology (GO) terms significantly enriched in K-means clusters 6 to 13
KM Term (GO ID) P-Value RE (n/N)
6 cell surface (9986) 0.0000 12.30 (5/11)
T cell activation (42110) 0.0005 16.20 (3/5)
immune response (6955) 0.0015 4.50 (6/36)
lipid binding (8289) 0.0020 5.20 (5/26)
neuron development (48666) 0.0022 6.70 (4/16)
7 extracellular matrix (sensu Metazoa) (5578) 0.0000 4.60 (10/32)
actin binding (3779) 0.0002 4.50 (8/26)
muscle contraction (6936) 0.0004 6.70 (5/11)
phosphate transport (6817) 0.0006 8.40 (4/7)
structural molecule activity (5198) 0.0012 2.30 (15/96)
8 condensed chromosome (793) 0.0005 15.50 (3/5)
response to endogenous stimulus (9719) 0.0025 5.00 (5/26)
DNA repair (6281) 0.0061 5.20 (4/20)
magnesium ion binding (287) 0.0087 4.70 (4/22)
chromosome (5694) 0.0224 3.00 (5/43)
9 calcium ion binding (5509) 0.0004 2.50 (15/63)
organ morphogenesis (9887) 0.0006 2.60 (13/52)
plasma membrane (5886) 0.0011 2.10 (18/90)
organ development (48513) 0.0018 2.10 (16/79)
structural constituent of cytoskeleton (5200) 0.0020 4.80 (5/11)
10 urogenital system development (1655) 0.0060 7.00 (3/6)
lipid binding (8289) 0.0080 3.20 (6/26)
response to temperature stimulus (9266) 0.0100 6.00 (3/7)
protein kinase binding (19901) 0.0100 6.00 (3/7)
circulation (8015) 0.0152 5.20 (3/8)
11 metallopeptidase activity (8237) 0.0013 5.40 (5/12)
proteolysis (6508) 0.0016 2.40 (13/69)
peptidase activity (8233) 0.0022 2.50 (12/63)
endopeptidase activity (4175) 0.0079 2.50 (9/47)
transcription from RNA polymerase II promoter (6366) 0.0381 2.00 (8/51) 12 ligase activity, forming carbon-nitrogen bonds (16879) 0.0050 3.00 (7/21)
metallopeptidase activity (8237) 0.0061 3.80 (5/12)
mRNA metabolism (16071) 0.0165 2.10 (10/44)
glutamine family amino acid biosynthesis (9084) 0.0200 4.60 (3/6)
regulation of RNA metabolism (51252) 0.0322 3.90 (3/7)
13 steroid biosynthesis (6694) 0.0020 10.80 (3/9)
sex differentiation (7548) 0.0028 9.70 (3/10)
transcription, DNA-dependent (6351) 0.0050 2.30 (11/156)
hormone metabolism (42445) 0.0063 7.50 (3/13)
DNA binding (3677) 0.0071 2.20 (11/163)
These GO terms were selected as the 5 most significant GO terms enriched in each K-means cluster (KM) 6 to 13 with a P-value < 0.05 and a relative enrichment RE > 2. n/N: number of genes assigned with a specific GO term in the cluster (n) with regards to the number of all genes assigned with the same GO term in the 2,474 analyzed genes (N). Interesting GO terms in regard to gonad differentiation and development are underlined. Genes with GO terms in bold type are detailed in figure 6. GO categories containing fewer than 5 genes were excluded.
important genes also involved in testicular differentiation or in steroidogenesis regulation. Several expression pro-files for such potential genes are shown in figure 8.
Validation and enrichment of DNA microarray data by real-time RT-PCR
Expression profiles of 102 genes, involved in early gonad development, were measured by real-time RT-PCR. These genes all belonged to the 13 distinct k-means clusters (see Additional file 1). Among these 102 genes, 84 were only measured by real-time RT-PCR and these gene expression profiles were thus added to the microarray dataset. The remaining 18 genes were common between the real-time RT-PCR dataset and the microarray dataset (see Table 3) and were used to validate our microarray dataset. Among the 18 common genes belonging to 11 out of the 13 dis-tinct k-means clusters (e.g. 1, 2, 3, 4, 5, 6, 8, 9, 10, 11, and 13), 15 expression profiles were found to have a signifi-cant correlation between the two techniques (see Table 3
and Fig. 9). Only tfa (transferrin), timp2 (tissue inhibitor of
metalloproteinase 2) and bzrp (benzodiazepine receptor, peripheral) expression profiles did not significantly
corre-late. As a result, among the 13 k-means groups, at least 10 groups (e.g. 1, 2, 3, 4, 5, 6, 8, 9, 11, and 13) contained genes with significant correlation between real-time RT-PCR and DNA microarray measurements.
Discussion
Our global approach based on gene expression profiling clearly reveals that, in our experimental conditions (11βOH∆4, 10 mg/kg of food for 3 months), the andro-gen masculinization does not induce a natural physiolog-ical response since the transcriptome of testicular trans-differentiating gonads is quite different from the one observed during natural testicular differentiation. These differences might be due to the non physiological dosage of androgen used in our experiment. A similar study using a lower dosage may help to clarify this issue, but this study
Expression profiles of genes belonging to the Gene Ontology term "nucleolus" (ID 5730)
Figure 3
Expression profiles of genes belonging to the Gene Ontology term "nucleolus" (ID 5730). Clones with similar gene names that belong to the same contig (ensemble of clones with overlapping sequences) but displayed very different expression profiles were excluded from the table (when the expression profiles were not too different the gene symbol are marked with an asterisk). Clones with similar gene names and belonging to different contigs were annotated as gene symbol_1 and gene symbol_2 as they could be considered as potentially duplicated genes or differential splicing forms. KM: K-means cluster number. N: number of genes belonging to the GO term in the specified cluster.
1 6 tcav0002.h.20 rnu3ip2_1 RNA, U3 small nucleolar interacting protein 2
tcad0001.j.22 orf2 Probable RNA-directed DNA polymerase from transposon X-element
tcad0004.f.08 znf259 zinc finger protein 259
tcac0001.m.03 eif3s6ip eukaryotic translation initiation factor 3, subunit 6 interacting protein
tcad0009.k.16 unc84a unc-84 homolog A (C. elegans)
tcad0007.f.01 rrn3 RRN3 RNA polymerase I transcription factor homolog (yeast)
2 6 tcav0003.c.15 exosc4 exosome component 4
tcav0005.d.02 rnu3ip2_2 RNA, U3 small nucleolar interacting protein 2
tcav0005.n.01 snrpd2 small nuclear ribonucleoprotein D2 polypeptide 16.5kDa
tcad0005.f.24 senp3 SUMO1/sentrin/SMT3 specific protease 3
tcac0005.a.15 nhp2l1_1 NHP2 non-histone chromosome protein 2-like 1 (S. cerevisiae)
tcab0002.g.10 ilf2 interleukin enhancer binding factor 2, 45kDa
3 5 tcad0005.j.24 nol5a nucleolar protein 5A
tcad0004.a.09 gnl3 Guanine nucleotide-binding protein-like 3
tcac0003.g.11 nola2 nucleolar protein family A, member 2 (H/ACA small nucleolar RNPs)
tcad0007.o.22 nhp2l1_2* NHP2 non-histone chromosome protein 2-like 1 (S. cerevisiae)
tcab0003.b.22 rpl12* ribosomal protein L12
4 1 tcac0004.b.05 nhp2l1_2* NHP2 non-histone chromosome protein 2-like 1 (S. cerevisiae)
5 8 tcad0007.e.18 snrpd3 Small nuclear ribonucleoprotein Sm D3
tcad0004.e.22 rps5_1 ribosomal protein S5
tcad0005.n.07 rps5_2 ribosomal protein S5
tcav0004.a.08 mphosph1 M-phase phosphoprotein 1
tcac0001.i.01 rps2 ribosomal protein S2
tcad0006.g.01 rpl12* ribosomal protein L12
tcac0003.i.01 rpa2 replication protein A2
tcav0005.d.20 nme1 non-metastatic cells 1, protein (NM23A)
6 1 tcad0004.h.09 lsm7 LSM7 homolog, U6 small nuclear RNA associated (S. cerevisiae)
11 1 tcad0009.m.04 gar2 Protein gar2 (S. pombe)
12 1 1 tcad0006.g.14 snrpd1 small nuclear ribonucleoprotein D1 polypeptide
Fe
Femalesmales F.11F.11ββββββββ MMalesales KM N Clone name Symbol Gene Name
Gene Ontology “nucleolus” (ID 5730)
Gene Ontology “nucleolus” (ID 5730)
was first designed with an androgen dosage that is com-monly used in rainbow trout aquaculture conditions. Whether the observed gene expression dysregulations are the reflection of a direct action of the androgens on the gonad, an indirect retro-control on the hypothalamus-pituitary axis, or a conjunction of both, remains to be elu-cidated. However, the synthesis of Gonadotropin Releas-ing Hormone (GnRH) and of pituitary hormones is established very early during rainbow trout ontogenesis [13] with at least the synthesis of Follicle Stimulating Hor-mone FSH [14]. Thus indirect feedback effects cannot be totally excluded.
Due to the lack of specific Gene Ontology (GO) annota-tion for rainbow trout we linked the best blast hits of each clone sequence with a cross-species GO annotation. This strategy relies on the accuracy of the blast homology search and also on the resulting accuracy of the GO
anno-tations with regards to their use in a fish species. However, even if this could lead to potential errors on a gene per gene scale, the global analysis and stringent statistical screen that we carried out enabled us to unambiguously assign most clusters with a clear biological theme. Among these GO categories, some were considered as biologically informative – i.e., not too general like for instance GO "physiological process" – and robust as they contain a suf-ficient number of different genes to support a potential biological meaning. We focused our analysis on these bio-logically informative GO categories.
With regards to the effects on the gonad, our analysis first reveals that female development is highly affected by the androgen treatment, with a down-regulation of most of the genes involved in early oogenesis stages. However within this analysis we did not characterize any cluster of early female-specific up-regulated genes potentially
Expression profiles of genes belonging to the Gene Ontology term "mitosis" (ID 7067)
Figure 4
Expression profiles of genes belonging to the Gene Ontology term "mitosis" (ID 7067). Clones with similar gene names that belong to the same contig (ensemble of clones with overlapping sequences) but displayed very different expression profiles were excluded from the table (when the expression profiles were not too different the gene symbol are marked with an asterisk). Clones with similar gene names and belonging to different contigs were annotated as gene symbol_1 and gene symbol_2 as they could be considered as potentially duplicated genes or differential splicing forms. KM: K-means cluster number. N: number of genes belonging to the GO term in the specified cluster.
1 2 3 4 5 6 8 9 Females
Females F.11F.11ββ MalesMales KM N Clone name Gene Symbol
3 3 12 4 3 2 1 1 BX077744 tcac0001.h.17 tcac0006.n.11 tcad0007.l.19 tcab0003.f.11 tcad0009.b.14 tcav0002.o.10 tcab0003.p.14 tcac0004.l.12 tcad0007.c.12 tcab0003.c.01 tcab0003.j.11 tcad0007.p.09 tcad0008.a.04 tcab0003.n.03 tcac0004.d.24 tcab0002.d.21 tcav0004.h.04 tcad0008.i.04 tcab0002.d.22 tcav0003.f.15 tcav0004.a.08 tcad0003.h.05 tcav0005.h.01 tcab0001.a.07 tcad0005.g.18 tcav0004.g.11 cdh1 rcc2* txnl4a cnp kif22 cdc20 cdc6 ccnb1 ccnb2 katna1 pttg1 rps6ka2 sssca1 smu1* tpx2 ube2c_1 bub1b prmt5 smu1* rcc2* cdca3 mphosph1 ube2c_2 mapre3 stag2 cetn2 No symbol
Cadherin 1, type 1, E-cadherin (epithelial) Telophase disk protein of 60 kDa Thioredoxin-like protein 4A
2',3'-cyclic nucleotide 3' phosphodiesterase Kinesin family member 22
CDC20 cell division cycle 20 homolog CDC6 cell division cycle 6 homolog G2/mitotic-specific cyclin-B1 G2/mitotic-specific cyclin-B2
Katanin p60 ATPase-containing subunit A1 Pituitary tumor-transforming 1
Ribosomal protein S6 kinase alpha-2
Sjoegren syndrome/scleroderma autoantigen 1 Smu-1 suppressor of mec-8 and unc-52 homolog Targeting protein for Xklp2
Ubiquitin-conjugating enzyme E2 C
BUB1 budding uninhibited by benzimidazoles 1 homolog beta Protein arginine N-methyltransferase 5
Smu-1 suppressor of mec-8 and unc-52 homolog Telophase disk protein of 60 kDa
Cell division cycle associated 3 M-phase phosphoprotein 1 Ubiquitin-conjugating enzyme E2 C
Microtubule-associated protein, RP/EB family, member 3 Stromal antigen 2
Centrin, EF-hand protein, 2 Histone H5A
1 1 1 1 2
Gene Name
Gene Ontology “mitosis” (ID 7067)
Gene Ontology “mitosis” (ID 7067)
involved in ovarian differentiation. Expression profiles of some female-specific candidate genes [15] (e.g. foxl2a and
foxl2b, cyp19a1, fst, inha) were introduced in our analysis
and all these genes were strongly and quickly inhibited by the masculinizing androgen treatment. But when pooled with our DNA microarrays dataset they did not form a tight cluster. This is probably because no additional simi-lar expression profile was found within the DNA
microar-ray dataset. This very small number of early female-specific genes is in agreement with the small number of candidate genes known to be involved in the ovarian dif-ferentiation pathway [16] in comparison with the rela-tively high number of genes that are known to characterize testicular differentiation [17]. In agreement with this view, our analysis clearly characterizes a cluster displaying testicular-specific gene expression profiles,
Expression profiles of genes belonging to the Gene Ontology term "ribosome" (ID 5840)
Figure 5
Expression profiles of genes belonging to the Gene Ontology term "ribosome" (ID 5840). Clones with similar gene names that belong to the same contig (ensemble of clones with overlapping sequences) but displayed very different expression profiles were excluded from the table (when the expression profiles were not too different the gene symbol are marked with an asterisk). Clones with similar gene names and belonging to different contigs were annotated as gene symbol_1 and gene symbol_2 as they could be considered as potentially duplicated genes or differential splicing forms. KM: K-means cluster number. N: number of genes belonging to the GO term in the specified cluster.
1 1 tcad0001.n.08 mrpl14 mitochondrial ribosomal protein L14
2 5 tcav0002.e.18 eif2s2_1 eukaryotic translation initiation factor 2, subunit 2 beta
tcav0005.a.18 mrpl34 mitochondrial ribosomal protein L34
tcac0005.c.10 mrps18a mitochondrial ribosomal protein S18A
tcab0001.i.08 rps18 ribosomal protein S18
tcad0005.h.01 rps4 ribosomal protein S4
3 6 tcav0002.h.10 mrpl20 mitochondrial ribosomal protein L20
tcac0002.l.10 mrpl49 mitochondrial ribosomal protein L49
tcac0003.g.11 nola2 nucleolar protein family A, member 2
tcab0003.p.10 rpl30 ribosomal protein L30
tcad0009.k.22 rpl5_1 ribosomal protein L5
tcab0001.b.04 rps23 ribosomal protein S23
4 7 tcav0003.c.07 mrpl17 mitochondrial ribosomal protein L17
tcav0002.i.11 mrpl48 mitochondrial ribosomal protein L48
tcab0002.o.12 rpl13a_1 ribosomal protein L13a
tcab0003.e.01 rpl18 ribosomal protein L18
tcac0001.o.22 rpl18a ribosomal protein L18a
tcab0002.h.21 rpl35a ribosomal protein L35a
tcac0005.n.06 rps2 ribosomal protein S2
5 13 tcav0001.n.14 eif2s2_2 eukaryotic translation initiation factor 2, subunit 2 beta
tcad0001.p.17 mrps15 mitochondrial ribosomal protein S15
tcac0003.i.01 rpa2 replication protein A2
tcac0004.o.12 rpl13a_2 ribosomal protein L13a
tcav0001.a.12 Rpl17 ribosomal protein L17
tcad0009.m.03 rpl19_1 ribosomal protein L19
tcad0007.h.22 rpl19_2 ribosomal protein L19
tcav0003.a.12 rpl21 ribosomal protein L21
tcad0004.g.16 rpl5_2 ribosomal protein L5
tcad0007.p.01 rpl7 ribosomal protein L7
tcac0001.i.01 rps2 ribosomal protein S2
tcad0004.e.22 rps5_1 ribosomal protein S5
tcad0005.n.07 rps5_2 ribosomal protein S5
7 5 tcad0005.o.11 mrps23 mitochondrial ribosomal protein S23
tcav0004.l.02 rpl13 ribosomal protein L13
tcav0003.i.10 rps27 ribosomal protein S27
tcav0001.j.23 rps9_1 ribosomal protein S9
tcav0004.j.05 rps9_2 ribosomal protein S9
8 2 tcad0005.o.16 mrpl15 mitochondrial ribosomal protein L15
tcad0005.h.20 rpl8_1 ribosomal protein L8
9 1 tcac0006.g.18 rpl6 ribosomal protein L6
10 3 tcac0001.c.07 rpl26 ribosomal protein L26
tcac0006.m.21 rplp0 ribosomal protein, large, P0
tcac0006.f.11 rps3 ribosomal protein S3
11 1 tcac0002.i.15 rpl8_2 ribosomal protein L8
12 2 tcab0002.b.17 rplp1 ribosomal protein, large, P1
tcab0002.f.23 rps8 ribosomal protein S8
Females
Females F.11F.11ββ MalesMales KM N Clone name Gene Symbol Gene Name
Gene Ontology “ribosome” (ID 5840)
Gene Ontology “ribosome” (ID 5840)
containing both genes known to be involved in testicular differentiation (e.g. amh, sox9, dmrt1, gata4, lhx9) [18] and some potential new players revealed by our analysis. Interestingly the expression levels of all these genes are not restored by the androgen masculinizing treatment, and this could indicate that they are probably not neces-sary for early testicular differentiation in rainbow trout. Among the gene clusters specifically up-regulated in females following masculinization with androgens, extra-cellular matrix, muscle markers/cytoskeleton and meiosis were characterized as the 3 main gene annotations. Simul-taneous up-regulation of extracellular matrix protein genes expression and down-regulation of matrix
protein-ase genes was detected in gonads of androgen-treated females. At the same time the histological analysis of these gonads showed that they contain a predominant stroma of conjunctive tissue with fibroblast like cells. Matrix tein synthesis and the concomitant decrease in matrix pro-teinase activity have been well described as a characteristic fibrotic response of an excessive Transforming Growth Factor-beta (TGFβ) production [18,19]. Of special interest in that context is the up-regulation of transforming growth factor-β1 (tgfb1) in gonads of androgen-treated animals. In rat, TGFβ induced morphological changes in Leydig cells, accompanied by an increased secretion of fibronectin, laminin and collagen IV [20]. In fibroblasts treated with TGFβ1 a similar over-expression of genes
Expression profiles of genes belonging to the Gene Ontology term "extracellular matrix" (ID 5578)
Figure 6
Expression profiles of genes belonging to the Gene Ontology term "extracellular matrix" (ID 5578). Clones with similar gene names that belong to the same contig (ensemble of clones with overlapping sequences) but displayed very different expression profiles were excluded from the table (when the expression profiles were not too different the gene symbol are marked with an asterisk). Clones with similar gene names and belonging to different contigs were annotated as gene symbol_1 and gene symbol_2 as they could be considered as potentially duplicated genes or differential splicing forms. The 15 different contigs with homologies to zona pellucida protein homologs (zp2, zp3 and zp4 genes that are highly represented in clusters 1 to 5 have been removed from that table). KM: K-means cluster number. N: number of genes belonging to the GO term in the specified cluster. 1 3 5 6 7 9 10 11 12 13 Females
Females F.11F.11ββ MalesMales KM N Clone name
1 tcac0001.g.13 col1a2_1 4 tcad0007.f.10 col1a1_1 tcad0008.g.18 lgals3bp tcac0004.c.16 timp2_1 tcad0005.f.08 timp2_2 1 tcad0008.p.06 timp2_3 2 tcav0002.d.24 c7 tcac0005.a.06 fbln1 10 tcad0006.g.17 col1a1_2 tcav0002.c.02 col1a1_3 tcad0005.o.07 col1a2_2 tcav0004.e.12 c6 tcav0001.o.16 col6a2_1 tcad0009.k.08 lum tcav0003.d.06 mfap2_1 tcab0003.o.21 mmp2 tcad0002.h.06 postn tcad0009.e.24 sparc 4 tcav0005.o.23 col6a2_2 tcad0005.n.05 mfap2_2 tcav0002.k.04 mfap2_3 tcav0005.h.23 tgm2 2 CA388477 lama5 tcav0005.f.22 Lamb2 2 tcad0007.o.11 mmp13* tcav0004.b.01 tnc 3 tcad0007.a.23 mmp13* tcad0006.h.11 mmp14 tcad0009.m.08 mmp19 1 tcac0002.b.23 Col8a2
collagen, type I, alpha 2 collagen, type I, alpha 1
lectin, galactoside-binding, soluble, 3 binding protein tissue inhibitor of metalloproteinase 2
tissue inhibitor of metalloproteinase 2 tissue inhibitor of metalloproteinase 2 complement component 7
fibulin 1
collagen, type I, alpha 1 collagen, type I, alpha 1 collagen, type I, alpha 2 Complement component C6 procollagen, type VI, alpha 2 Lumican [Precursor]
microfibrillar-associated protein 2 matrix metalloproteinase 2 periostin, osteoblast specific factor secreted acidic cysteine rich glycoprotein procollagen, type VI, alpha 2
microfibrillar-associated protein 2 microfibrillar-associated protein 2 transglutaminase 2, C polypeptide laminin, alpha 5 laminin, beta 2 matrix metalloproteinase 13 Tenascin-C matrix metalloproteinase 13 matrix metalloproteinase 14 matrix metalloproteinase 19 procollagen, type VIII, alpha 2
Gene Name Gene Symbol
Gene Ontology “
Gene Ontology “
extracellular
extracellular
matrix” (ID 5578)
matrix” (ID 5578)
Expression profiles of some representative genes within the GO category: extracellular matrix (ID 5578)
Figure 7
Expression profiles of some representative genes within the GO category: extracellular matrix (ID 5578). Expression profile values were extracted from the DNA microarray dataset and normalized to the highest signal value observed among all samples for each gene. This highest signal value was arbitrarily set at 100 and the resulting values are desig-nated the relative signal intensity for the studied gene at the indicated time points. Expression profiles of transforming growth factor-beta1, tgfb1 (AJ007836) were obtained by real-time RT-PCR. tgm2: transglutaminase 2, C polypeptide. col1a1: collagen, type I, alpha 1. col1a2: collagen, type I, alpha 2. fbln1: fibulin 1. sparc: secreted acidic cysteine rich glycoprotein. mmp1a: matrix metalloproteinase 1a. mmp13: matrix metalloproteinase 13.
Males
associated with matrix formation has been detected including many different matrix protein genes, like SPARC (Secreted Protein, Acidic and Rich in Cysteine), MGP (matrix Gla protein), and TGFβ1 itself [21], that we also detected as up-regulated in gonads following andro-gen treatment. It could then be hypothesized that this late androgen up-regulation of tgfb1 in trout gonads triggers a fibrotic response. Surprisingly, these effects are detected transiently and rather late after the application of the androgen treatment (but concomitantly with tgfb1 up-reg-ulation). Whether this reflects a total dysregulation or an exacerbation of a testicular-specific event remains to be analyzed. However, extracellular matrix deposition is known as a major event for the testicular organization. For instance, LAMA5 (Laminin α5) has been characterized as a structural protein involved in the formation of the base-ment membrane of the testicular cords [22] and this
pro-tein was found to be anti-correlated with Anti-Müllerian Hormone (AMH) [23]. In trout gonads, amh expression is not restored to male levels in androgen-treated females. This may produce a disrupted expression of some struc-tural proteins, like lama5. In the same manner, sparc is highly up-regulated in androgen-treated females. In mouse Sparc gene expression has been identified in pre-Sertoli cells at the time of sex differentiation [24] and this protein has also been postulated to play a crucial role in both Leydig and Sertoli cells differentiation by affecting their morphology [25]. Structural proteins including matrix proteins are then of major importance for a com-plete and functional testicular differentiation and their up-regulation in trout following an androgen treatment inducing testicular transdifferentiation may be the conse-quence of a dysregulation of some major regulators of their synthesis like amh or tgfb1.
Expression profiles of some representative genes from cluster 13
Figure 8
Expression profiles of some representative genes from cluster 13. Expression profile values were extracted from the DNA microarray dataset and normalized to the highest signal value observed among all samples for each gene. This highest sig-nal value was arbitrarily set at 100 and the resulting values are designated the relative sigsig-nal intensity for the studied gene at the indicated time points. angiopoietin-like 7 (angptl7, tcad0004.b.24 and tcac0004.n.11), gonadal soma-derived growth factor (gsdf, tcac0002.i.22), family with sequence similarity 49, member b (fam49b, tcac0003.e.03), claudin 12 (cldn12, tcad0009.h.07).
Table 3: Correlation between real-time RT-PCR and DNA microarray data
Gene symbol Gene name Mouse Human GenBank # r p KM
amh anti-müllerian hormone Amh AMH BX65284 13
tcav0004c.11 0.903 ***
star steroidogenic acute regulatory protein Star STAR A047032 13
tcad0007a.07 0.546 ***
tcad0008a.24 0.603 ***
dmrt1 doublesex- and mab-3-related transcription factor 1 Dmrt1 DMRT1 AF209095 9
tcad0009a.11 0.813 ***
nr5a1b nuclear receptor subfamily 5, group A, member 1 b Nr5a1 NR5A1 AY879314 11
tcad0006a.10 0.439 ***
apoeb apolipoprotein E b Apoe APOE
AJ132620 6
tcac0005c.15 0.634 ***
tcad0007a.20 0.695 ***
bzrp benzodiazepine receptor, peripheral Bzrp BZRP AY029216 9
tcab0001c.16 0.181 NS
bmp7 bone morphogenetic protein 7 Bmp7 BMP7 BX301016 3
tcav0001c.14 0.557 ***
gdf9 growth differentiation factor 9 Gdf9 GDF9 BX79301 3
tcad0007a.06 0.660 ***
inha inhibin alpha Inha INHA AB044566 6
tcav0001c.05 0.885 ***
tcav0005c.12 0.907 ***
tcac0005c.12 0.780 ***
tcad0005a.05 0.805 ***
gcl germ cell-less homolog (Drosophila) Gcl GCL BX081118 8
tcad0009a.22 0.417 ***
vldr very low density lipoprotein receptor Vldr VLDR AJ003117 3
tcad0005a.13 0.823 ***
hsp90b heat shock protein 90 beta Hspcb HSPCB BX072707 2
tcac0006c.15 0.628 ***
gapdh glyceraldehyde-3-phosphate dehydrogenase Gapdh GAPDH AF027130 1
tcab0001c.21 0.427 *** tcac0004c.07 0.463 *** tcac0006c.01 0.436 *** tcad0002a.13 0.314 * tfa transferrin Trf TF D89083 10 tcad0003a.22 0.053 NS
aldob aldolase b, fructose-bisphosphate Aldob ALDOB BX081681 3
tcad0001a.21 0.790 ***
m agoh mago-nashi homolog, proliferation-associated Magoh MAGOH BX080533 4
tcab0001c.07 0.812 ***
timp2 tissue inhibitor of metalloproteinase 2 Timp2 TIMP2 CA360907 9
tcac0004c.16 0.082 NS tcad0001a.20 0.167 NS tcad0005a.08 0.031 NS tcad0006a.16 0.013 NS tcad0007a.18 0.060 NS
tra2a transform er-2 alpha Tra2a TRA2A BX074515 5
tcad0008a.18 0.366 **
Each gene is depicted by its gene symbol and gene name (according to the zebrafish nomenclature). Symbols for mouse and human homolog genes are also given with their corresponding GenBank accession number. K-means cluster number (KM) is given for each gene with the correlation coefficient r to compare correlation between expression profiles measured by real-time RT-PCR (GenBank # in bold) and microarrays (clone numbers). Significant correlations were determined using the Pearson's correlation coefficient test (**: p < 0.01; ***: p < 0.05; NS: Not Significant).
We also detected a high number of genes associated with cytoskeletal reorganization and muscle development that were up-regulated by the treatment. Some of them (e.g.
cnn1, myh11, myl6, tagln) are even considered as
character-istic smooth muscle markers. This expression of muscle markers in the testis is likely in relation with the peritubu-lar myoid cells that surround the seminiferous tubules [26]. These myoid cells are known to express muscle markers like for instance, tpm1 (tropomyosin 1, alpha) [27], smooth muscle alpha-actin [28], and smooth muscle myosin [29]. Differentiation of these cells is androgen dependent [28] and they contribute to the testicular secre-tion of extracellular matrix components [30] along with the Sertoli cells [31]. It is therefore suggested that the mas-culinizing androgen treatment may induce the differenti-ation and subsequently a disturbed androgen-dependent proliferation of these peritubular myoid cells. These cells
are also probably involved in the important extracellular matrix synthesis that occurs concomitantly with this dif-ferentiation.
In our experiment, the androgen treatment also induced a precocious spermatogenesis as revealed both by the histo-logical analysis and by the increased expression levels of some genes involved in testicular meiosis. In fish, andro-gens and particularly, 11-oxygenated androandro-gens, are strongly involved in spermatogenesis regulation [32] and they have been shown to directly induce spermatogenesis
in vitro in some species [33]. Similarly, in mammals, three
independent studies using Sertoli cell-specific AR-knock-out mice (mice knockAR-knock-out for the androgen receptor, AR) demonstrated that the action of androgen is an absolute requirement for the completion of spermatogenesis, par-ticularly in the process of meiosis [34-36].
Scatterplots of DNA microarray and real-time RT-PCR measurements for inha (inhibin alpha), amh (anti-müllerian hormone), star (Steroidogenic acute regulatory protein) and tf (transferrin)
Figure 9
Scatterplots of DNA microarray and real-time RT-PCR measurements for inha (inhibin alpha), amh (anti-müllerian hormone), star (Steroidogenic acute regulatory protein) and tf (transferrin). Each value is represented as the percentage of the highest value in each experiment (DNA microarray or real-time RT-PCR) in all experimental groups (red for females; blue for males; black for androgen-treated females). For each gene, the correlation coefficient R and colorized vectors of microarray and real-time RT-PCR values are given.
Microarray
m
easurement
Real-Time RT-PCR measurement
inha
inha
amh
amh
star
star
tfa
tfa
R=0.9 R=0.9 R=0.9R=0.9 R=0.5 R=0.5 R=0.05R=0.05 Array PCR Array PCR Array PCR Array PCR F F F.11F.11ȕȕ MM FF F.11F.11ȕȕ MM F F F.11F.11ȕȕ MM F F F.11F.11ȕȕ MM
Conclusion
This study gives a first comprehensive survey of gene expression during androgen-induced masculinization in female rainbow trout. Our data provide supportive evi-dences that this treatment results in a marked dysregula-tion of gene expression levels when compared to natural testicular or ovarian differentiation. In our experimental condition the androgen treatment induces the complete down-regulation of female specific genes, but not the complete restoration of the male-specific gene expression patterns. Instead, some disturbed responses were charac-terized by an exacerbation of extracellular matrix synthesis and muscle type cell differentiation and proliferation (myoid cells) followed by a precocious meiosis of germ cells. All together, we suggest that androgen masculiniza-tion acts mainly through an early inhibimasculiniza-tion of female development rather than through a direct induction of testicular differentiation.
Methods
Animals and samplings
Research involving animal experimentation has been approved by the authors' institution (authorization no. 35-14). It conforms to principles for the use and care of laboratory animals and is in compliance with French and European regulations on animal welfare (European Con-vention for the Protection of Vertebrate Animals Used for Experimental and Other Scientific Purposes, ETS no. 123, January 1991). All-male and all-female rainbow trout populations were obtained at the INRA experimental fish farm (Sizun, France) as previously described [37]. Treat-ment with androgens (female treated Group 'F11β') was carried out at the onset of the first feeding [Day 0 = D0 at 55 days post-fertilization (55 dpf)], on an all-female pop-ulation. The androgen, 11β-hydroxyandrostenedione (11βOH∆4, Sigma, St. Louis, MO, USA), was adminis-tered by adding it to the food (10 mg/kg food) during 3 months starting from the first feeding and this treatment has been shown to produce 100% sex-inversions [10]. In each group, 20 to 100 gonads were sampled and pooled in duplicates corresponding to the various stages of devel-opment: onset of the free swimming period after complete yolk resumption (Day 0 = D0), D0+7 days (D7), occur-rence of oocyte meiosis (D12), beginning of ovarian lamellar structures development (D27), occurrence of previtellogenic oocytes (D60), D90 and D110. They were immediately frozen in liquid nitrogen and stored at -80°C until RNA extraction. Additional gonads were sampled at the same time-points for histological analysis, which was performed as previously described [38].
Total RNA extraction
Total RNA was extracted using TRIzol reagent (Invitrogen, Cergy Pontoise, France) as previously described [39]. The total RNA concentration was determined with an Agilent
2100 Bioanalyzer and the RNA 6000 LabChip® kit (Agilent
Technologies, Stockport, UK) according to the manufac-turers' instructions.
DNA microarrays preparation
DNA Microarrays construction
Gene expression analyses were carried out using home-made Nylon DNA microarrays using a previously described technology [40]. These DNA microarrays were built using as templates cDNA clones provided by the INRA-AGENAE program [7]. All these clones were PCR-amplified at the INRA Resources Centre for Animal Genomics (CRB GADIE, Jouy en Josas, France) using primers designed on the plasmid sequences flanking the cDNA inserts (M13RP1 5'-GTGGAATTGTGAGCGGA-TAAC and M13RP2 5'-GCAAGGCGATTAAGTTGGG). 35 cycles of PCR amplifications were carried out in 100 µl of 1× buffer containing 25 mM MgCl2, 250 µM dNTP, 100 µM of each primer, and 2.5 Units of Taq polymerase (Promega, Madison, WI). For each cDNA clone, two 100 µl PCR reactions were pooled, desiccated and resus-pended in 50 µl of distilled water. They were then spotted as previously described [41] onto Hybond-N+ 2 × 7 cm2
membranes (Amersham Pharmacia Biotech, Cleveland, OH, USA) attached to glass slides using an 8-pin print head (Pin-and-Ring™ technology) on the GMS 417™ (Affymetrix, MWG-Biotech, Ebersberg, Germany). Spot-ted DNA was then denatured and UV – cross-linked onto nylon filters. All DNA microarrays used in this study were made at the same time and under the same conditions. These trout microarrays contained 9,216 DNA spots rep-resenting 9,120 trout cDNA clones and a set of 96 con-trols. Among these cDNA clones, 7,584 were issued from a pooled-tissues library and 1,536 from a testis library [7]. Negative controls consisted of 80 spots of an Arabidopsis
thaliana cytochrome c554 clone which is devoid of
simi-larity with trout DNA sequences, 8 spots of poly(dA)80 and 8 spots of PCR reaction without template.
DNA microarray hybridizations
Microarrays were hybridized with two types of 33P-labeled probes. The first one was an oligonucleotide with a sequence common to all spotted PCR-products (vector hybridization) in order to determine the amount of target DNA accessible to hybridization in each spot. After strip-ping, a second hybridization was performed with complex probes made from 1 µg of retrotranscribed total RNA [40-42]. Protocols for probes preparation, hybridizations and washes are available online [43]. After stringent washes, arrays were exposed to phosphor-imaging plates and scanned with a FUJI BAS 5000 at 25 µm resolution. Hybridization signals were quantified using ArrayGauge software (Fuji Ltd, Tokyo, Japan).
Real-time RT-PCR
In order to validate and enrich the DNA microarray data-set, expression of 102 genes involved in early gonad devel-opment [15] was measured by real-time reverse transcription-polymerase chain reaction (RT-PCR). For cDNA synthesis, 1 µg of total RNA was denatured in the presence of random hexamers (0.5 µg) for 5 min at 70°C, and then chilled on ice. Reverse transcription (RT) was performed at 37°C for 1 h using M-MLV reverse tran-scriptase (Promega, Madison, WI, USA) as described by the manufacturer. Real-time PCR was carried out as previ-ously described [15] using the iCycler iQTM (Bio-Rad, Hercules, CA, USA) and the SYBER Green PCR master Mix (Eurogentec, Seraing, Belgium). For each target gene, all the samples were analyzed on the same plate in the same PCR assay. PCR data were processed as previously described, each transcript level being normalized by divi-sion with the expresdivi-sion values of the constitutive elonga-tion factor 1α (ef1a), which was used as an internal standard [15]. Data were then included in the microarray data matrix for clustering analysis (see next paragraph).
Data analysis
First, non-linear effects such as background, print-tip effects or saturation were corrected by LOWESS [44], using a channel by channel procedure [45]. Each array was individually normalized to the median profile of all arrays. We used the print-tip LOWESS version imple-mented in the statistical software package R [46]. Data were further corrected for the amount of spotted cDNA. This step is necessary as it has been shown that the signal intensity is proportional to the amount of probe on the surface of the array [40,47]. This effect can be observed both for glass and Nylon surfaces. This effect is corrected by the use of a reference in dual channel arrays, and by an independent measurement of the spotted amount of DNA probe in single channel arrays. On Nylon membranes, this effect is linear and can be corrected by dividing the signal by the amount of probe [40]. Briefly, sample signal intensity of each spot ("S") was divided ("S/V") by the cor-responding signal intensity of the same spot obtained with the vector hybridization ("V"). To minimize experi-mental differences between different complex probe hybridizations, 'S/V' values from each hybridization were divided by the corresponding median value of 'S/V' (quantile normalization).
A triple filtering procedure was then applied to the micro-array dataset. The first consisted of filtering background signals due to low amount of spotted DNA. When a "V" spot signal was too weak (vector signal < 3× vector local background), the data of the corresponding cDNA clone was discarded (missing data). The second filtering proce-dure was applied to eliminate non informative genes that were not measured (sample signal < 3× sample local
back-ground) in more than 20% of the samples. Finally, genes exhibiting little variation (coefficient of variation < 0.1) across all arrays were excluded from the analysis [48,49]. After these three filtering steps, 2,372 genes were retained for further analysis.
All data (2372 microarray and 102 real-time RT-PCR gene expression profiles) were then log2-transformed and were analyzed by unsupervised and supervised clustering meth-ods. Hierarchical clustering (Cluster program [50]) inves-tigated the relationships between the genes and between the samples by using centroid linkage clustering with Pearson's uncentered correlation as similarity metric on data that were median-centered on genes. Gene clusters were distinguished using the non-hierarchical unsuper-vised learning k-means algorithm implemented in the Cluster program [50]. It was run on log2-transformed and gene median-centered data with a maximum cycles parameter of 100. The optimal minimal 'k' number of clusters, corresponding to the stability of the k-means clustering, was empirically set at 13. Indeed, with smaller k numbers, some clusters merged together whereas with greater k numbers, the size of some clusters decreased (less than 50 genes to truly empty clusters). Results (color-ized matrix) of hierarchical and k-means clustering analy-ses were visualized using the Java TreeView program [51]. Functional annotation of genes was performed using Gene Ontology [52] and the GoMiner program [53]. Sig-nificance of over- or under-representation was calculated using Fisher's exact test at 0.05% risk.
Competing interests
The author(s) declares that there are no competing inter-ests.
Authors' contributions
DB and JM designed and spotted this rainbow trout microarray. DB carried out the microarray experiments and analysis with substantial help from RH for the design of the experiment and the analysis. YG and AF conceived the study, participated in its design and coordination. YG and DB drafted the manuscript. All authors read and approved the final manuscript.