HAL Id: hal-02401796
https://hal.archives-ouvertes.fr/hal-02401796v3
Preprint submitted on 30 Mar 2021
HAL is a multi-disciplinary open access archive for the deposit and dissemination of sci-entific research documents, whether they are pub-lished or not. The documents may come from teaching and research institutions in France or abroad, or from public or private research centers.
L’archive ouverte pluridisciplinaire HAL, est destinée au dépôt et à la diffusion de documents scientifiques de niveau recherche, publiés ou non, émanant des établissements d’enseignement et de recherche français ou étrangers, des laboratoires publics ou privés.
DUF : Dynamic Uncore Frequency scaling to reduce
power consumption
Etienne André, Remi Dulong, Amina Guermouche, François Trahay
To cite this version:
Etienne André, Remi Dulong, Amina Guermouche, François Trahay. DUF : Dynamic Uncore Fre-quency scaling to reduce power consumption. 2021. �hal-02401796v3�
RESEARCH REPORT
ARTICLE TYPE
DUF : Dynamic Uncore Frequency scaling to reduce power
consumption
Étienne André
1| Rémi Dulong
1,2| Amina Guermouche
1| François Trahay
11Télécom SudParis, Institut Polytechnique
de Paris, Evry, France
2University of Neuchâtel, Neuchâtel,
Switzerland
Reducing the power consumption of applications has become one of the key chal-lenges in high performance computing. Recent processor architectures differentiate processor core frequency from its uncore frequency. As a consequence, in addi-tion to tuning processor core frequency with DVFS, power consumpaddi-tion can also be controlled through Uncore Frequency Scaling (UFS).
This paper studies how the uncore frequency can be used as a leverage to improve power consumption. We propose DUF, a daemon process that dynamically adapts the uncore frequency to reduce an application power consumption with a user-defined limit on performance degradation.
The evaluation of DUF on three different architectures shows that with no perfor-mance degradation (less than 0.6 %), DUF can reduce socket power consumption by 7.94 %. We also show that DUF is able to reduce the total energy consumption by up to 18.20 %.
KEYWORDS:
Green computing, Power consumption, Uncore frequency, High Performance Computing, Powercapping
1
INTRODUCTION
Reducing the power consumption of supercomputers has become one of the key challenges in high performance computing. As a matter of fact, Fugaku, the most powerful supercomputer consumes 29.89 MW1while the US Department of Energy sets a limit of 20 MW for future exascale machines2.
Dynamically adapting the processor frequency according to the application workload is a common technique to control power consumption. It is widely used in recent architectures where limiting the power consumption and respecting the thermal design power (TDP), while using the processor to its maximum capacity (number of cores, vectorized instructions, ...) requires to lower the CPU frequency, which may negatively impact performance.
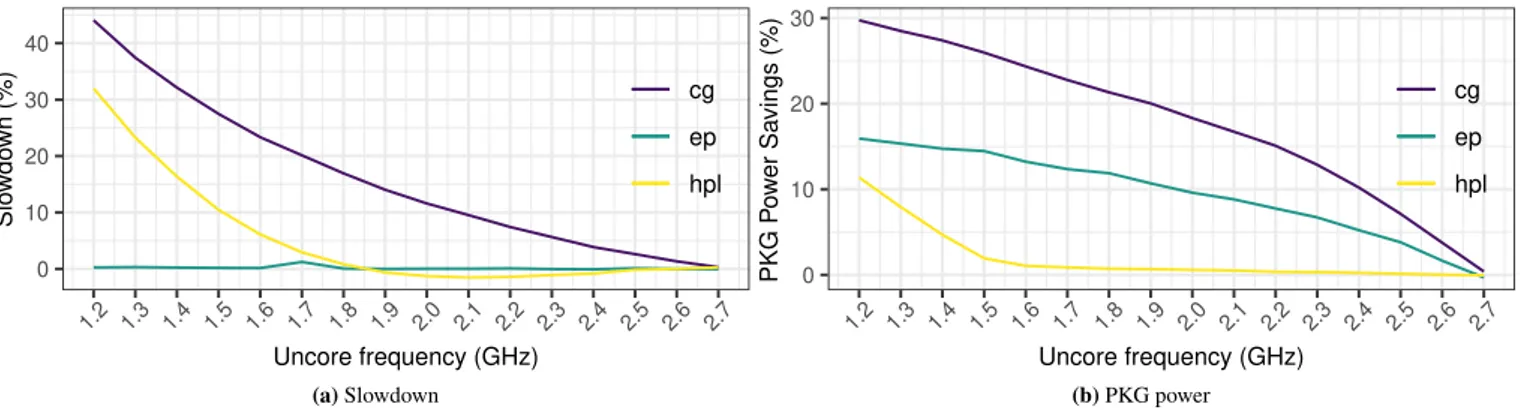
Recent processor architectures differentiate the processor core frequency (that affects the computation units and the L1/L2 caches) from its uncore frequency (which affects the last level cache and the memory controller)1. The Uncore Frequency Scaling (UFS) automatically selects the uncore frequency according to the CPU frequency, the energy and performance bias hints and cores stall cycles2. However, it does not fully benefit from the leverage provided by the uncore frequency: Figure 1 shows the effects of varying the uncore frequency in terms of slowdown (figure 1a) and power savings (figure 1b) for NAS Parallel Benchmarks EP and CG, and HPL. These figures report the relative slowdown and power saving over the default values (obtained with UFS) on the CHIFFLETplatform. Both the applications and the platform are described in section 3.
1http://www.top500.org 2https://exascale.llnl.gov/
0 10 20 30 40 1.2 1.3 1.4 1.5 1.6 1.7 1.8 1.9 2.0 2.1 2.2 2.3 2.4 2.5 2.6 2.7 Uncore frequency (GHz) Slo wdo wn (%) cg ep hpl (a)Slowdown 0 10 20 30 1.2 1.3 1.4 1.5 1.6 1.7 1.8 1.9 2.0 2.1 2.2 2.3 2.4 2.5 2.6 2.7 Uncore frequency (GHz) PKG P o w er Sa vings (%) cg ep hpl (b)PKG power
FIGURE 1Uncore frequency impact on execution time and package power consumption on a machine equipped with two Intel
Xeon E5-2680 v4 CPUs.
Figure 1a shows that uncore frequency does not impact EP performance, while figure 1b shows that setting the uncore fre-quency to 1.2 GHz reduces power consumption by more than 16 % compared to UFS. Hence, it is possible to achieve the same performance as UFS with a lower power consumption.
Interestingly, regarding HPL, reducing the uncore frequency actually slightly improves its performance by 1.47%. Since HPL power consumption reaches TDP, the core frequency is automatically lowered which degrades the performance. Manually lowering the uncore frequency decreases the power consumption. As a consequence, core frequency increases leading to better performance.
For CG, if a small performance degradation is tolerated, reducing the uncore frequency significantly lowers the power con-sumption. For instance, if a 5% slowdown is tolerated for CG, the uncore frequency can be lowered to 2.3 GHz, which reduces the power consumption by 13 %.
Based on these observations, we propose DUF (that stands for Dynamic Uncore Frequency scaling), a daemon process that dynamically adapts the uncore frequency to the application needs. DUF aims at reducing an application power consumption with a user-defined limit on performance degradation. DUF can be seen as providing different uncore frequency governors (performance at 0% slowdown, powersave at 100% slowdown), in a similar fashion to what is done for DVFS.
We tested DUF on 4 different user-defined slowdown and 11 applications and benchmarks on three different architectures. The results show that:
• On all platforms, DUF is able to respect the user-defined slowdown for 97.7 % of the tested configurations;
• DUF is able to reduce the power consumption of applications: (i) EP power consumption is reduced by up to 18.76% without altering its performance (ii) a 5.5 % slowdown on CG allows for 9.77 % power savings;
• When running under power capping constraints, DUF is able to improve the performance with a maximum of 10.53 % for CG;
Finally, we compare DUF to UPSCAVENGER3, a state of the art uncore frequency tool. The results show that DUF is able to:
• better respect the tolerated slowdown. As a matter of fact, only 62.5 % of the applications remain within the tolerated error with UPSCAVENGER
• provide a better trade off between performance and energy consumption by allowing different tolerated slowdowns. As a consequence, it reaches better energy savings than UPSCAVENGERfor many applications.
• provide better performance under powercapping constraints
The remainder of this paper is organized as follows: We describe DUF in Section 2. Section 3 presents the measurement methodology we used in our experiments and the evaluation of DUF. Finally, we compare it to the related work in Section 4 before concluding in Section 5.
2
DYNAMIC UNCORE FREQUENCY (DUF)
In this section, we describe DUF3, a daemon process that dynamically adapts the uncore frequency in order to trade a limited performance degradation for power savings. The aim of DUF is twofold: reducing the power consumption of an application, and limiting the performance degradation to a user-provided upper-bound.
2.1
Overview of DUF
The user of DUF specifies the sockets to monitor and a maximum performance degradation to tolerate. One instance of DUF is then run on each socket specified by the user. DUF periodically invokes its measurement module that collects the CPUs performance counters. Using collected data, the regulator module decides whether the uncore frequency should be changed. The decision algorithm described in section 2.3 applies for each user-specified socket. It can be summarized as follows: DUF detects the application phases (memory intensive vs compute intensive) and, for each phase, measures the performance obtained with the maximum uncore frequency. It then decreases the uncore frequency until the performance degradation reaches the user-specified limit.
2.2
Measurement module
DUF measurement module collects various CPU hardware counters corresponding to the application FLOPS/s and the memory bandwidth in order to guide the regulator module. Then it computes the arithmetic intensity as the ratio between the FLOPS/s and the memory bandwidth. An arithmetic intensity greater than 1 indicates that the application is in a CPU-intensive phase. Otherwise, we assume that the application has entered a memory-intensive phase.
2.3
Regulator module
In order to select the uncore frequency of a socket, DUF regulator module runs Algorithm 1 after every measurement period. If a new application phase is detected, DUF sets the maximum uncore frequency and measures 𝑚𝑎𝑥_𝑓𝑙𝑜𝑝𝑠 and 𝑚𝑎𝑥_𝑏𝑤 (the achieved memory bandwidth) during the next measurement period. DUF assumes a phase change happened either because the application arithmetic intensity changed from CPU-intensive to memory intensive or the opposite (lines 4 to 9), or because the FLOPS/s and the memory or the L3 cache bandwidth increased significantly (lines 25-28).
Otherwise, DUF first checks how the uncore frequency could impact the performance. As a matter of fact, if the arithmetic intensity is too high, then the uncore frequency will most likely not impact the performance. As a consequence, it is decreased (lines 10-11). In the opposite way, if the arithmetic intensity is too low, then the uncore frequency should not be changed since it may have a high impact on memory bandwidth (lines 12-13). After that, as soon as the arithmetic intensity increases, the measurement period is increased in order to leave enough time for the application to reach a steady state before changing the uncore frequency (lines 14-15).
Otherwise, DUF checks how the previous decision impacted the FLOPS/s and the memory bandwidth. DUF considers that if the FLOPS/s dropped compared to the previous measurement, then three different situations may have happened:
• If the flops dropped despite increasing the frequency or keeping it steady, then either the drop is less than 50 % and the uncore frequency is kept steady. Or the drop is higher than 50 % then the frequency is decreased because we assume that this large drop is due to the application behavior itself (lines 17-20);
• If the flops and the memory dropped by the same ratio, then the uncore frequency is increased to make sure that the impact on memory bandwidth does not impact performance (lines 21-21);
• If the memory bandwidth remained stable, then the drop comes from the behavior of the application itself rather than the impact of the uncore frequency. Based on this assumption, DUF decreases the uncore frequency (lines 16-24). Note that DUF considers the memory bandwidth as stable if it decreased by less than the tolerated slowdown. In other words, if the tolerated performance loss is 20% then the bandwidth is considered as stable if it dropped by less than 80%.
3available as open-source at:
This assumption is only based on our observations. Possible improvements of this assumption are further discussed in Section 3.7.
Finally, DUF decreases the uncore frequency as long as the performance remains within the user-specified threshold (lines 29-31) and increases it otherwise (lines 34-35). If a decrease is requested while the uncore frequency is at the minimum, DUF increases the measurement period as we reach a stable phase (line 33). The period is reset every time DUF changes the uncore frequency. DUF also increases the period if the requested uncore frequency is stable across iterations, indicating that a stable phase was reached. In all cases, we limit the measurement period to 10 times the initial period. However, for our experiments, since power measurements are reported by DUF, increasing the measurement period may impair the overall average power consumption. As a consequence, for all the experiments, except in section 3.6; the measurement period is never increased except in the case of lines 14-15.
Algorithm 1Uncore Frequency Scaling algorithm
1: loop ⊳Every 𝑝𝑒𝑟𝑖𝑜𝑑 2: 𝑓 𝑙𝑜𝑝𝑠← 𝑚𝑒𝑎𝑠𝑢𝑟𝑒_𝑓𝑙𝑜𝑝𝑠() 3: 𝑜𝑖← 𝑚𝑒𝑎𝑠𝑢𝑟𝑒_𝑜𝑝𝑒𝑟𝑎𝑡𝑖𝑜𝑛𝑎𝑙_𝑖𝑛𝑡𝑒𝑛𝑠𝑖𝑡𝑦 4: if 𝑜𝑖 >1and 𝑝ℎ𝑎𝑠𝑒! = 𝐶𝑃 𝑈 then 5: 𝑝ℎ𝑎𝑠𝑒← 𝐶𝑃 𝑈 6: FREQ=RESET_UFREQ
7: else if 𝑜𝑖 <1and 𝑝ℎ𝑎𝑠𝑒! = 𝑚𝑒𝑚𝑜𝑟𝑦 then 8: 𝑝ℎ𝑎𝑠𝑒← 𝑚𝑒𝑚𝑜𝑟𝑦 9: FREQ=RESET_UFREQ 10: if 𝑜𝑖 >100 then 11: DECREASE_FREQUENCY 12: else if 𝑜𝑖 <0.02 then 13: DO_NOTHING
14: else if 𝑜𝑙𝑑_𝑜𝑖 < 0.02 and 𝑜𝑖 >= 0.02 then 15: 𝑝𝑒𝑟𝑖𝑜𝑑= 3 ∗ 𝑑𝑒𝑓 𝑎𝑢𝑙𝑡_𝑝𝑒𝑟𝑖𝑜𝑑 16: if 𝑓 𝑙𝑜𝑝𝑠 < 𝑜𝑙𝑑_𝑓𝑙𝑜𝑝𝑠 then 17: if 𝑜𝑙𝑑_𝑑𝑒𝑐𝑖𝑠𝑖𝑜𝑛 == 𝐼𝑁𝐶𝑅𝐸𝐴𝑆𝐸_𝐹 𝑅𝐸𝑄𝑈𝐸𝑁𝐶𝑌 or 𝑜𝑙𝑑_𝑑𝑒𝑐𝑖𝑠𝑖𝑜𝑛 == 𝐷𝑂_𝑁𝑂𝑇 𝐻𝐼𝑁𝐺 then 18: if 𝑓 𝑙𝑜𝑝𝑠 <0.5 ∗ 𝑜𝑙𝑑_𝑓𝑙𝑜𝑝𝑠 then 19: DECREASE_FREQUENCY 20: elseDO_NOTHING 21: if 𝑏𝑤∕𝑜𝑙𝑑_𝑏𝑤 == 𝑓𝑙𝑜𝑝𝑠∕𝑜𝑙𝑑_𝑓𝑙𝑜𝑝𝑠 then 22: INCREASE_FREQUENCY 23: if 𝑏𝑤∕𝑚𝑎𝑥_𝑏𝑤 > 1 − 𝑝𝑒𝑟𝑓_𝑙𝑜𝑠𝑠 then 24: DECREASE_FREQUENCY 25: if 𝑓 𝑙𝑜𝑝𝑠 >2 ∗ 𝑜𝑙𝑑_𝑓𝑙𝑜𝑝𝑠 then 26: if 𝑏𝑤 >2 ∗ 𝑜𝑙𝑑_𝑏𝑤 or 𝑙3_𝑏𝑤 > 2 ∗ 𝑜𝑙𝑑_𝑙3_𝑏𝑤 then 27: FREQ=RESET_UFREQ 28: elseDECREASE_FREQUENCY 29: if 𝑓 𝑙𝑜𝑝𝑠 > 𝑝𝑒𝑟𝑓_𝑙𝑜𝑠𝑠 ∗ 𝑚𝑎𝑥_𝑓𝑙𝑜𝑝𝑠 then 30: if 𝑓 𝑟𝑒𝑞 > 𝑚𝑖𝑛_𝑓𝑟𝑒𝑞 then 31: DECREASE_FREQUENCY 32: else if 𝑝𝑒𝑟𝑖𝑜𝑑 <10 ∗ 𝑑𝑒𝑓 𝑎𝑢𝑙𝑡_𝑝𝑒𝑟𝑖𝑜𝑑 then 33: 𝑝𝑒𝑟𝑖𝑜𝑑= 𝑝𝑒𝑟𝑖𝑜𝑑 ∗ 2 34: else if 𝑓 𝑟𝑒𝑞 < 𝑚𝑎𝑥_𝑓𝑟𝑒𝑞 then 35: INCREASE_FREQUENCY
3
EXPERIMENTS
In this section, we evaluate if DUF meets its two objectives: saving power while limiting the performance degradation to a user-defined limit. We first provide the hardware settings of the experiment testbed. Then, we describe the different regulators that we study. We finally present the results of our experiments.
3.1
Experiments testbeds
This section describes the architectures and applications that we used.
3.1.1
Hardware settings
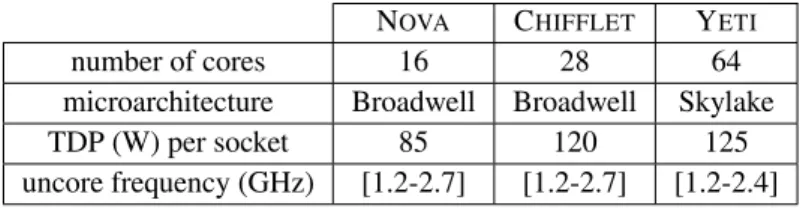
We used three servers from the Grid’50004 platform. All platforms run under Intel Pstate with performance governor. All platforms characteristics are summarized in Table 1.
• NOVAis a 23-nodes cluster, where each node is equipped with 2 Intel Xeon CPU E5-2620 v4 CPUs (Broadwell
microarchi-tecture) with 8 cores per CPU and 64 GiB of memory. The uncore frequency ranges from 1.2 GHz to 2.7 GHz.
• CHIFFLETis equipped with two Intel Xeon E5-2680 v4 CPUs (Broadwell microarchitecture) with 14 cores per CPU, and 768
GiB of memory. The uncore frequency ranges from 1.2 GHz to 2.7 GHz.
• YETIis equipped with four Intel Xeon Gold 6130 CPUs (Skylake microarchitecture) with 16 cores per CPU. Each NUMA
node has 64 GiB of memory. The uncore frequency ranges from 1.2 GHz to 2.4 GHz.
NOVA CHIFFLET YETI
number of cores 16 28 64
microarchitecture Broadwell Broadwell Skylake
TDP (W) per socket 85 120 125
uncore frequency (GHz) [1.2-2.7] [1.2-2.7] [1.2-2.4]
TABLE 1Platforms characteristics extracted from processors documentation
3.1.2
Software testbed
We conducted the experiments using several applications.
• The NAS Parallel Benchmarks5provide a set of small applications.We use: BT, CG, EP, FT, LU, MG, SP, UA from NPB-3.3.1 OpenMP version. We choose the problem size so that each application execution time is in the [20s-400s] range. On NOVA, EP and MG were run using class D while on CHIFFLET, EP, MG, and FT run using the class D problem size. The
remaining benchmarks run using class C. On YETI, all benchmarks run using class D except SP for which we use class C. The OpenMP threads are bound to cores in a round-robin fashion.
• High Performance Linpack (HPL)6is a software package that solves dense linear algebra systems. We use HPL version 2.3 compiled with Math Kernel Library (MKL) version 2019.1.144. HPL uses a configuration file where we set NB to 224 on all platforms. N is set to 58912 on NOVA, 62720 on CHIFFLETand 91840 on YETI. (PxQ) is set to (4x7) on CHIFFLET
and (8x8) on YETI.
• LAMMPS74 performs molecular dynamics simulation. We use input filein.ljprovided for the accelerate suite where we set therunvalue to 100000.
• Nwchem85is a computational chemistry application. We use the input data set3carbo.nwfrom the qdm provided files. On all platforms, the applications were compiled with gcc 6.3.0 with -O3 flag. The machines were running Linux version 4.9.0-9. HPL, LAMMPS and nwchem were compiled against Open MPI 3.1.4. Finally, all platforms cores were used during all the experiments (16 on NOVA, 28 on CHIFFLETand 64 on YETI) while hyperthreading was disabled.
3.1.3
Measurement framework
In section 1 and 3.2.1, we use LIKWID96 to set the uncore frequency and DUF measurement module to measure the power consumption of the applications. All the measurements are performed every 200 𝑚𝑠.
In section 3.3, all measurements (DUF and UPSCAVENGERrequire collecting hardware counters in addition to power) are
performed using the PAPI library107. Uncore frequency is modified and read by directly accessing the appropriate MSR registers.
3.2
Description and configurations of UFS, UPSC
AVENGERand DUF
This section briefly describes the default UFS behavior. It also describes UPSCAVENGERalgorithm and the configurations used
for DUF.
3.2.1
Default behavior of Uncore Frequency Scaling
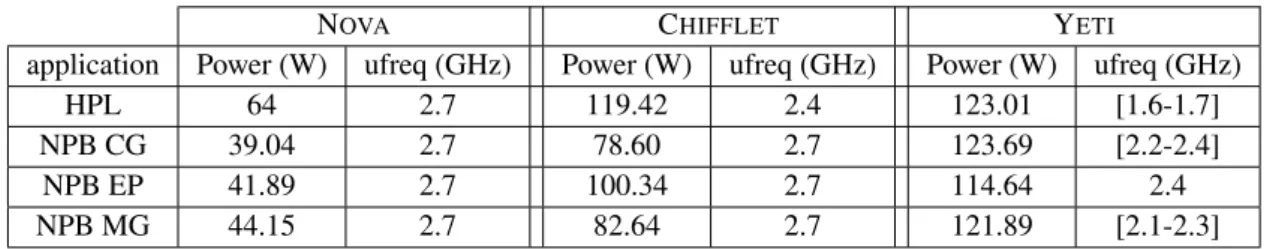
In order to understand the Uncore Frequency Scaling (UFS) default behavior on our experimental testbed, we measure the average uncore frequency when running applications with different profiles. For that purpose, we use two memory-intensive applications (CG and MG), and two CPU-intensive applications (EP and HPL).
NOVA CHIFFLET YETI
application Power (W) ufreq (GHz) Power (W) ufreq (GHz) Power (W) ufreq (GHz)
HPL 64 2.7 119.42 2.4 123.01 [1.6-1.7]
NPB CG 39.04 2.7 78.60 2.7 123.69 [2.2-2.4]
NPB EP 41.89 2.7 100.34 2.7 114.64 2.4
NPB MG 44.15 2.7 82.64 2.7 121.89 [2.1-2.3]
TABLE 2Average observed power and uncore frequency on NOVA, CHIFFLETand YETIover all sockets with UFS.
Table 2 depicts the average uncore frequency range observed over the sockets. It also provides the average power consumed by the applications over all sockets.
On NOVA, all applications run at the maximum uncore frequency. This indicates that on NOVA, the uncore frequency is always
set to the maximum. On CHIFFLET, CG, EP and MG run at the maximum uncore frequency (2.7 GHz). The uncore frequency for HPL is lower (2.4 GHz).We also observe that HPL reaches the thermal design power (TDP) of the machine (120 W). This behavior suggests that on CHIFFLET, the UFS policy first sets the uncore frequency to its maximum, and reduces it only when TDP is reached.
A similar behavior is observed on YETI: EP has a limited power consumption. Thus, the uncore frequency is set to the maximum (2.4 GHz). Meanwhile, since CG, MG, and HPL power consumption is closer to TDP, their uncore frequency is reduced.
3.2.2
UPSC
AVENGERWe compare DUF with UPSCAVENGER, a tool that regulates the uncore frequency. Since UPSCAVENGERsource code is not
available, we implemented our own version of UPSCAVENGER8based on the description in3.
5commit67f5237ab 6commit 267d
7git commit versionceb64276
At every phase change, UPSCAVENGERupdates the maximum DRAM power consumption to the one observed. Periodically,
it: (i) decreases the uncore frequency if the DRAM power consumption is steady (ii) detects a phase change and resets the uncore frequency if the power consumption increases (iii) increases the uncore frequency if both the DRAM power consumption and the IPC decrease (iv) otherwise it detects a phase change and resets the uncore frequency.
Unlike DUF, UPSCAVENGERdoes not consider a tolerated slowdown. It aims at reducing applications power consumption
without degrading their performance. It considers a 5% measurement error. As a consequence, DUF can be seen a generalization of UPSCAVENGER, where UPSCAVENGERshould approximately stand between DUF with a 0 % and a 5 % slowdown tolerance.
3.2.3
DUF configuration
In order to evaluate DUF, we use four different slowdown tolerances: 𝐷𝑈𝐹0 (0 % tolerance), 𝐷𝑈𝐹5 (5 % tolerance), 𝐷𝑈𝐹10 (10 % tolerance), and 𝐷𝑈𝐹20(20 % tolerance).
DUF considers an error margin of 2 % regarding accuracy of measurements. Finally, we set DUF uncore frequency step to 100 MHz and the measurement period to 200 𝑚𝑠. Lower measurement periods lead to an overhead on some applications. On the other hand, periods such as 500 𝑚𝑠 are too large for short running applications such as LAMMPS or CG on CHIFFLET. From
our observations, 200 𝑚𝑠 offers a good trade off for all the applications. Note that we discuss how DUF could automatically change its measurement period in paragraph 3.7.
Finally, as stated in section 2, line 33 from Algorithm 1 is disabled for all experiments except in section 3.6.
3.2.4
Coping with UFS
The default UFS can only be disabled in the BIOS which we cannot access on Grid’5000. As a consequence, when running DUF, the default UFS runs as well. Therefore, a decision taken by DUF can be overwritten by the default UFS. Section 3.2.1 concluded that both CHIFFLETand YETIdefault UFS decreases the uncore frequency when TDP is reached. Thus, the frequency
set can be lower than the one requested by DUF. From our observations, this behavior occurs only for applications that reach TDP. In order to handle this situation, at every iteration, both DUF and UPSCAVENGERuse the uncore frequency that was set
by UFS to compute the next frequency.
3.3
Experiments results
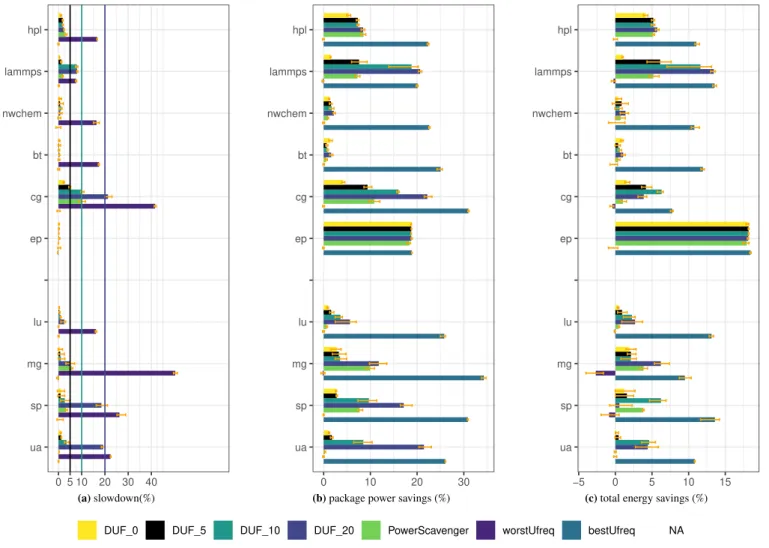
We run the applications described in section 3.1.2 on NOVA, CHIFFLETand YETIwhile running the regulators. Figures 2a, 3a and 4a report the measured slowdown, Figures 2b, 3b and 4b show the socket power savings, and Figures 3c, 3c and 4c depict the socket + DRAM energy savings. Finally, Figure 6 reports the DRAM power savings on NOVA(Figure 6a), CHIFFLET(Figure 6b) and YETI(Figure 6c). Each experiment was run 10 times and we keep the average over the 8 runs between the minimum and
maximum execution times. All the results are presented as a percentage over the default values (obtained with UFS) on each platform. In addition to DUF results, the figures also present UPSCAVENGERresults and the best and worst values obtained by
manually setting the uncore frequency.
On each figure, error bars are also shown. They show the minimum and maximum observed values. The measurement dif-ference is lower than 1 % for most of the configurations, while very few applications see a variation overs 2 %. This indicates the accuracy of the measurements. Note however that SP shows more variation on NOVA and YETI but also when applying
powercapping. But a similar behavior is also observed on the default behavior or on the bestUfreq and worstUfreq plots.
3.4
Impact on execution time
This section evaluates how DUF and UPSCAVENGERaffect the application execution time, and if the slowdown respects: a user-defined limit for DUF with a 2 % measurement error, and a 5% measurement error for UPSCAVENGER.
Figures 2a, 3a and 4a show that, on all platforms, DUF remains within the tolerated slowdown for the majority of applications. Overall, DUF respects the user-defined limit for 128 of the 131 tested settings. Only three applications exceed the limit. CG on NOVA(2.37 %) and CHIFFLET(2.15 %) with 𝐷𝑈𝐹0and LU on YETI(22.11 %) with 𝐷𝑈𝐹20. These overheads are however very small and we could not explain why they occur.
The figures also show that the behavior of some applications does not allow DUF to slow them down. For instance, BT on NOVAand YETIand nwchem on NOVAand CHIFFLETkeep switching phases, while HPL on CHIFFLETand LU, SP and UA on
ua sp mg lu ep cg bt nwchem lammps hpl 0 5 10 20 30 40 (a)slowdown(%) ua sp mg lu ep cg bt nwchem lammps hpl 0 10 20 30
(b)package power savings (%)
ua sp mg lu ep cg bt nwchem lammps hpl −5 0 5 10 15
(c)total energy savings (%)
DUF_0 DUF_5 DUF_10 DUF_20 PowerScavenger worstUfreq bestUfreq NA
FIGURE 2DUF impact on performance, power and energy consumption on NOVA
YETInaturally see their FLOPS/s drop by more than the tolerated slowdown which leads DUF to increase the uncore frequency.
EP also shows no slowdown at all. This is because uncore frequency has no impact on EP as stated in Figure 1.
The slowdown caused by UPSCAVENGERremains below the 5% measurement error for 20 out of the 32 tested settings. For
the remaining applications (CG and MG on NOVA, CG, FT, MG and SP on CHIFFLET, and LAMMPS, nwchem, CG and MG on YETI), the slowdown is between 5 and 29.67%. Note that the slowdown of MG on NOVA, SP on CHIFFLETand MG on YETI
is very close close to 5 % (5.64, 5.81 and 5.32 respectively). LAMMPS and CG have the highest slowdown on YETI(29.67% for CG and 20.40% for LAMMPS). This is because UPSCAVENGERassumes that as long as the DRAM power consumption
remains constant, the frequency can be decreased, regardless of the IPC and the L3 bandwidth. However, for some applications, (eg. LAMMPS on YETI), both the FLOPS/s and the L3 bandwidth drop while the memory power consumption is slightly
impacted. As a consequence, UPSCAVENGERkeeps decreasing uncore frequency while DUF increases it. Regarding CG, the power memory consumption remains steady for several iterations. As a consequence, UPSCAVENGERdecreases the uncore
frequency during the steady phases. On the other hand, decreasing the uncore frequency has a direct impact on CG performance which allows DUF to stop decreasing.
As a conclusion, DUF manages to better respect the tolerated slowdown compared to UPSCAVENGER. As a matter of fact, in 97.7 % of the studied cases, DUF remains within the tolerated slowdown while the percentage drops to 62.5 % for UPSCAV -ENGER. Moreover, the slowdown goes as high as 29.67 % for CG on YETI. This indicates that memory power consumption is not the best indicator to lead uncore frequency decisions for some applications.
ua sp mg lu ft ep cg bt nwchem lammps hpl 0 5 10 20 30 40 (a)slowdown(%) ua sp mg lu ft ep cg bt nwchem lammps hpl 0 10 20 30
(b)package power savings (%)
ua sp mg lu ft ep cg bt nwchem lammps hpl −10 0 10
(c)total energy savings (%)
DUF_0 DUF_5 DUF_10 DUF_20 PowerScavenger worstUfreq bestUfreq
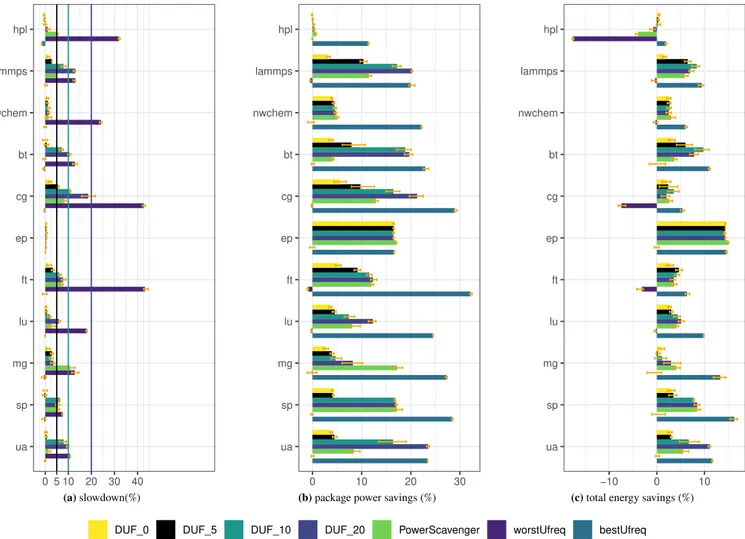
FIGURE 3DUF impact on performance, power and energy consumption on CHIFFLET
3.5
Impact on power and energy consumption
This section evaluates how DUF and UPSCAVENGERreduce the power and energy consumption of the applications.
3.5.1
Impact on socket power consumption
Figures 2b, 3b and 4b show the package power saving when using DUF and UPSCAVENGERon NOVA, CHIFFLETand YETI. The figures show that for most applications, both DUF and UPSCAVENGERmanage to provide power savings reaching up
to 23.54 % for DUF. As expected, among DUF four configurations, 𝐷𝑈𝐹20 reaches the maximum power savings for most applications. For instance, 𝐷𝑈𝐹20provides the best savings at 22.19 % with CG on NOVA.
EP has the exact same behavior for all regulators. As reported in figure 1, EP is not impacted by uncore frequency, it reaches 16.55 % power saving on CHIFFLET regardless of the regulator. For other applications, a small slowdown allows for power
savings. For instance, with a slowdown of 0.58 %, 𝐷𝑈𝐹5manages to reach 7.94 % of power savings for BT on CHIFFLET. A similar behavior is observed with HPL where 𝐷𝑈𝐹10manages to save 7.39 % of power while the slowdown reaches 1.88 % on NOVA. With a slightly higher slowdown, for UA, 𝐷𝑈𝐹10shows 3.46 % performance degradation while providing 8.49 % power savings on NOVA. A similar behavior with MG on CHIFFLETis observed: with a slowdown of 3.51 %, 𝐷𝑈𝐹20manages to reach 8.22 % power savings. On YETI, 𝐷𝑈𝐹5manages to provide 7.31 % power savings with 2.98 % slowdown for nwchem.
Overall, in addition to EP, with less than 4 % slowdown, DUF manages to improve the power consumption of many applica-tions (hpl, LAMMPS, SP and UA on NOVA, LAMMPS, BT, FT, LU and MG on CHIFFLET, nwchem on YETI) by 7.3 to 10.36 % for all three platforms.
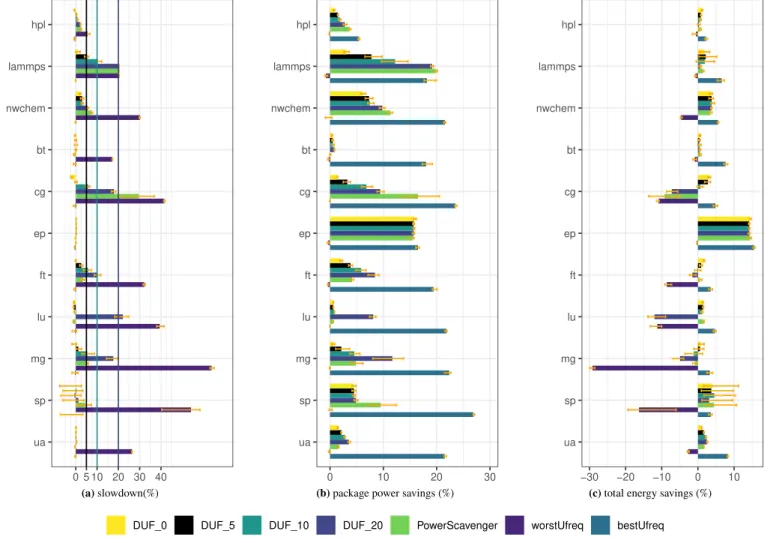
ua sp mg lu ft ep cg bt nwchem lammps hpl 0 5 10 20 30 40 (a)slowdown(%) ua sp mg lu ft ep cg bt nwchem lammps hpl 0 10 20 30
(b)package power savings (%)
ua sp mg lu ft ep cg bt nwchem lammps hpl −30 −20 −10 0 10
(c)total energy savings (%)
DUF_0 DUF_5 DUF_10 DUF_20 PowerScavenger worstUfreq bestUfreq
FIGURE 4DUF impact on performance, power and energy consumption on YETI
For hpl, 𝐷𝑈𝐹20causes a 1.17 % slowdown while only 0.36 % power savings are observed on CHIFFLET. This is because HPL power consumption and performance are roughly the same from 2.4GHz to 1.7 GHz as shown in Figure 1. However, as stated in section 3.4, in HPL, the FLOPS/s decrease below the tolerated slowdown. Thus DUF does not manage to reach 1.6 GHz. UPSCAVENGERmanages to reach lower frequencies but for very few iterations which is not enough to show an impact on power
consumption. In addition to HPL, BT on NOVAand YETIshow less than 2 % power savings for both tools. This is because of the behavior of the applications which keep switching phases. As a consequence neither DUF nor UPSCAVENGERcan reduce
the uncore frequency.
For the majority of the applications, the power savings obtained with UPSCAVENGERare similar to those of DUF with
equivalent slowdown. For instance, on NOVA, HPL power savings with UPSCAVENGERand 𝐷𝑈𝐹20 are equivalent and both tools have the same slowdown. This is also the case for CG on CHIFFLETwhere UPSCAVENGERperformance and power savings
are between 𝐷𝑈𝐹5and 𝐷𝑈𝐹10. This indicates that, for the same slowdown, DUF and UPSCAVENGERreach the same uncore frequency.
However, for some applications DUF provides better savings than UPSCAVENGER despite performing better. This is the case for LAMMPS, CG, MG and SP on NOVA. For instance, CG performance with UPSCAVENGERstand between 𝐷𝑈𝐹10and
𝐷𝑈 𝐹20while 𝐷𝑈𝐹10provides better savings (16.01 % savings for 𝐷𝑈𝐹10and 10.84 % savings with UPSCAVENGER). On the other hand, UPSCAVENGERprovides better savings for nwchem and SP on CHIFFLETand LAMMPS and UA on YETI. For
instance, with UPSCAVENGERand 𝐷𝑈𝐹20, LAMMPS reaches equivalent slowdown but the power savings with UPSCAVENGER reach 19.83 % while they reach 19.13 % with 𝐷𝑈𝐹20.
3.5.2
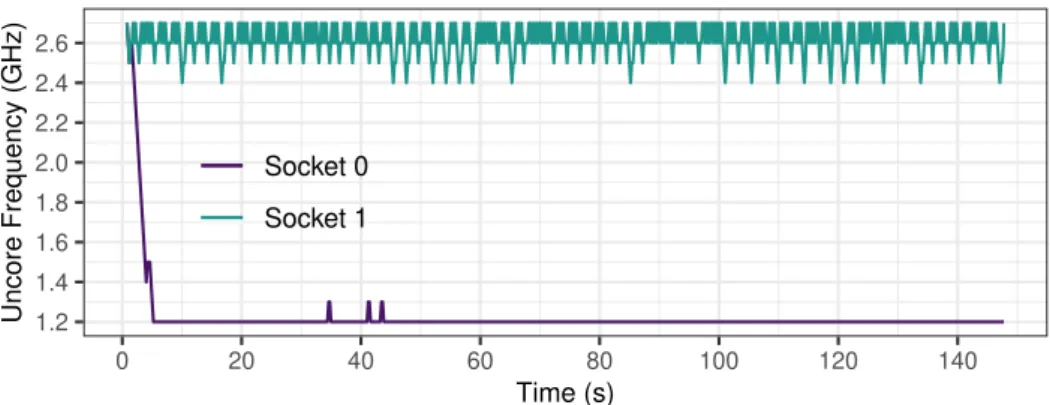
Per-socket uncore frequency regulation
Since DUF handles each socket separately, the uncore frequency may not be the same on each socket. Figure 5 shows how the uncore frequency varies on each socket when running SP on CHIFFLETusing 𝐷𝑈𝐹20. It shows that, on socket 0, the frequency is most of the time at the minimum while it varies between 2.4 GHz and 2.7 GHz on socket 1. This is due to the fact that on socket 1, both the FLOPS/s and the memory bandwidth keep increasing then decreasing. Thus, DUF keeps decreasing and increasing the uncore frequency. On the other hand, on socket 0, the memory bandwidth is stable and DUF manages to reduce the uncore frequency. 1.2 1.4 1.6 1.8 2.0 2.2 2.4 2.6 0 20 40 60 80 100 120 140 Time (s) Uncore Frequency (GHz) Socket 0 Socket 1
FIGURE 5Uncore frequency during SP execution with 𝐷𝑈𝐹20on CHIFFLET
3.5.3
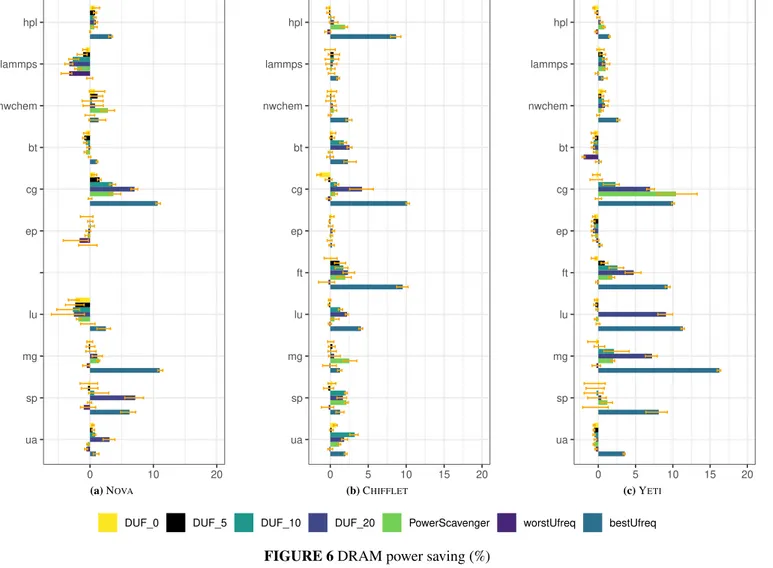
Impact on DRAM power consumption
Figures 6a, 6b and 6c show the impact of DUF and UPSCAVENGERon memory power consumption.
The results show that on most applications, both DUF and UPSCAVENGERmanage to provide power savings. Just as the
socket power consumption, the best savings are reached with 𝐷𝑈𝐹20for most applications. For instance, CG on NOVAreaches 7.02 % power savings while LU reaches 9.09 % on YETI. On CHIFFLET, for most applications, the DRAM power consumption
corresponds to the default DRAM power consumption ± 2.5 %. CG and UA show larger savings reaching 4.18 % and 3.21 % respectively.
Regarding UPSCAVENGER, for most applications, the behavior is similar to package power savings where DRAM power
savings are equivalent to DUF for the same slowdown on NOVA, CHIFFLETand YETI. However, HPL and SP on NOVAand
nwchem on YETI provide better savings with DUF compared to UPSCAVENGER. For instance, UPSCAVENGERand 𝐷𝑈𝐹0 show equivalent DRAM power savings for HPL on NOVA while its slowdown reaches 0.97 % with 𝐷𝑈𝐹0 and 3.08 % with UPSCAVENGER. On the other hand, UPSCAVENGERshows better savings than DUF for nwchem on NOVAand SP on CHIFFLET.
As a matter of fact, nwchem slowdown reaches 0.29 % with UPSCAVENGERand 0.69 % with 𝐷𝑈𝐹5while the power savings with UPSCAVENGERreach 2.82 % and 1.19 % with 𝐷𝑈𝐹5.
3.5.4
DUF impact on energy consumption
Figures 2c, 3c and 4c show how DUF and UPSCAVENGERimpact applications energy consumption. We consider both socket
and DRAM power consumption when measuring the energy consumption.
On all platforms, both UPSCAVENGERand DUF allow for energy savings for most applications. DUF provides energy savings
for all applications except for HPL on CHIFFLETand BT and MG YETI. Note that nwchem and BT on NOVAand HPL, FT and LU show very low energy savings (between 1 and 2 %) on YETI. The maximum savings reach 18.20 % on NOVA, 14.41 % on
CHIFFLETand YETIfor EP with all configurations.
On CHIFFLET, LU, MG, SP and UA show the best energy savings with 𝐷𝑈𝐹20. For the other applications, limiting the overhead provides better energy savings. For instance, with a slowdown of 7.14 %, energy savings reach 9.76 % for BT. In addition to BT and EP, DUF manages to reach over 5 % energy savings for LAMMPS, LU, SP and UA.
ua sp mg lu ep cg bt nwchem lammps hpl 0 10 20 (a)NOVA ua sp mg lu ft ep cg bt nwchem lammps hpl 0 5 10 15 20 (b)CHIFFLET ua sp mg lu ft ep cg bt nwchem lammps hpl 0 5 10 15 20 (c)YETI
DUF_0 DUF_5 DUF_10 DUF_20 PowerScavenger worstUfreq bestUfreq
FIGURE 6DRAM power saving (%)
On NOVA, HPL, LAMMPS, nwchem, BT, LU and MG reach their best energy savings with 𝐷𝑈𝐹20, while CG, SP and UA provide better energy savings with 𝐷𝑈𝐹10. Overall, in addition to EP, DUF manages to save more than 5 % energy for HPL, LAMMPS, CG, MG and SP.
On YETI, due to its significant slowdown, 𝐷𝑈𝐹20leads to more energy consumption for CG, FT, LU and MG. For the other applications, the best savings are reached with 𝐷𝑈𝐹0or 𝐷𝑈𝐹5except for SP and UA where 𝐷𝑈𝐹10and 𝐷𝑈𝐹20reach the best savings. However, unlike on NOVAand CHIFFLET, DUF manages to save more than 5 % energy only for EP.
UPSCAVENGERprovides better savings than DUF for nwchem and MG on CHIFFLET(3 % and 4.12 % respectively) and LU on
YETI(1.62 %). For HPL, LAMMPS, CG, MG and SP on NOVA, LAMMPS and FT on CHIFFLETand nwchem and LU on YETI,
DUF provides equivalent to better energy consumption compared to UPSCAVENGERdespite similar or better performance.
Finally, DUF provides better savings than UPSCAVENGERfor all applications on NOVA (except EP where they provide
equivalent savings), all applications except nwchem and MG on CHIFFLET(note that DUF and UPSCAVENGERshow equivalent
slowdown for SP and EP) and HPL, LAMMPS, CG, FT, MG and UA on YETIregardless of the slowdown.
3.6
Improving performance with uncore frequency
As stated in section 1, in addition to improving power consumption, uncore frequency can be used as a leverage to improve the performance of applications that reach TDP. However, the observed performance improvements were rather small. In order to better observe this behavior, we use powercapping, to put a stronger constraint on the default UFS.
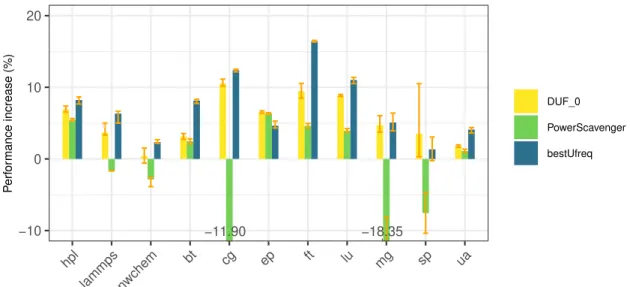
Figure 7 shows the performance increase when using 𝐷𝑈𝐹0and UPSCAVENGERon YETI. We set the powercap to 100W for all applications except EP (98 W), nwchem (90 W) and SP (80 W) because these applications have a lower power consumption under normal configuration. The results are compared to those with default UFS under the same constraints. Note that we only run these experiments on YETIbecause powercapping is not enabled on NOVAand CHIFFLET. Recall that for these experiments, we use Algorithm 1 while considering longer measurement periods if the minimum uncore frequency is reached. This is because, in this section, we only focus on performance. As a consequence, DUF does not need to report as frequently power measurements. The results show that for all the applications, using DUF improves performance, with a maximum of 10.53% for CG. UPSCAVENGERshows performance loss for 5 out of the 11 applications (namely LAMMPS, nwchem, CG, MG, and SP). More-over, DUF outperforms UPSCAVENGERin all cases except for EP where both tools show the same performance. For instance,
UPSCAVENGERdegrades the performance of CG by 11.90 %, while DUF improves the run time by 10.53 %. Regarding EP performance, they reach 6.58 % with DUF and 6.33 % with UPSCAVENGER.
The reason behind the performance increase lies in the core frequency. For instance for FT, when DUF is not used, the core frequency varies between 1.6 and 1.8 GHz for the four sockets, and UFS sets the uncore frequency to 2.21 GHz or higher. When using DUF, the average core frequency is 2.02 GHz while the average uncore frequency is 1.79 GHz. Thus, by limiting the power consumption with the uncore frequency, DUF allows to increase the core frequency, which improves the application per-formance. This shows that even if YETIuncore frequency scaling algorithm is more reactive to the behavior of the applications, DUF is actually able to better match the needs of the application being executed.
Finally, because of their behavior, nwchem and UA show a performance difference of less than 1.81 %. UA behavior for instance leads to frequently resetting the uncore frequency. As a consequence, the uncore frequency cannot reach low values to allow increasing the core frequency.
−11.90 −18.35 −10 0 10 20 hpl lammps nwchem bt cg ep ft lu mg sp ua P erf or mance increase (%) DUF_0 PowerScavenger bestUfreq
FIGURE 7Performance increase when using DUF under powercapping on YETI
3.7
Limitations and possible improvements
DUF evaluation shows how it can improve power consumption while respecting the tolerated slowdown. However, we identified some limitations which are discussed in this section.
As stated in section 2.3, DUF assumes that the bandwidth drop is correlated to the performance drop. Although we did not observe a situation where this assumption affects the performance, it does not reflect the real impact of memory bandwidth. Moreover, DUF assumes that an increase in the FLOPS/s can come with an increase in the L3 or memory bandwidth with same factor. Modeling the impact of uncore frequency on L3 cache and memory bandwidth is required to better adapt to the application.
Another improvement could be to adapt the phase change to the platform. As a matter of fact, DUF assumes that if the arithmetic intensity is higher than 1, then the current phase is CPU intensive, otherwise it is memory intensive. However, memory or CPU intensiveness is also related to the processor. As a consequence, we should adapt the condition of the detection phase to the target processor.
Finally, depending on the application, DUF period should adapt if the application behavior varies too frequently by studying how often the phase changes.
3.8
Conclusions
The evaluation of DUF exhibits how uncore frequency can improve power consumption. It also showed the potential of uncore frequency as a leverage to improve performance. The overall conclusions of the experiments are:
• DUF can adapt to different architectures and different applications;
• DUF manages to stay within the tolerated slowdown for 97.7 % of the tested configurations;
• DUF manages to reduce socket and memory power consumption. For some applications (such as BT), DUF reaches significant power savings (7.94%) without degrading the performance;
• By slightly degrading the performance of applications, DUF significantly reduces their power consumption;
• DUF manages to improve applications performance under power capping constraints by allowing the cores frequency to be increased;
• Compared to UPSCAVENGER, DUF manages to better respect the applications slowdown, and to provide better
performance under power capping.
4
RELATED WORK
Adapting uncore frequency is a recent research topic. In11the authors provide a machine learning technique to predict the optimal uncore frequency to be used and showed that the nature of the application impacts the energy saving that can be reached. The authors also study the impact of different performance loss policies. However, the proposed tool is static and needs a training phase on all possible frequencies before deciding the best frequency to run the applications whereas DUF is dynamic and is able to adapt to the application behavior.
Won et al. use a similar approach: they design an artificial neural network to characterize applications and to apply the best uncore power management policy to a network of chips12. In this study, the authors emulate a new hardware mechanism that would implement their approach.
In13,14the authors present a study of the potential energy savings using DVFS and UFS for the application GAMESS. They proposed a performance and a power model, and a runtime to adjust both core and uncore frequencies. The runtime also takes a maximum performance degradation limit. The results show great energy savings with, in some cases, very low overhead. However, this work targets only GAMESS. The models were later used to design a tool that distributes a power budget over socket and memory15. However, the tool computes the performance obtained with all core and uncore frequencies, rather than adapting to the behavior of the applications like DUF.
The READEX project16aims at providing a tool suite to improve the energy-efficiency of HPC applications by providing the best combination of tuned parameters (like core and uncore frequency). Using READEX, an application is first instrumented using an automatic instrumentation tool. Then the program is analyzed and optimal configurations are stored in a configuration file. Later, learning techniques to improve the decisions were introduced17. This approach is complementary to DUF which makes all its decisions at runtime without knowing the application global behavior.
Regarding powercapping, studies like18show how dynamically setting core and uncore frequency can improve performance under powercapping. However, they consider iterative applications where decisions made in a loop are used in the next loop.
The work presented in3 is the closest to DUF. In section 3.3, we compared DUF to our own implementation of UPSCAV
equivalent slowdown. One of the major differences between UPSCAVENGERand DUF is that UPSCAVENGERrelies on
mem-ory power consumption to avoid any slowdown while saving power. On the other hand, DUF considers that the user can decide the value of the tolerated slowdown. As a consequence, DUF is better able to trade performance for energy whenever possible.
5
CONCLUSION AND FUTURE WORK
This paper presents DUF, a daemon process that dynamically adapts the uncore frequency in order to reduce the power consumption of applications while limiting the performance degradation to a user-defined limit. The evaluation shows that DUF significantly reduces the power and energy consumption while respecting the slowdown limit. It also shows how uncore frequency can be used as a leverage to improve performance.
As a future work, we plan to further study how to dynamically set the power cap to the application need and combine it to uncore frequency management. We also plan to target DVFS in DUF. Finally, since DUF handles each socket separately, we will study how applications with different behaviors can be run on each socket in order to maximize power savings.
References
1. Hill DL, Bachand D, Bilgin S, et al. THE UNCORE: A MODULAR APPROACH TO FEEDING THE HIGH-PERFORMANCE CORES.. Intel Technology Journal 2010; 14(3).
2. Hackenberg D, Schöne R, Ilsche T, Molka D, Schuchart J, Geyer R. An Energy Efficiency Feature Survey of the Intel Haswell Processor. IEEE International Parallel and Distributed Processing Symposium Workshop, IPDPS 2015: 896–904. doi: 10.1109/IPDPSW.2015.70
3. Gholkar N, Mueller F, Rountree B. Uncore power scavenger: a runtime for uncore power conservation on HPC systems.
International Conference for High Performance Computing, Networking, Storage and Analysis (SC)2019: 27:1–27:23. doi:
10.1145/3295500.3356150
4. Balouek D, Amarie AC, Charrier G, et al. Adding virtualization capabilities to the Grid’5000 testbed. International
Conference on Cloud Computing and Services Science2012: 3–20.
5. Bailey D, Barszcz E, Barton J, et al. The Nas Parallel Benchmarks. International Journal of Supercomputing Applications 1991; 5(3): 63–73.
6. Petitet A, C. Whaley R, Dongarra J, Cleary A. HPL - a Portable Implementation of the High-Performance Linpack Benchmark for Distributed-Memory Computers. http://www.netlib.org/benchmark/hpl 2000.
7. Plimpton S. Fast parallel algorithms for short-range molecular dynamics. Journal of computational physics 1995; 117(1): 1–19.
8. Valiev M, Bylaska EJ, Govind N, et al. NWChem: A comprehensive and scalable open-source solution for large scale molecular simulations. Computer Physics Communications 2010; 181(9): 1477–1489.
9. Treibig J, Hager G, Wellein G. LIKWID: A Lightweight Performance-Oriented Tool Suite for x86 Multicore Environments.
International Conference on Parallel Processing (ICPP)2010: 207–216.
10. Terpstra D, Jagode H, You H, Dongarra J. Collecting performance data with PAPI-C. Tools for High Performance
Computing2010: 157–173.
11. Bekele SA, Balakrishnan M, Kumar A. ML Guided Energy-Performance Trade-Off Estimation For Uncore Frequency Scaling. Spring Simulation Conference (SpringSim) 2019: 1-12.
12. Won J, Chen X, Gratz P, Hu J, Soteriou V. Up by their bootstraps: Online learning in Artificial Neural Networks for CMP uncore power management. International Symposium on High Performance Computer Architecture (HPCA) 2014: 308-319.
13. Sundriyal V, Sosonkina M, Westheimer BM, Gordon M. Comparisons of Core and Uncore Frequency Scaling Modes in Quantum Chemistry Application GAMESS. High Performance Computing Symposium (HPC) 2018: 13:1–13:11.
14. Sundriyal V, Sosonkina M, Westheimer B, Gordon M. Core and Uncore Joint Frequency Scaling Strategy. Journal of
Computer and Communications2018; 06: 184-201.
15. Sundriyal V, Sosonkina M, Westheimer B, Gordon M. Maximizing Performance under a Power Constraint on Modern Multicore Systems. Journal of Computer and Communications 2019; 07: 252-266.
16. Schuchart J, Gerndt M, Kjeldsberg PG, et al. The READEX formalism for automatic tuning for energy efficiency. Computing 2017. doi: 10.1007/s00607-016-0532-7.
17. Gocht A, Schöne R, Bielert M. Q-Learning Inspired Self-Tuning for Energy Efficiency in HPC. International Conference
on High Performance Computing Simulation (HPCS)2019: 344-347. doi: 10.1109/HPCS48598.2019.9188112
18. Wang B, Miller J, Terboven C, Müller M. Operation-Aware Power Capping. Euro-Par 2020: Parallel Processing 2020: 68–82.