HAL Id: hal-01006004
https://hal.archives-ouvertes.fr/hal-01006004
Submitted on 5 Jun 2017
HAL is a multi-disciplinary open access
archive for the deposit and dissemination of
sci-entific research documents, whether they are
pub-lished or not. The documents may come from
teaching and research institutions in France or
abroad, or from public or private research centers.
L’archive ouverte pluridisciplinaire HAL, est
destinée au dépôt et à la diffusion de documents
scientifiques de niveau recherche, publiés ou non,
émanant des établissements d’enseignement et de
recherche français ou étrangers, des laboratoires
publics ou privés.
Distributed under a Creative Commons Attribution| 4.0 International License
Coupling between Progressive Damage, Temperature
and Permeability of Concrete: Experimental and
Numerical Study
Abdelhafid Khelidj, Marta Choinska, Georges Chatzigeorgiou, Gilles
Pijaudier-Cabot
To cite this version:
Abdelhafid Khelidj, Marta Choinska, Georges Chatzigeorgiou, Gilles Pijaudier-Cabot. Coupling
be-tween Progressive Damage, Temperature and Permeability of Concrete: Experimental and Numerical
Study. Restoration of Buildings and Monuments, 2006, 12 (4), pp.299-316. �10.1515/rbm-2006-6066�.
�hal-01006004�
Coupling between Progressive Damage, Temperature and Permeability
of Concrete: Experimental and Numerical Study
A. Khelidj1 , M. Choinska2, G. Chatzigeorgiou3 and G. Pijaudier-Cabot2
1R&DO, Institut de Recherche en Genie Civil et Mecanique, Universite de Nantes, Saint-Nazaire, France 2Ecole Centrale de Nantes, Nantes cedex 3, France.
3 Aristotle University ofThessaloniki, Dept. of Civil Engineering, Division of Structures, Thessaloniki, Greece
Abstract
A synthesis of work carried out for several years within our laboratory is presented. The first part includes an experimental study. The tests are performed on hollow cylindrical concrete specimens, subjected to com-pressive loading. At stress levels lower than 80 % of the peak stress, the variation of permeability is small and it is slightly influenced by the stress, but as the load exceeds 80 % of the peak stress, micro-cracking increases rapidly, causing an increase of the permeability and a greater sensitivity to the applied load. In the post-peak phase the increase of permeability is much larger due to significant crack width growth. The effects of the applied load on permeability are greater with temperature. Finally, the experimental results seem to agree with the format of coupled evolution of the permeability due to damage and temperature assumed by Gawin et al. [ 1 0].
The second part of this paper includes a numerical study. The lattice mechanics model is extended to the hydraulic problem and, for this case, it appears that permeability is the size independent variable. Addition-ally, the evolution of permeability with damage and with stress ratio in the pre-peak phase is compared with experimental results on different types of concrete.
1
Introduction
Transport properties of concrete, like pem1eability or diffusivity, influence the durability of the con-crete structures by controlling the penetration rate of aggressive agents, but also directly if the struc-ture has a tightness role, like nuclear waste storage structures or confinement vessels of nuclear power plants for instance. These structures, during their service life, are subjected to difterent types of loads (mechanical, thermal, chemical, restrained shrinkage, aging etc ... ). Generally, service loads are not significant enough to cause an important degradation of structural concrete. However, with time, the degradation accumulates and may lead to micro-cracking resulting in permeability varia-tions. This contribution aims directly at such con-finement structures for which it is critical to evalu-ate their gas tightness and its evolution with time, both in the case where concrete remains in the pre-peak regime (typically in the nom1al service life) and also when it might reach locally the post-peak regime, e.g. during integrity tests or accidents, where an increase of temperature is also expected (from 20 °( up to 150
oc
in the class of integrity tests considered in this paper).The evolution of the permeability of concrete may be regarded, on one hand, as a function of diffuse micro-cracking in the material (related to damage), and on the other hand as a function of the width, connectivity and tortuosity of newly created flow channels. Relationships between permeability and diffuse damage (micro-cracking) have been derived theoretically. Dormieux and Kondo [I] used homogenisation techniques and similar results are obtained on discrete (lattice) models [2], as it is shown in the second part of this study. Therefore, in the post-peak regime, when a macro-crack has fom1ed in the structure, permeability is governed by Poiseuille tlow, crack tortuosity and crack open-ing (sec, e.g. Ref. [3]).
Some experimental results on the interaction between permeability and load induced micro-cracks in uniaxial compressive tests are available in the pre-peak regime. A study of Sug-yiama et al. [ 4] on the effect of a compressive stress on penneability of concrete has shown that the increase of permeabi I ity becomes significant when the stress level reaches 75-90 %, of the ultimate strength for nonnal-weight and light-weight con-cretes. Hearn and Lok [5] observed an impor1ant increase of air permeability with load induced micro-cracks, occurring at the critical stress level of
70 % of the ultimate axial compressive strength, and corresponding to the development, and then the interconnection of cracks in the mortar matrix. A studv of the residual transport properties of
con-cret~.
carried out by Picandet et al. [ 6], has shownthat gas permeability increases exponentially with the axial compressive damage (relative stitlness loss) in the pre-peak phase. Therefore, in the post-peak regime, \Vhen a macro-crack has formed in the structure, Brazilian splitting tests, have emphasized a conelation between the water perme-ability and the crack width as shown in [7].
Modifications of the concrete porosity, which may take place in the range of considered temperatures (from 20 up to 150 ~c) are multiple. Among the most important results, the following can be men-tioned: modification in moist content due to free water evaporation (up to I 05 °C), chemical dehy-dration of cement paste due to loss of bounded water (beyond I 05 °(), thermal expansion, poros-ity increase, thermal cracking due to thermal and mechanical incompatibility, etc. A considerable increase of gas or water penneability, if measured under temperature or after thennal treatment, has been observed experimentally. Lion et al. [8] f()und that a thermal treatment of a mor1ar leads to an increase of residual porosity and gas permeability, being sevenfold its initial value (measured at 25 "C) after a treatment at 250
oc.
The tests performed by Joos and Reinhardt [9] emphasized an increase of water pern1eability of I 0-14 % between 20oc
and 50 °(, and of7-ll% between 50oc
and 80oe,
almost the amount of what could be predicted according to theoretical considerations based on them10dynarnics [9]. According to Gawin et al. [I 0] a power relationship between temperature and concrete penneability should be considered. Existing experimental data provide some conela-tion betvveen the material mechanical degradaconela-tion (micro-cracking and macro-cracking) and the per-meability of concrete. The same exists for the influ-ence of temperature on permeability of concrete but very little data is available on the coupled tempera-ture and load efTects on the permeability of con-crete. At the same time, theoretical results or phe-nomenological fonnulas exist in both cases but then again, the interaction between the applied load and the temperature on the material permeability lacks experimental validation. Therefore, the objective of this paper is to provide experimental data from \vhich such validations can be carried out. Because of the specific application aimed at this study,
maintenance of nuclear confinement vessels and service life evaluation, we need to consider at the same time variations of permeability due to moder-ate damage (homogenously diffused microcracks developing in the pre-peak phase) and localized one (macrocrack(s) localizing and propagating in the post-peak phase).
In the first part of the current paper the experimen-tal device and the testing procedure are first pre-sented. Then, the results of the experimental study are shown and discussed.
The second part includes a numerical study. We suppose that concrete is a disordered materiaL which we can simulate with the help of a simple discrete lattice model. In the previous study it has been shown that the evolution of Young modulus is a variable which tends to be independent from the size of the lattice until the peak load. In this paper we extend the model for the hydraulic problem and, for this case, we can see that permeability is the size independent variable. Finally, the evolution of per-meability with damage and with stress ratio in the pre-peak phase is compared with experimental results on ditlerent types of concrete.
35
30
V:15
V: :.;t:
I 0
:r:0
0,0%
0,2%
2
Experimental Program
2.1 Concrete Composition and Speci-men Curing
An ordinary concrete of water to cement ratio equal to 0.6 with maximum aggregate size of 16 mm is used. The cylindrical (110x220 mm2 )
hollow specimens have been cast in metal moulds. A cylindrical borehole was cast in each specimen by placing a metallic bar (diameter of 14 mm) in the moulds. All the specimens have been subjected to the same curing and conditioning processes. They were stored in water during 28 days and dried in a ventilated oven initially at 80
ac
(28 days), then at 105oc
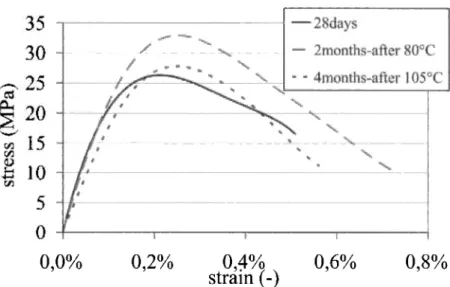
down to constant mass. The dry state has been also maintained during the per-meability tests whenever possible using the cli-matic chamber.The average mechanical response of concrete in uniaxial compression is shown on Figure 1: after the storage in water (at 28 days), after drying at 80° C (at
2
months) and 105oc
(at 4 months). Aver-age mechanical properties are provided in Table 1.0,4%)
strain (-)
Figure 1: Stress-axial strain curves of tested concrete (at ambient temperature)
Table 1: Mechanical properties of the concrete
I 28 days (wet cure) 4 months (after drying)
Modulus of elasticity (GPa) I 23 16
·----~----Peak stress (MPa)
I
26 28
Axial peak strain (-) I
2,2.10'03 2,6.1
o-
032.2 Application of Requested Thermal and Mechanical Loading
A specimen, placed in a climatic chamber. is loaded in a simple compression test. The climatic chamber generates and controls temperature and relative humidity. Three levels of temperatures are used: 20
oc.
105oc
and 150oc.
In this study rela-tive humidity is maintained close to 0% in order to keep material dry . However, the tests on different saturation levels can be carried out with this device. The compression tests are perfom1ed with a hydraulic loading frame MTS 500 kN under dis-placement control. The specimen is placed between two metal platens designed to apply the compressive force and to enable at the same time the injection of the percolating tluid. The axial contraction of a specimen is monitored by three linear variable displacement transducers ( LVDT) placed on the circumference of the specimen. The axial contraction of the specimen is monitored by three linear variable displacement transducers (LVDT) placed on the circumference of the speci-men.2.3 Gas Permeability Measurements
Presented permeability tests are pert"lxmed within the framework of the steady state gas tlow in iso-then11al conditions. The principle of gas permea-bility measurement during loading is given on the simplified diagram on Figure 2.
Inert gas (nitrogen), with respect to concrete, is injected into the cylindrical bore hole through the perforated bottom platen. Due to the tightness of the two faces of a hollow cylindrical specimen, the obtained gas tlmv is radial. A relative pressure Pi-P atm (difference between applied absolute pres-sure and atmospheric prespres-sure) is applied and main-tained till the gas tlow stabilization through the specimen. Pressure values and flow rates are
meas-a)
PRESSURE MEASUREMENT
Pi-P.tm
INJECTION
GAS FLOW RATE
INJECTION MEASUREMENT
Qi
Figure 2: a) Simplified diagram of the experimental device
ured at the upstream of the specimen. The t1ow equation and mass balance equation lead to the determination of a gas permeability coefficient k3 rm2]. The permeability coefticient, called
subse-quently permeability, is calculated from equation
(1 ), which corresponds to the Hagen-Poiseui lie's law adapted for gas laminar !low through a porous body. When the injection tlmv rate Qi [ m3 /s] is
known, the permeability k3 [m2] can be calculated:
(I )
where
Pi [Pa] is the applied absolute pressure at the upstream, Pat m [Pa] is the atmospheric pressure at the downstream, ~t [Pa.s] is the dynamic viscosity of gas (nitrogen); r1 [m], r2 [m], H [m] are the inner
and outer radius and the height of the cylindrical specimen respectively.
This permeability is relative to the overall gas flow through the materiaL consisting of the viscous tlow and the slip tlow (Knudsen effect). The slip !low appears when the average diameter of the capillar-ies crossed by gas is of the size of the mean free path of the gas molecules (average distance between collisions).
During mass transport through concrete. the contri-bution of slip flow in the overall gas t1ow may be very significant. Hence the pem1eability, deter-mined for ditTerent gas pressures. depends (among other factors due to the microstructure of the mate-rial) on the pressure and the temperature, factors which influence the mean free path, which is inversely proportional to the pressure. The permea-bility ka is apparent. In order to get an intrinsic
per-b)
H
=::::::0
nm1
A-A~-,~'nun
meability, a characteristic of the porous medium solely and being strictly relative to the viscous flow, Klinkenberg or Carman approach may be applied. In this study the relationship due to Klinkenberg [11], presented in equation (2), is used:
11
k
=k.(l+-'-)
(2)
m
\V here
Pm [Pa] corresponds to the average gas pressure,
p
=
~ +~lltlland~ [Pa] is the Klinkenberg coefficient, a constant \vhich is inversely proportional to the average diameter of the capillaries. The intrinsic permeabil-ity k1• [m2] is obtained by extrapolating the apparent
gas permeability ka determined at various pressures to the case of an infinite pressure.
2.4 Experimental Procedure
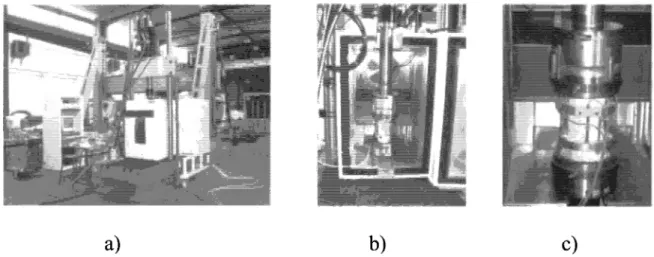
Prior to the test a specimen is removed from the drying oven and is left in a desiccator placed in a air-conditioned room (20 °C) for 48 hours. After this period, a specimen instrumented with the dis-placement transducers (LVDT) and positioned in the permeability cell between the platens of the hydraulic press. This setup is then enclosed in the climatic chamber (Figure 3 ).
During the tests, the measurements of the apparent permeability are pertonned for five relative pres-sures: 0.3, 0.25, 0.20, 0.15, and 0.10 MPa. After-\Vards, the intrinsic permeability is determined
a)
according to the Klinkenberg relationship (2). The upstream mass flO\v rate is given by one of the three digital thermal Mass FIO\v Meters (MFM) of ranges: I 0-500 mllmin, 20-1000 ml/min, and 300-15000 ml!min respectively. A period of 2 to 5 minutes approximately, is necessary in order to reach the steady state gas flO\v. During the test, the applied force, the stroke displacement, the dis-placements measured from the LVDTs, the gas pressure and mass llO\v rate through the specimen are recorded. The accuracy of measurement of the apparent permeability is 2 % approximately. The full testing procedure is as t(1]]0\v:
• First, a measurement of the initial permeabil-ity of concrete is performed at 20
oe,
with an axial compressive load of 4 kN, resulting in the compressive stress of 0.4 MPa (negligible stress tor this concrete). This load ensures the fitting between the specimen and the load platens. It is needed tor ensuring the tightness of the permeability cell (radial f!O\v only). • Then, the required temperature is applied(20
oe,
I 05oc
or !50 °C). During heating at a constant rate of 5 °C/h, the compressive load of 4 kN is kept. A stabilization period of tem-perature through the material is needed, thus permeability tests start after 60 hours, under a constant temperature. Prior to that, the ref'er-ence permeability is measured again in order to obtain the effect of the temperature.• Aftenvards. the specimen is loaded \Vith a displacement rate of 0.02 mm/mn up to the required load level. Load levels correspond to 20, 40, 60, 80 and 90% of the estimated peak stress in the pre-peak regime, \Vhile close to
b)
c)
T = 20
oc
(I
a)
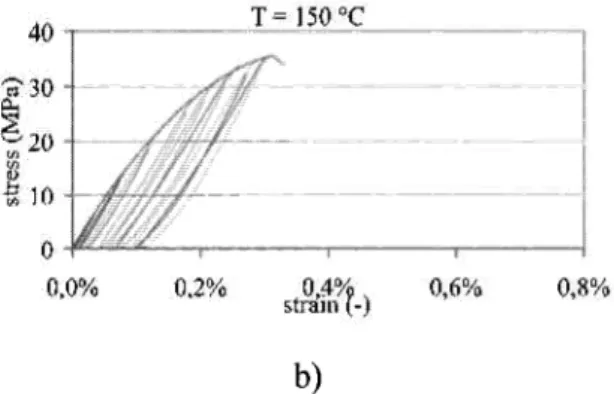
Figure 4: a) Typical stress-strain relation at 20
oc
the peak and in the post-peak phase each load level corresponds to an increase of axial strain of 0.3 mm/m. Each load level is main-tained during 30 minutes in order to allow for the determination of the gas permeability. For each load leveL once the permeability under load (loading permeability) is measured. the specimen is unloaded down to 4 kN and the permeability of the unloaded specimen is measured (unloading permeability).
Time dependent etTects (creep or relaxation) are not significant during the pre-peak phase. Nevertheless. close to the peak and beyond. the flow rate measure-ments are affected by load relaxation. In this case. the time needed to reach a steady state flow rate raises and corresponds to the stabilization of cracks propagation for the imposed displacement. which is kept constant. All the results presented below refer to the values of pem1eability obtained with a mini-mum of three tests per temperature.
3
Results and Discussion
The initial permeability of the concrete tested (pre-pared with three batches) vary between 6.10 -17 m2
and 12.10 -17 m2 . This variation according to
cast-ing is thus relatively small and illustrates the good reproducibility of the test results. Besides, the ini-tial permeability is overestimated due to the dry-ing-shrinkage cracking [ 12]. increasing the gas permeability. The main intention of a study is. although. to examine permeability evolution as a function of mechanically induced cracking and temperature. so that the initial permeability values remain only a referential state.
Experimental results obtained on tested concrete revealed a consistent temperature dependent behav-iour, getting more and more brittle with
tempera-I)
r- 15n
c
b)
'· \· i-1
b) Typical stress-strain relation at 150
oc
ture and tending to brittle fracture.The typical stress-strain responses recorded during the tests carried out at 20
oc
and 150oc
are presented in Figure 4. Unfortunately. the brittle behaviour at 150oc
restricts permeability measurements in the post-peak phase.3.1 Permeability under Loading and after Unloading
The results presented in Figure 5 show the permea-bility measured under applied load and after unloading for difterent maximum applied stress levels at 20
oc
and 150oc
(only 2 tests per tem-perature are presented for the sake of clarity of the plots). An average relative ditTerence between per-meability measured under applied load and after unloading of 5 % at 20oc.
of 6 '~io at I 05oc
and of18 % at 150
oc
is observed. It can be noticed that for low and intermediate maximum applied stress levels. the permeability measured after unloading is slightly greater than during loading. For high maximum applied stress levels. beyond a threshold corresponding to 80 % of the peak stress at 20oe,
and close to 90 % at I 05oc
and 150oe,
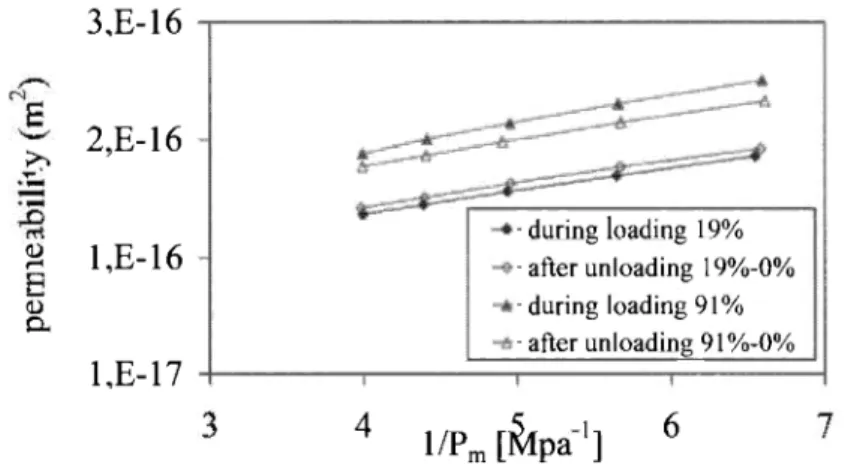
the inverse trend is observed.This effect is remarkable not only on the intrinsic permeability (calculated from Klinkenberg rela-tionship). but also on the apparent pem1eability (Figure 6). Apparent permeabilities. measured dur-ing loaddur-ing for a moderate stress level ( 19% of the peak stress) at any average pressure of gas inJeC-tion, are lower than after unloading; while for a sig-nificant stress level (91 %of the peak stress) the result is opposite.
LSE-16 'E ~UE-16 ~S,OE-17 J,OE-17 T ~ 20
oc
0.2 OA 016 0,8 1,0maximum applieu stress' peak stress
a) -lt.:~\1 Jur111!:' lll:idin~ - l C'.li Jttcr unldaJillg - -r l:'c-,tl Jur1n12 illadtn~ - ll:':-.!2 Jth·r unlo;Jdtng AE-16 dur111~ E ,IE-16-~ S.OE-17
.-&"')
durllll! unloaJmg: S,OE-17 0, 15 OAO 0,65 0, 90maximum applied stress I peak stress
b)
Figure 5: Loading and unloading intrinsic permeability vs maximum applied relative stress at a) 20
oc
b) 150 °C.3,E-16
>:.2,E-16
·-(!)1 ,E-16
,... ,_ -during loading 19% -after unloading 1 lJ%-0% (!) 0. -during loading 91% -after unloading 91°0-0°/,LE-17
.,
-'
4
6
Figure 6: Effects of loading and unloading and of the mean gas pressure on the apparent permeability values (typical result, at 20 °C).
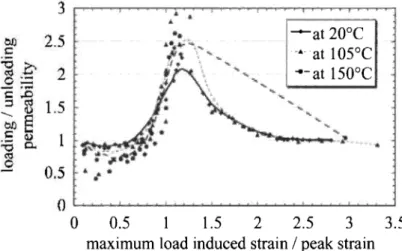
The ratio of loading to unloading permeabilities varies with the applied stress level and temperature. In the strain space (longitudinal strain), it may be represented by a function which is negative in the early pre-peak phase, reaches a maximum in early post-peak phase for a relative strain equal to I. 1-1.2 (maximum load induced strain to peak strain), and tends to become a constant further in the post peak regime (the two penneabilities are equal). This relation is plotted in Figure 7 for the three tested temperatures.
Low compressive stress levels act on the initial porosity by squeezing it (volume contraction), which yields a decrease of permeability. In this phase, unloading generates the opposite effect and thus the permeability increases (the behaviour is reversible). Till approximately 60-70 ~/o of the peak stress at 20
cc
and till 70-75 % of the peak stress at I 05oc
and !50 ''C the permeability measured after unloading remains quasi-constant, while theper-meability measured during loading slightly decreases (Figure 5). Possible micro-crack forma-tion is compensated by the closure of existing pores and the resulting effect on the permeability is a slight decrease. lipon unloading, cracks induced by the applied load may close while existing pores or cracks open again, with an increase of the permea-bility. Beyond these stress levels, permeability measured during loading exceeds the values revealed after unloading. The amount of micro-crack formed is enough in order to compen-sate effect of closure of the initial microstructure. Consequently, the permeability measured during loading reaches greater values than after unloading.
3.2 Pre-Peak Phase
3.2.1 Permeability Variation under
Mechani-cal Loading
In the pre-peak phase, for each temperature ( 20, 105, 150°C), the characteristic phases of relative
"'
1 :OJ; "5 --at 20°C c.
at 105°C -! ...,_at 150°C"
() 0 0.5 1.52
2"5 3 3.5maximum load induced strain I peak strain
Figure 7: Loading to unloading intrinsic permeability ratio vs applied relative strain
Relative permeability slight
decrease, then slight increase
Relative perm ea bilrty
significant in ere a se
1 6
1.5
14
3
1.2
1 1
0 9
·at T=20°C
at T=1 05°C
at T=150°C
I]1
02
0"3
04
05
0"6
0"7
0"8
09
maximum apphed stress/ peak stress
Figure 8: Variation of intrinsic permeability values with loading for tested temperatures
permeability evolution (permeability at temperature of20, 105 or 150
oc
over the reference permeability at temperature of 20, 105 or 150oe,
respectively) can be distinguished. as it is shown in Figure 8. Here, results consider the intrinsic permeability measured during loading only.Under the action oflow and intermediate load leveL corresponding to 40-60 % of the peak stress. the permeability tends to decrease slightly. Beyond this load level the permeability increases. first very slightly, then significantly. with the most important rate for the test carried out at 150
oc.
The relative permeability evolution during loading. joining up with previously presented results, is
related to volumetric behavior of concrete under uniaxial compression. Therefore. it can be consid-ered. that the slight decrease of the permeability for low load levels (Figure 8) is due to contracting vol-umetric behavior under uniaxial compression. However, at 68-7 4 %1 of the peak stress. the perme-ability regains its initial value, before more impor-tant increase. Therefore, when volumetric behavior becomes definitely dilating, the permeability increases first slightly, due to the development of homogenously diffused microcracks through the cement paste, then significantly due to the microc-racks coalescence (from 80 ~~0 of the peak stress, corresponding to the transition in volumetric
1.3
1.2 1.1."\
0 20 40 60 80 100 120 140 160
Temperature CC)
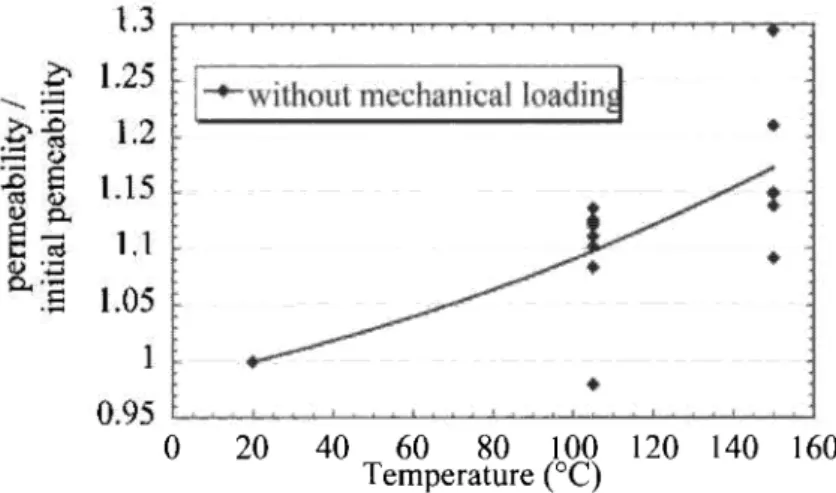
Figure 9: Variation of intrinsic permeability under temperature. Measures carried out under thermal loading.
behaviour [ 4]). Therefore. for the three tested tem-peratures. at stress levels lower than 80 % of the peak stress. the permeability variation IS insignifi-cant but as the load exceeds 80% of the peak stress and approaches the peak stress. the damage increases rapidly causing a significant change in the permeability. This change seems to be greater with the increase of temperature. It can be explained by the fact that more brittle concrete with temperature (or with other parameter) is. more the cracks will localize. and thus the rate of permeability evolution will be greater.
3.2.2 Permeability Variation under
Temperature
An increase of the relative permeability with tem-perature is observed in Figure 9 (permeability measured at 20
oc
I 05oc
or !50oc
over the ini-tial permeability measured at 20 °C).Several reasons for the slight increase of permeabi-lity with temperature might be considered. Between 20
cc
and 150-200oC
thermal expansion or the cement paste and aggregates takes place [8]. Because the thermal expansion coefficients are dif-ferent for each constituent of concrete, micro-cracks should appear at the cement paste-aggregate interface. Beyond 150-200oc
the expansion of the aggregates is limited by the shrin-kage of the cement paste, what results in cracking through the latter. In this range of temperatures the cement paste shrinks due to dehydration. There-fore. chemical bonds, forming the CSH gel, start to break down. Hydrated products transform into anhydrous product and free water evaporates during further heating and creates new channelsaccessible for the gas t1ow. Furthermore. porosity and pores distribution change. due to the exposure to h1gh temperatures, has already been emphasized by experimental evidences. as reported in [ 13]. In our study. the increase of relative permeability observed at I 05
oc
compared to 20oc
cannot be related to thermal micro-cracking. This tempera-ture has already been experienced by all the speCI-mens dunng drymg. Since moisture effects cannot occur. one remaining cause IS the widenmg of poresthrough relative thermal expansion of the (hetero-geneous) material. In order to verify this assump-tion. the microstructure of the material needs to be scrutinised. One useful indication, serving as a first step in such a study, is the analysis of the variation of the Klinkenberg coefficient ~1 [Pa]. It is inversely proportional to the average diameter of the pores and thus it may be considered as an indicator of the fineness of the porosity in the material. A decrease on1 of I 0% is observed between 20
oc
and I 05oc.
This decrease is related to the increase in the pore size, which takes place due to the thermal expan-sion of the porous material. Consequently. the intrinsic permeability increases most probably due to the pores widening between 20oc
and I 05oc.
The increase of permeability at !50 °C compared to the two other levels of temperature has to be like-wise related to pores widening. However, a decrease of ~1 has not been observed in the tests; on the contrary, an increase (of 30 %) of0
has been computed. It means that the contribution of very tine pores. created by the thermal treatment at 150oc
is relatively more important than pores widening at this temperature.1.2
• for damage of 0.05• for damage of 0.07
•
1.15
• for damage of 0.10.
• for damage of 0.12
1.1
I
" without mechanical loading.
~:
1.05
~
0.95
L_
...
~
...
~~J
0
20
40
60
80
100 120 140 160
temperature (0C)
a)
lO•
•
1-at
20 °C, 105
oc
and150
ocl
0.1
l)
0.05
0. ldamage
b)
0.15
0.2
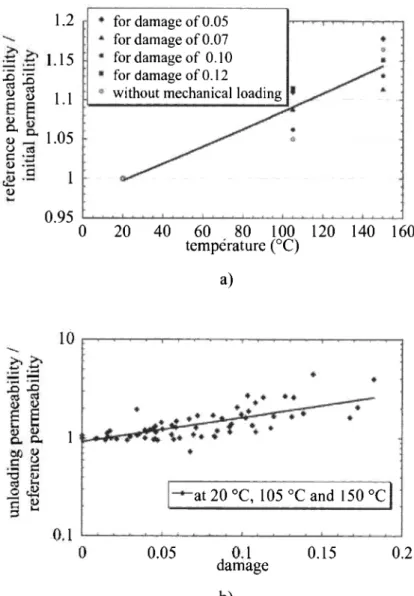
Figure 10: a) Variation of relative intrinsic permeability with temperature for the damage levels b) Variation of relative intrinsic unloading permeability with damage for the three tested temperatures.
3.2.3 Permeability Variation with Damage and Temperature - Interaction
Law
Apart from the separate effect of the mechanical load and temperature on the permeability, some information can be obtained as far as the coupled effect of load and temperature on permeability is concerned:
First, the effect of the temperature on the permeabi-lity has been measured with applied mechanical load. This is shown in Figure I 0 a) for some damage levels. Effectively. the evolution of the per-meability with the temperature is almost the same for any damage considered.
Following the analysis by Picandet et al. [6], it is more consistent, in the pre-peak phase to record the evolution of the permeability with damage instead
of the strain or stress. In order to analyse the effect of the applied load on permeability we follow here the same procedure and compute damage from the variation of the unloading stiffness recorded on the mechanical response of the specimen. The result is shown in Figure 10 b). On this plot, we have the permeability evaluated after unloading as a func-tion of damage d defined as
i
£,, - £unloading( =
E
qwhere Eo is the initial Young's modulus of the material and £unloading is the unloading modulus. Same as in [6], the plot exhibits some dispersion due to the evaluation of the unloading slopes. Still, the agreement for all the temperatures seems
cor-rect. One may say that the evolution of the permea-bility due to the applied load for the three tempera-tures tested [llls on the same master curve. Note that we have considered in this figure the pem1ea-bility measured after unloading instead of the per-meability measured under load. since it is expected that on top of the first one, some load effect could be accounted for, or possibly neglected in the pre-peak regime (for conservative safety reasons, the decrease of permeability may be neglected). Therefore, one may possibly say that the overall evolution of the permeability follows a multiplica-tive format:
k-=- [(damage)· g(temperature)
The increase of permeability due to temperature and damage is the product of two functions ({and g)
which reflect each contribution separately. Our experimental results are also consistent with the formula proposed by Gawin and eo-workers [I 0].
3.3 Peak and Post-Peak Phases
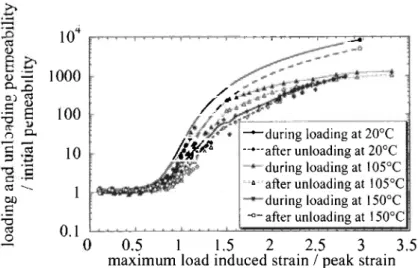
The results presented in Figure 11 show the com-plete evolution of the relative permeability during loading and after unloading with the maximum applied relative strain for the three tested tempera-tures. It turns out that at the peak (relative strain equal to I). permeability tends to tenfold initial value, if measured during loading at elevated
tem-'U (lj 10"' 1000 100 10 0.1
peratures (I 05
oc
and !50 °C), and up to fivefold, if measured at 20oc.
Therefore, up to the peak, relative permeability change is quite temperate in comparison with the behavior in post-peak phase. where the change becomes tremendous (several orders of magnitude) due to significant cracks width increase. Consequently, the fluid flow through damaged concrete is controlled by the opening and connectivity of cracks.However, it is still observed that permeability rate increases with temperature. At 105 °C, though this temperature was submitted by the concrete during drying, the change in permeability is greater, than at 20
oc.
For the tests carried out at 150oe,
due to high brittleness of concrete at this temperature, per-meability could not been measured in the post-peak phase. Some experimental results, presented in Figure 11 for 150oe,
correspond to pem1eability measured at failure. Moreover, it comes into light that permeability varies with different kinetics in function of temperature in the strain space. Beyond relative strain equal to I. two regimes of permeabil-ity variation are manifested for all tested tempera-tures: the first one (up to 1.5 of relative strain), where permeability increases rapidly and the second one. which is characterized by a steady and less rapid rate. Indeed. flow localization, following damage localization. should hither occur. These observations are in qualitative agreement with the results obtained by Wang et al. [7].-+-during loading at 20°C ·-•-- after unloading at 20°C
during loading at I
osuc
• atler unloading at I 05°C during loading attsooc
"""-after unloading attsooc
0
0 0.5 I 1.5 2 2.5 3 3.5
maximum load induced strain I peak strain
Figure 11: Variation of relative intrinsic permeability with maximum applied relative strain for the three tested tempera-tures. Measurements carried out at temperature, during loading and after unloading
12: I
4
Numerical Study
Aim of this study is to examine the relation between the mechanical damage and the permea-bility of concrete. Assuming that concrete is a dis-ordered materiaL \Ve can simulate it \Vith the help of a simple, stitTness controlled. discrete lattice model. The model \Vas used [ 14] in the past for the study of the failure mechanism of quasi-brittle materials. In the lattice. the mechanical problem is substituted by an electrical analogous. simplifying with this vvay the analysis. by transforming it from vectorial to scalar.
As De i\rcangelis et al. [ 15] have shmvn. this sim-plification is able to capture the most important physical aspects of the problem. In this electrical analogous. the strain is substituted by the voltage difference. the stress by the current and the Young Modulus by the conductance. As it is depicted in Figure 12. the model is a regular t\vo-dimensional lattice \Vhose bonds are one-dimensional.
The boundary conditions of the model are periodic. in order to attain the creation of an infinite system and the partly avoidance of the boundary effects. They represent a homogeneous loading in the verti-cal direction: Periodicity is imposed along the boundaries parallel to vertical axis and a constant jump in voltage is applied along the two horizontal boundaries. Every bond of the lattice behaves as a brittle material with a conductance equal to I.
\V hen the current of a bond reaches a threshold cur-rent the bond fails. This threshold differs from bond to bond. follmving a uniform random distribu-tion between 0 and I. With this \Vay. \Ve ensure the disorder of the model and. consequently, the heter-ogeneity of the material.
The calculation process starts by assigning a thresh-old current to every bond \Vith the help of a random generator number [ !6]. At each step. the algorithm computes the voltage at each node from Kirchhoff's law. The equations form a symmetric band matrix which can be solved using Cholesky factorization. From Ohm's law. the current of each bond is obtained. The bond \Vhich tails first is the one with the minimum ratio of its strength (threshold current) to its current. This bond is removed from the lattice. by changing its conductance from I to 0. Because the analysis is linear. it is also possible to compute the overall load at \Vhich this bond fails and the process continues with the next step of loading. where \Ve seek for the next bond \Vhich fails. The lattice does not represent a real material. In ['let \Ve are interested in its scaling properties: as the lattice size tends to infinity. its response tends to a thermodynamic limit \Vhich is the response of a single point in a continuum approach. I Ience, we shall look at the variables that are capable of describing the evolution of the lattice response with bond failure. independently from its size. For the characterization of the distribution oflocal stresses. we introduce the concept of moments, which are given by the expression:
N
l.f
Ill =f·lll \'( ')
I i ' I ( Ii'
where i is the current of each bond, N(i) is the number of bonds whose current is in the range of[i. i+di]. and m is the order of moment. The most important moments arc these of order up to 4. because of their physical meaning: moments of order 0 represent the number of unbroken bonds in the lattice, moments of order I the awrage stress.
Figure 13: Mechanical and hydraulic lattices
moments of order
2
the average Young Modulus and moments oforder4 the dispersion of the Young Modulus.As each lattice has a unique distribution of bond thresholds. several computations with ditlerent ran-dom seeds (following a uniform distribution) and ditTerent lattice sizes must be performed. With this way we obtain a representative statistical treatment of the results. which provide us useful conclusions about the average behaviour of the lattice.
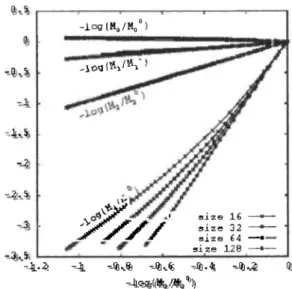
Summarizing the major results of the mechanical analysis. we recall that the average of the Young modulus, and not the number of broken bonds, is a lattice size independent parameter, i.e .. the continu-ous variable which captures, in a continuum sense. the evolution of damage. Moreover, the post-peak area seems to be strongly lattice-size dependent, a fact that was expected from experimental evi-dences. For the hydraulic problem. we use the lat-tice analysis in order to investigate the relation between the permeability and the cracking mecha-nism. More details about this study can be found in Chatzigeorgiou et al.[2]. In this analysis. we use a lattice perpendicular to the mechanical one (figure 13), and solve for the hydraulic problem. assuming that. when a bond fails in the mechanical problem. the bond that is perpendicular in the hydraulic problem increases its penneability from I to a large value K. Now, the physical meaning of the moments is di tTerent: moments of order 0 repre-sent the number of unbroken bonds. moments of order I the average tlow rate. moments of order 2 the average permeability and moments of order 4 are a measure of the dispersion of the permeability. From the corresponding moment distributions in the hydraulic problem we find that, the variable that
J . ~ ze 1 ze ~ :3_1 1~ -lJ...2~ -l.!.. -_QJ •• % -_QJ •• G -Q:,.4; --1)) •. ~ Q: -_Jj(?:(:!,(,ljl!;,/lll!, "'!)
Figure 14: Hydraulic moments vs. M2 until peak load
.
'
_.,
n.cs '.1 .1 • :.
-log (M2rn/M2rno!
Figure 15: Hydraulic moments vs. M2m until peak load
is independent of the lattice size is the average per-meability (Figure 14 ).
We also observe that the average Young Modulus (M2m in figure 15) is able to describe the hydraulic
problem independently of the lattice size. This sug-gests that in a continuum model, the permeability should increase with damage.
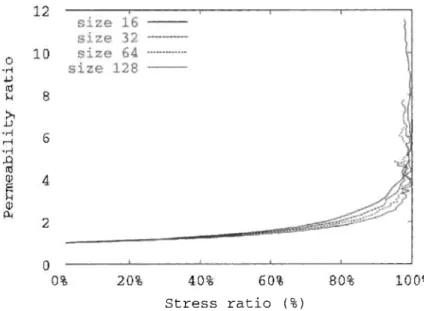
From Figure 16, we see that the average permeabi-lity of lattice increases rapidly. as the loading approaches the maximum stress. This is in agree-ment with what Sugiyama et al. [ 4] have observed.
Figure 17 shows the evolution of the pemwability
(mechani-. )
Stress ratio ( 9o)
Figure 16: Permeability vs. stress ratio
"·
Figure 17: Permeability vs. mechanical damage
ea! damage) in the mechanical lattice. We observe that for stiffness variations between 0 and 0.2, the plots collapse onto the same curve. Picandet et al. [6] have shown that the permeability versus mecha-nical damage curve is the same for three different types of concretes. So the lattice analysis seems to agree with the experimental observations, which show that there must be an intrinsic relationship between the permeability and the evolution of the material stiffness.
-E) / E1
5
Conclusions and Perspectives
The results reported in the first part of this paper can be summarised as follow:
• In the pre-peak phase, at stress levels lower than 80 ~io of the peak stress (i.e. common stress levels in a real structure). the variation of permeability is small and it is slightly influenced by the stress. As a matter of fact. the permeability under load is smaller than the permeability measured after unloading.
• As the load exceeds 80 % of the peak stress (i.e. exceptional stress levels in a real stmc-turc), micro-cracking increases rapidly, caus-ing an increase of the permeability and a greater sensitivity to the applied load, i.e. a noticeable dit1ercncc between the pen1leabil-ity measured under load and after unloading, the first becoming greater than the latter. • In the post-peak phase an important grmvth of
pem1eability takes place due to the crack widths growth under compressive loading. The change of pen11eability seems to be greater with the increase of temperature. • The permeability increases with the
tempera-ture. At I 05
oc
(temperature already experi-enced by the material previously) it is due to the pore widening due to then11al expansion of concrete porous material. At !50oe,
where the increase is much more important, it is due to pore vvidening and temperature induced micro-cracking.Finally, the experimental results seem to agree with the fon11at of coupled evolution of the per-meability due to damage and temperature:
k
=f(damage) · g(tcmperaturc)
assumed by Gawin et al. [8]. Obviously, this is not a general proof that the above relationship should hold for any temperature or damage. but experi-mental data are not in contradiction with it. Further studies with a wider range of temperature are needed in order to judge the validity of this assumption in a more general context.
The hydro-mechanical problem is also analysed by construction of a sister lattice to the mechanical one. When a bond breaks in the mechanical lattice, it increases the permeability of a bond in the hydraulic lattice that is perpendicular to the first one. The analysis of the lattice results follows the technique implemented in the mechanical problem. The various moments of the tlow rate distribution are computed and we look for the variable that describes the evolution of these moments inde-pendently from the size of the lattice. If such a quantity is found. it is the quantity that describes the evolution of the t1ow rate distribution with material degradation.
The penneability of the lattice increases progres-sively with the increase of material degradation. The average permeability constructs lattice
size-independent relations with the hydraulic
moments of order up to 4. for a moderate material degradation, before the peak load is reached. Finally, the combination of the mechanical and hydraulic analyses was examined. The compliance versus hydraulic moment curves are lattice size independent and consequently the plot of the per-meability versus the evolution of damage exhibits the same property. It indicates that in continuum poro-mechanics. the material permeability should be related to the degradation of stillness (damage). This is consistent with the experimental data pre-sented in this paper.
Acknowledgement
Financial supports from the network on Degrada-tion and Instabilities in Geomaterials with Appli-cation to Hazards Mitigation (DIGA). contract HPRN-CT-2002-00220 with the European Com-mission, and from EDF to the R&DO group arc gratefully acknow !edged.
References
I. 3. 4. 5. 6. 7L. Dormieux and D. Kondo, Approche micromecanique du couplage permeabil-ite-endommagement, C. R. Mecanique 332
(2004) 135-140 (in french).
G. Chatzigeorgiou. V. Picandet, A. Khelidj, G.Pijaudier-Cabot. Coupling between pro-gressive damage and permeability of con-crete: analysis vvith a discrete modeL Int. J. Anal. Meth. Geomech. 29 (2005)
1005-1018.
F.A.L. Dullien. Porous Media. Fluid Trans-port and Pore Structure, Academic Press ( 1979).
T. Sugiyama, T. W. Bremner. TA. Holm. Eftect of Stress on Gas Permeability in Con-crete. ACI Materials Journal 93 ( 1996) 443-450.
N. Hcarn and G. Lok, Measurement of Per-meability under Uniaxial Compression-A Test Method, ACI Materials Journal 95 ( 1998) 691-694.
V Picandet. A. Khelidj, G Bastian, EtTect nf axial compressive damage on gas permeabil-ity of ordinary and high-perfon11ance con-crete. Cement and Concrete Research 31 (2001) 1525-1532.
K. \Vang. D.C. Janscn. S.P. Shah. A.r. Kan. Pem1eahility stuciy of crackcci
con-crete, Cement and Concrete Research 27 (1997) 381-393.
8. M. Lion, F. Skoczylas, Z. Latl1aj, M. Sersar, Experimental study on a mortar. Tempera-ture etTects on porosity and permeability. Residual properties or direct measurements under temperature, Cement and Concrete Research (2005), in press.
9. M. Joos and H.W. Reinhardt, Permeability and diffusivity of concrete as function of temperature. Cement and Concrete Research 32 (2002) 197-1504.
10. D. Gawin, F. Pesavento. B.A. Schrefler. Modelling of hygro-them1al behaviour of concrete at high temperature with themw-chemical and mechanical material degradation. Comput. Methods Appl. Mech. I::ngrg. 192 (2003) 1731-1771.
11. L.J. Klinkenberg. The permeability of porous media to liquids and gases. American Petroleum Institute. Drilling and Production Practice (1941) 200-213.
12. N. Hearn, Et1ect of shrinkage and load-induced cracking on water permeability of concrete, ACI Materials Journal 96 ( 1999) 234-241.
l:l. S. Dal Pont and A. Erlacher, Numerical and experimental analysis of chemical dehydra-tion, heat and mass transfers in a concrete hollow cylinder submitted to high tempera-tures, International Journal of Heat and Mass Transfer47 (2004) 135-147.
14. A. Delaplace. G. Pijaudier-Cabot. S. Roux : Progressive damage in discrete models and consequences on continuum modeling. Jour-nal of Mechanics and Physics of Solids. vol. 44. No. L pp. 99-136. (1996)
15. L. De Arcangelis, H. J. Herrmann : Scaling and Multiscaling Laws in Random Fuse Net-works. Physical Reviews
B.
vol. 39. No. 4. pp. 2678-2684. (1989)16. W.H. Press. A.S. Teukolsky. WT. Vetterling, B.P. Flannery : Numerical Recipes in FOR-TRAN 77: The Art of Scientific Computing. Cambridge University Press: Cambridge, ( 1992).