HAL Id: hal-00574108
https://hal-mines-paristech.archives-ouvertes.fr/hal-00574108
Submitted on 7 Mar 2011HAL is a multi-disciplinary open access archive for the deposit and dissemination of sci-entific research documents, whether they are pub-lished or not. The documents may come from teaching and research institutions in France or abroad, or from public or private research centers.
L’archive ouverte pluridisciplinaire HAL, est destinée au dépôt et à la diffusion de documents scientifiques de niveau recherche, publiés ou non, émanant des établissements d’enseignement et de recherche français ou étrangers, des laboratoires publics ou privés.
Does foreign environmental policy influence domestic
innovation ? Evidence from the wind industry
Antoine Dechezleprêtre, Matthieu Glachant
To cite this version:
Antoine Dechezleprêtre, Matthieu Glachant. Does foreign environmental policy influence domestic innovation ? Evidence from the wind industry. 2011. �hal-00574108�
CERNA WORKING PAPER SERIES
Does foreign environmental policy influence domestic innovation ?
Evidence from the wind industry
Antoine Dechezleprêtre & Mathieu Glachant
Working Paper 2011-02
Cerna, Centre d’économie industrielle MINES ParisTech
60, boulevard Saint Michel 75272 Paris Cedex 06 – France
Tél. : 33 (1) 40 51 90 00 February 2011
Does foreign environmental policy influence domestic
innovation? Evidence from the wind industry
Antoine Dechezleprêtre
†, Matthieu Glachant
∗February 2011
Abstract
This paper examines the relative influence of domestic and foreign renewable energy policies on innovation activity in wind power using patent data from OECD countries from 1994 to 2005. We distinguish between the impact of demand-pull policies (e.g., guaranteed tariffs, investment and production tax credits), as reflected by wind power capacities installed annually, and technology-push policies (government support to R&D). We show that inventors respond to both domestic and foreign new capacities by increasing their innovation effort. However, the effect on innovation of the marginal wind turbine installed at home is 28 times stronger than that of the foreign marginal wind turbine. Unlike demand-pull policies, public R&D expenditures only affect domestic inventors. A simple calculation suggests that the marginal million dollars spent on R&D support generates 0.82 new inventions, whereas the same amount spent on the deployment of wind turbines induces, at best, 0.06 new inventions (0.03 locally and 0.03 abroad).
JEL CLASSIFICATION: O31, Q42, Q48
KEYWORDS: innovation, public R&D, renewable energy policies, wind power
† Grantham Research Institute on Climate Change and the Environment, London School of
Economics and Political Science. Email:[email protected].
∗ Corresponding autor. CERNA, Mines ParisTech, 60 boulevard St Michel, 75006 Paris, France.
1
Introduction
The growing amount of available data—especially patent data—has made it possible in recent years to empirically demonstrate that a major benefit of environmental policies is to foster innovation in environment-friendly technologies. A series of studies measures the level of regulation with pollution abatement and control expenditures (PACE). Jaffe and Palmer (1997) find a positive relationship between PACE and industry-level R&D expenditures. Brunnermeier and Cohen (2003) show that higher PACE have a positive effect on the number of environment-related patents. Other papers show that higher energy prices induce innovation in energy-efficient technologies (Newell et al., 1999; Popp, 2002; Crabb and Johnson, 2010), which suggests that market-based instruments, such as taxes or cap-and-trade systems, can be expected to encourage innovative activity. Johnstone et al. (2010) examine the impact of various policy instruments on innovation in renewable energy.
These studies relate innovation to domestic policies or domestic energy prices. Yet, the market for technologies is increasingly global. A recent report by the World Intellectual Property Organization (WIPO) shows that 44% of the applications for patents worldwide in 2008 were filed by non-residents (WIPO, 2010).1 This suggests that innovators may be
influenced not only by domestic but also by foreign market conditions—including environmental policies. This paper seeks to investigate this hypothesis.
We use a panel of 28 OECD countries over the period 1994-2005 in order to estimate the relative impact on innovation of domestic and foreign policies promoting wind power. We distinguish between two policy approaches: instruments that stimulate the deployment of wind power capacities, such as feed-in tariffs or renewable portfolio standards, and public support to R&D in wind technologies. Deployment policies foster the demand for innovation while public support to R&D subsidizes its supply.
We find that efforts to produce new innovations, as measured by the number of patents filed, increase in response to stronger domestic and foreign deployment policies. However, the effect on innovation of the marginal wind turbine installed at home is 28 times stronger than that of the foreign marginal wind turbine. Unlike demand-pull policies, public support for R&D only affects domestic inventors.
The topic of this paper is crucial for the empirical literature on green innovation. Our finding that environmental policies promote foreign innovation means that previous studies, which look at domestic inventions, have underestimated their overall impact. This result also has important implications for the policy debate on green growth. Political leaders in
various countries currently argue that ambitious environmental and climate domestic policies can help local firms achieve technological leadership, thereby improving the competitiveness of the national economy2. But if these policies also strengthen foreign
competitors, this might weaken their ability to generate a competitive advantage. More generally, if enhancing industrial competitiveness is an important objective of domestic environmental policies, it is important to identify the policy instruments that most effectively achieve this goal. In this respect, our results suggest that public support to R&D is much more effective at generating new innovations than demand-pull policy instruments.
A few empirical studies have begun exploration of the effect of stricter foreign environmental or climate regulation on domestic innovation. Their conclusions are, however, based on correlation analysis, which may not provide sufficient evidence of causality. Lanjouw and Mody (1996) observe that strict vehicle emission regulations in the US seemingly spurred innovation in Japan and Germany. Popp (2006) conversely finds that innovation in air pollution control devices for coal-fired power plants is positively correlated to environmental regulatory pressure in their own country, but not to foreign environmental regulation. Popp et al. (2007) examine the case of chlorine-free technology in the pulp and paper industry and find that both domestic and foreign regulation seem to influence innovation. Whether these results can be supported by econometric evidence remains an open question. Moreover, none of these studies simultaneously assesses the impact of public R&D support as we do here.
A major practical difficulty in cross-country empirical studies on environmental innovation is finding data that are reliable and comparable across countries to act as a proxy for the level of demand-pull regulation.3 As mentioned above, many country-specific studies
use data on PACE, which are collected through surveys in various countries. The problem is that survey methodologies and the precise scope of the PACE vary from one country to another. Data on energy prices are a better candidate. However, in order to control for other regulatory factors affecting innovation, energy price data must be complemented with regulatory data, such as energy-efficiency standards, which are not always comparable across countries (see, for instance, Newell et al., 1999).
2 See, for example, President Obama's speech at the Massachussets Institute of Technology, October
23rd, 2010: “The world is now engaged in a peaceful competition to determine the technologies that will power the 21st century. (…) The nation that wins this competition will be the nation that leads the global economy. And I want America to be that nation. That's why the Recovery Act (…) makes the largest investment in clean energy in history, not just to help end this recession, but to lay a new foundation for lasting prosperity”.
3 Data on public R&D expenditures are more readily available. In this study, we use data from the
In this paper, we use the wind power capacities added annually in each country as a proxy for the strictness of policies promoting the demand for wind innovation. This approach is similar to using PACE. Environmental regulation leads to investments in pollution abatement devices, which are measured by PACE. Similarly, national energy policies induce investments in wind energy, which are reflected by added power capacities— there is little doubt that the deployment of wind turbines in any given country is mostly attributable to government regulation, as the cost of electricity generated from wind power has been significantly higher than that of conventional electricity during the time-period covered by our analysis (see Neuhoff, 2005, and IEA, 2003). The difference is that PACE are expressed in monetary units whereas added power capacities are expressed in megawatts (MW).
The paper proceeds as follows. Section 2 briefly presents the recent deployment of wind power technology at the global level and discusses the policies that support this deployment. Section 3 presents the data. In particular, we explain how we extracted wind patent information from the World Patent Statistical Database (PATSTAT) and discuss the use of patents as indicators of innovation. In section 4, we highlight some features of the data and present evidence for the importance of foreign markets for innovation. Section 5 presents our econometric strategy. Empirical findings are discussed in Section 6. We summarize our findings in a final section.
2
Background information on wind power
The wind power industry is developing very quickly: between 2000 and 2009, installations of turbines have grown at an annual average rate of 30%. This corresponds to a doubling of capacities every three years. As a result, wind turbines produced 340 terawatt-hours (TWh) of electricity in 2009. This represents a very small share of global electricity generation (less than 2%), but a few countries have already achieved high levels of wind power penetration. These include Denmark (20% of electricity production), Portugal and Spain (14%), Ireland (11%), and Germany (8%).
Generation costs for wind power plants have significantly been exceeding the cost of conventional electricity until now4. Costs vary according to a number of factors, including
the size of the turbine and wind availability. According to the IEA Wind Technology Roadmap, the life-cycle cost of electricity generation from wind ranges from a low of 70 USD/MWh under the best circumstances to a high of 130 USD/MWh (IEA, 2009). In
4 This might change in the near future as costs have been constantly diminishing during the past 20
comparison, the generation cost of electricity from coal ranges from 20 USD/MWh to 50 USD/MWh. Gas-fired electricity costs range between 40 USD/MWh and 55 USD/MWh and nuclear electricity costs range between 20 USD/MWh and 30 USD/MWh (IEA, 2005).
Since wind power generation is not yet competitive with conventional electricity generation, the massive deployment of wind turbines across the world has been mainly driven by public policies5. European countries have mostly relied on feed-in tariffs. A feed-in
tariff is a guaranteed price at which electricity suppliers must purchase renewable electricity from producers. Germany introduced an attractive feed-in tariff for wind power in 1990 and wind power capacity increased by 60% annually between 1990 and 2001. In the US, 30 states, including Texas, Florida and California, have adopted Renewable Portfolio Standards, which place an obligation on electricity supply companies to produce a specified fraction of their electricity from renewable energy sources. Other states have implemented investment tax credits, production tax credits, feed-in tariffs, and tradable certificates. As a result, the US represented 26% of the wind capacities installed worldwide in 2009.
Several policies usually coexist in a given jurisdiction. For instance, in his study on the development of wind power in California, Nemet (2009) shows that up to four policies were in place at the same time in the 1980s, including federal investment tax credit, oil windfall profits tax credit, the California alternative energy tax credit, and standard offer contracts. This has important methodological implications for the empirical study of innovation: estimating the specific impact of one component of the policy mix on innovation is hardly feasible.6 In this paper, we overcome this difficulty by focusing directly on the joint
result of these policies; that is, the wind power capacities added annually.
3
Data
3.1 Patent data
We use the EPO/OECD World Patent Statistical Database (PATSTAT) to extract information on all patents filed worldwide from 1994 to 2005 in wind power technology. In PATSTAT, patent documents are categorized using the international patent classification (IPC) system. In order to select the relevant IPC codes for wind power technologies, we rely
5 An overview of the measures adopted by every country, including the timing of their adoption, is
available from the Global Renewable Energy Policies and Measures database maintained by the International Energy Agency, available at http://www.iea.org/textbase/pm/index.html.
6 Johnstone et al. (2010) is a notable exception. However, except for feed-in tariffs, they only
measure the strictness of the different policy instruments by a binary variable, with one indicating that the particular instrument is in place.
on the work carried out by the OECD Environment Directorate7. We extract information
on all patents included in the "F03D" group, which covers wind motors. According to a recent study by the UK intellectual property office8, this category includes 96% of all
wind-power related patents. Therefore, our dataset is a very good proxy for innovative activity in wind power. Our dataset includes 14,418 patent applications filed in 68 patent offices between 1994 and 2005. 9
Patent data have been extensively used as a measure of innovation. The advantages and the limitations of this indicator have been discussed at length in the literature (for a good overview, see OECD, 2009, or Griliches, 1990). Compared with other measures, such as R&D expenditures, patent data have a number of advantages. First, they are available at a disaggregated technological level, which makes it possible to precisely identify wind-power related innovation. Secondly, data on R&D expenditures are only available from the public sector and some large companies. Finally, patent data are now available on a global scale.
There are limitations in using patent data. The first is patents are only one of several means for protecting innovations; other means include lead time, industrial secrecy, or purposefully complex specifications (Cohen et al., 2000; Frietsch and Schmoch, 2006). In particular, inventors may prefer secrecy to avoid public disclosure of the invention imposed by patent law, or to save the significant fees attached to patent filing. However, there are very few examples of economically significant inventions that have not been patented (Dernis and Guellec, 2001). Moreover, the use of patents as a means of protection against imitation does not vary much within sectors. Focusing on the wind power industry allows us to limit the extent of this problem.
Secondly, the propensity to procure patents varies across countries; patenting is more likely to occur in countries with high technological capabilities and a strict enforcement of intellectual property rights. In our analysis, we use country fixed effects and other control variables to deal with this problem.
Finally, the value of individual patents is heterogeneous and its distribution is skewed; as many patents have very little value, the number of patents does not perfectly reflect the value of innovations. Methods have been developed to mitigate this problem (see Lanjouw et al. 1998), such as assigning weights based on the number of times a patent is cited in
7 See www.oecd.org/environment/innovation
8 See the presentation of this study by Peter Keefe from the UK intellectual property office at the
"Patent statistics for decision makers conference"
http://www.epo.org/about-us/events/patstat/programme_fr.html
9 Note that Least Developed Countries are not present in our dataset, for two related reasons: their
subsequent patent applications. Our data do not allow us to implement these methods as citation data is not available for all patent offices and restricting our data set to one or two patent offices would introduce other problems.
Every patent includes information about the inventor, including the country of residence. We use this information to determine where each innovation was developed10. For
example, if a Canadian researcher working in a US-based lab files a patent, we attribute this invention to the US11. Importantly, the same invention may be patented in several countries.
This could lead to a double count for some inventions. However, once patent protection has been requested in a country, subsequent patents covering the same invention in other countries must designate the initial patent as their "priority patent". This feature of the patent system allows us to avoid any double counting.
3.2 Data on installed wind power capacity
Data on installed capacities for wind power production are taken from the International Energy Agency (IEA) Renewables information database12. Data are available for all OECD
countries. For non-OECD countries, the IEA only provides data on energy production from wind power but not on installed capacity. We estimate installed capacity in non-OECD countries by running a pooled linear regression of energy capacities on energy production using the data from OECD countries. We then use this model to make out-of-the-sample predictions for capacities in non-OECD countries based on their production. This allows us to estimate the market size in non-OECD countries, which might influence inventors located in OECD countries. The results of this regression are shown in Table 1. The quality of the estimations is very good.13
Table 1. Regression results for capacities of production
Dependent variable Wind capacities
0.5389*** Production
(0.0039)
10 For 1.4% of the patent applications included in our dataset, the inventor’s country of residence is
not available. When the information is missing, we simply assume that the inventor’s country corresponds to the first patent office in which protection was taken (i.e. the priority office).
11 Patents with multiple inventors are counted fractionally. For example, if two inventor countries
are involved in an invention, then each country is counted as one half.
12 Available at http://data.iea.org/
13 Standards errors are very low. They are thus neglected when calculating the standard errors of the
Observations 570 R-squared 0.97
Note: *** denotes significance at a 1% level. The dependent variable is the wind power installed capacity. We do not include any constant term as production is obviously zero when capacities are nil. The equation is estimated using OLS with standard error in parentheses.
3.3 Other data
We also use data on public R&D expenditures, available from the IEA energy information database. We use the index built by Park (2008) to measure the strictness of intellectual property rights and data on GDP from the UNCTAD.
4
Descriptive statistics
In this section, we highlight some features of the data and provide some preliminary evidence on the influence of foreign markets on innovators.
4.1. Innovation activity and power capacity at the global level
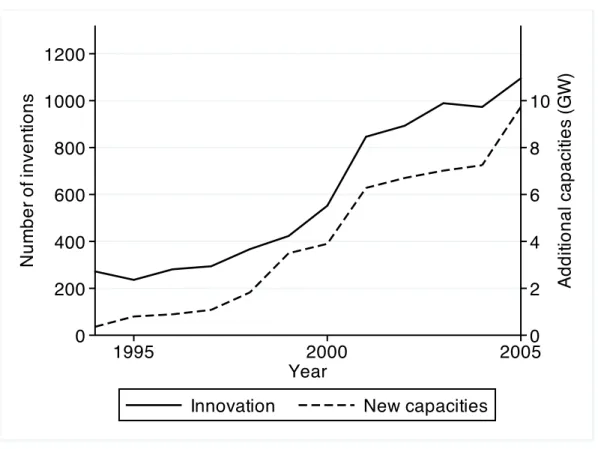
Figure 1 compares the trend in innovation activity with additional wind power capacity installed between 1994 and 2005. The number of inventions patented annually throughout the world in wind power technology has been multiplied by a factor of five between 1994 and 2005. There has been a strong acceleration in innovation activity at the end of the 1990s and then again in 2004. Annual installations of wind power capacities also increased dramatically. While only 360 MW were installed in 1994, the new turbines installed in 2005 amounted to 9,700 MW. At the world level, the correlation between new installations and innovation is striking: the acceleration of the deployment of new power capacity in the 1990s corresponded to a similar increase in the number of inventions, while the deceleration in early 2000 affected both innovation and deployment.
Public R&D expenditures in wind power in OECD countries also increased, but to a lesser extent. They increased by 70% between 1994 and 2005; i.e., from 108 million USD to 182 million USD.
4.2. The importance of foreign patenting
The data strongly suggest that foreign markets matter for inventors. 49% of the patents in the data set are filed by inventors whose country of residence is different from the country in which protection is sought14 (e.g., a patent filed in the US by a German inventor).
"International" inventions (i.e., inventions patented in several countries) are patented in an average of 4.7 countries (including the country of origin). Interestingly, the proportion of international inventions tripled during the 1990s.
Table 2 shows the rate of patent export for the 10 main OECD inventor countries. The rate of export is defined as the share of the country’s inventions that are patented in at least one foreign country. The rate varies widely across countries: nearly 70% for US inventions, around 50% for European countries, but only 10% for Japan and South Korea.
Table 2. Share of international patented inventions for the 10 main OECD inventor countries
Country Export rate
Canada 44.8% France 31.8% Germany 49.0%
Japan 11.0% Netherlands 61.4% S Korea 11.7% Spain 57.7% Sweden 66.7% UK 45.5% USA 68.7%
4.3. The example of Danish wind innovation
In order to illustrate the influence of foreign markets on inventors, in Figure 2 we graph the trend of innovation in Denmark—one of the world leaders in the wind sector—together with the evolution of new domestic and foreign capacities. Since new foreign capacities are much larger than new domestic capacities, we normalize both to equal 1 in 1994. Figure 2 shows that innovation was tightly correlated with the installation of domestic (and foreign) capacities until the end of the 1990s. Since then, however, the amount of new capacities in Denmark has been constantly falling, while innovation has continued to grow at a stronger pace. That innovation expands rapidly while domestic installations vanish is clearly indicative of Danish companies mainly innovating for foreign markets.
5
Econometric framework
The above statistics suggest the existence of cross-country policy spillovers. In this section, we develop an econometric strategy to confirm this assumption. We seek to measure the effect of a change in domestic or in foreign regulation on the innovation output of a country. We measure country i’s innovation output in year t by Ni,t, which is the number of inventions
for which inventors from country i have sought patent protection.15 We use a typical log-log
specification16:
* *
, 1 , 1 2 , 1
1 , 2 , , , ,
log log log
log log log
i t i i t i t i t i t i t i t i t N cap cap rd rd K Z t
η α
α
β
β
γ
µ
λ
ε
+ − + − = + + + + + + + + (1) The variable * , 1 i tcap + is the expectation in year t of the capacity that will be added in
country i in year t + 1. Similarly, * , 1
i t
cap− + is the sum of all the expected installations of capacities abroad out of country i expected in year t + 1. We will return to discussion of these two variables in the next section. rdi t, and rd−i t, are public R&D expenditures in year t
in country i and in all other countries, respectively. Ki t, is the discounted stock of wind patents previously filed by inventors from country i.17 In the literature, this is a usual proxy
for the stock of knowledge available to inventors at year t (see for instance Popp 2002 & 2006 and Peri, 2005). This allows controlling for past supply and demand factors. Zi,t is a
vector of control variables that will be described later;
η
i is a country-specific fixed effect and t is a time trend; εi t, is the error term. The objective of our analysis is to estimate theelasticities
α
1,α
2,β
1, andβ
2. We now explain and justify, in greater detail, how we construct the different explanatory variables.5.1 Wind capacities
The way we measure the demand for innovation induced by regulation deserves several important remarks. To begin with, installed capacities do not only reflect policy strictness.
15 As mentioned above, inventions patented in several countries are only counted once in order to
avoid any double counting.
16 As a robustness check, we also estimate a negative binomial model. 17 We add unity to the variables Ni t, ,
* ,+1 i t cap , * , 1 − +i t cap , * , i t rd , * , −i t rd
, andKi t, , in order to compute the logarithm also in the case where their value is zero.
The number of turbines installed in a country is also related to the availability of windy locations, which is, in turn, driven by climatic conditions and by the size of the country. These factors are country-specific and do not vary over time. However, they are not controlled for by the fixed effect
η
i as they probably do not enter additively in Eq. (1).18This does not pose any problem if, when interpreting the results, we keep in mind that the added capacity is not a direct indicator of the policy strictness, but captures the size of the demand induced by policies. To a large extent, the same remark applies to previous studies that rely on PACE to act as a proxy for regulation.
A crucial issue is related to innovators’ rationality. In our view, innovators are forward-looking. Their decisions are based on expectations about future installations. In Eq. (1), we accordingly assume that they take into account the capacities they expect to be deployed in year t + 1. A practical problem is that we do not observe expected installations. The data only describe actual installations. To overcome this difficulty, we assume that innovators form adaptive expectations based on past observations, such as in the study by Popp (2002).
We consider that innovators form adaptive expectations on the annual variation of installations * *
, 1 , 1 ,
i t i t i t
cap + cap + cap
∆ = − . The standard adaptive expectations model indicates that:
* * *
, 1 ,
(
, ,)
i t i t i t i t
cap
+cap
λ
cap
cap
∆
= ∆
+ ∆
− ∆
with * *
, 1 , 1 ,
i t i t i t
cap + cap + cap
∆ = − and ∆capi t, =capi t, −capi t,−1. That is, current expectations for the annual variation of installations *
, 1 i t cap + ∆ reflect last year’s expectations * , i t cap
∆ and an "error-adjustment" term, in which current expectations are raised (or lowered) according to the gap between the actual variation and previous expectations, *
, ,
i t i t
cap cap
∆ − ∆ , weighted by the parameter λ, which captures adjustment speed (0 < λ < 1).
We apply this theory to all previous periods and we rearrange, so that the current expectation is equal to:
* , , 0 (1 ) k i t i t k k cap
λ
λ
cap − = ∆ = − ∆ ∑
(2)18 One could, however, argue that
i
η
controls for wind resources in country i as capi,t is logged andHence, the expected variation of installations equals a weighted average of all past variations where the weights shrink as we move further toward the past. By rearranging (2), we obtain an expression for the variable of interest *
, 1 i t cap + : * , 1 , , , 1 0 (1
λ
)λ
( ) + − − − = = + −∑
k − i t i t i t k i t k kcap cap cap cap
We use the same formula for expected foreign capacities:
* , 1 , , , 1 0 (1
λ
)λ
( ) − + − − − − − − = = + −∑
k − i t i t i t k i t k kcap cap cap cap
Since we do not observe the parameter λ, we estimate Eq. (1) using all possible values of
λ between 0 and 1 and select the value of λ that best fits the data.19 We obtain λ = 0.75. We
carry out sensitivity analysis in the Appendix to test the robustness of our results with other values of λ.20
Alternatively, we could proxy expected capacities in year t + 1 by the real capacities
, 1
i t
cap + and cap− +i t, 1. But this would bias our estimates of
α
1 andα
2 in a downward direction since actual capacities are likely to exhibit greater variation than expectations (see Newell et al., 1999, for a discussion on this measurement error problem). In addition, this would introduce a causality problem because innovations patented in year t may reduce the cost of producing wind turbines, which would in turn induce new power capacities in the future21.Our approach remains, however, imperfect for two main reasons. First, the assumption that innovators form adaptive expectations may not be valid in reality. Second, innovators do not only take into account the expectations of installations in year t + 1, but also in years
t + 2, t + 3, etc. Unfortunately, available models of adaptive expectations are not able to
calculate the expected flow of installations on the entire time horizon. Note that the problem
19 In other words, we choose the value of λ that maximizes the R-square.
20 Assuming that innovators form adaptive expectations on the absolute level of installations would
have been inappropriate. The adaptive expectations model would lead to *
,+1= − Σ(1 λ λ) ,−
k
i t i t k
cap cap . Because installations of wind turbines are increasing every year over the period 1994 – 2005 in nearly every country (i.e., capi t, increases with t), this formula implies
* ,+1
i t
cap <capi t, : hence, innovators are unable to anticipate any increase in installations.
21 Many inventions in the field of renewable energy are developed in order to cut production costs.
For example, the primary aim of research on thin films is to reduce the production cost of solar panels.
vanishes if you suppose that inventors’ expectations about future installations are simply a multiple of expected installations in year t + 1.22
5.2 R&D public support
In line with previous studies, we use public R&D expenditures at year t to explain innovation in the same year (see Popp, 2002; Johnstone et al., 2010; Verdolini and Gaelotti, 2009). The reason for using contemporaneous public R&D is that public R&D expenditures, as reported by the IEA, mostly consist of tax credits on private R&D expenditures, which are received by companies once expenditures have been incurred23.
The variable rdi t, poses a simultaneity problem as domestic R&D expenditures are inputs of the innovation process, which leads to new patents at home. This leads us to adopt an instrumental variables approach. We use annual R&D public expenditures in solar power, biomass and geothermal energy in the same country and year as instruments. R&D expenditures in these domains present the necessary properties. First, they do not directly influence the number of wind patents as they sharply differ from wind energy from a technological point of view24. Second, they are positively correlated with
,
i t
rd as there is arguably a degree of jointness in the policy decisions to support R&D in specific renewable technology fields. Below, we give the results of several tests that confirm these arguments.
Note that a similar problem could exist with rd−i t, , the amount of foreign R&D. But the problem is more lenient, as simultaneity can only involve the share of knowledge that immediately flows in country i.
5.3 Control variables
As explained above, Ki t, is the discounted stock of wind patents previously filed by inventors
from country i25:
22 The literature upon which we are building has not yet solved these problems, which constitute an
important avenue for future research. Newell et al. (1999) and Popp (2002) used past prices to act as a proxy for expected future prices. Brunnermeier and Cohen (2003) used current PACE to measure perceived regulatory stringency, while Jaffe and Palmer (1997) use lagged values of PACE.
23 For this reason, lagged values of public R&D expenditures are not statistically significant but
forward values are (see the results in Appendix).
24 This is the reason why we did not use R&D expenditures in marine energy as an instrument. The
technologies used for marine and wind energy production have some similarities.
25 We have tried to also use the discounted stock of wind patents previously filed by inventors in the
rest of the world, but this variable has no statistically significant impact (see the results in Appendix). The reason is that, as shown by Peri (2005), most of the knowledge created in foreign countries is not accessible to inventors, for reasons such as geographical distance or language.
δ
∞ − = =∑
− , , 1 (1 )k i t i t k k K NWe set the value of the discount factor
δ
at 10%, a value commonly used in the literature (see for example Keller, 2002, and Peri, 2005). We test the robustness of this assumption by trying other values ofδ
(see Appendix).We also include country fixed-effects to control for any time-invariant differences in inventor countries’ characteristics that may influence their innovation performance and for cross-country differences in the propensity to use patents as a means of protecting new inventions.26
The inclusion of a time trend in the equation also deserves discussion. The use of time dummies would have been preferable. But it has proved impossible due to collinearity with
,
i t
rd− and * , 1
i t
cap− + . The reason is that these two variables, by construction, do not vary
much in a cross section of countries. Consider, for example, the variable * , 1
i t
cap− + . This is the sum of all capacities, which is common to all countries, minus the capacity installed in country i, which is country-specific but usually much smaller than the sum of all capacities. As robustness checks, we try alternative functional forms such as log(t) or t2. This does not
affect our results (see Appendix). To mitigate the problem, we also include two time-varying controls: iprt, which is an index of the average strictness of patent systems in the world at
year t built from Park (2008), and log(gdpt), the log sum of all countries’ GDP in year t.
The panel is balanced and extends over 12 years, from 1994 to 2005. It covers the 30 OECD countries. Descriptive statistics for the variables used in the analysis are shown in Table 3.
Table 3—Descriptive statistics
Variable Definition Mean Std deviation
,
i t
N Count of patents filed in country i in year t 17.2 43.2
* , 1
i t
cap + Expected installations of capacities in country i
in year t +1 (MW) 67.9 194.4
* , 1
i t
cap− + Expected installations of capacities out of
country i in year t +1 (MW) 2063.3 1533.1
,
i t
rd Public R&D expenditures in country i in year t
(million USD) 4.41 9.45
26 We have also estimated a random effects model, but a Hausman test rejected the hypothesis that
unobserved heterogeneity was uncorrelated with the explanatory variables, thereby justifying the inclusion of country fixed-effects.
,
i t
rd− Public R&D expenditures out of country i in
year t (million USD) 130.8 19.8
,
i t
K Stock of previously patented inventions in
country i in year t 85.0 179.5
iprt
Average index of Intellectual Property Rights
in year t 4.17 0.17
gdpt World GDP in yeat t (billion USD) 1040 203
t Year 1999.5 3.46
Note: The variables Ni t, , * ,+1 i t cap , * , 1 − +i t
cap , rdi t, , rd−i t, andKi t, are logged in the estimations but we present the descriptive statistics in non-logged values as these are more readily understandable.
6
Results
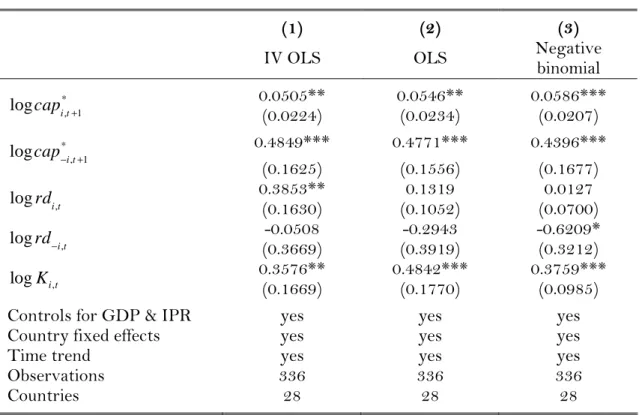
Estimation results of Eq. (1) are shown in Table 4. As robustness checks, we also report the results of two additional models in which domestic public R&D expenditures are not instrumented; i.e., a standard OLS model and a negative binomial model. The latter is suitable because most countries produce very few innovations, implying that the data is over-dispersed, with the standard deviation being higher than the mean. The negative binomial regression model tests and corrects for over-dispersion. Tests demonstrate the existence of autocorrelation27; Table 4 thus displays standard errors that are clustered by
country (and are robust to heteroskedasticity).
While the results obtained with the OLS and the negative binomial results are very similar, instrumenting logrdi td, clearly modifies the coefficients of the two R&D variables. This suggests that instrumentation is necessary. We have performed several tests to confirm that statement. To begin with, the first-stage model statistics of the IV–OLS model show that our instruments (public R&D in solar, biomass, and geothermal energy) are relevant. The Shea partial R-square is 0.21 and the cluster-robust F-statistics of joint significance of the instrument variables is 5.33 (p-value of 0.00). Furthermore, the coefficients of the excluded instruments exhibit statistically significant and positive coefficients, as expected.
As we have three instruments for one endogenous regressor, we have also been able to perform a test of overidentifying restrictions to check whether the instruments are orthogonal to the error process. The Hansen J statistic is equal to 0.19, implying that the null hypothesis—the instruments satisfy the orthogonality conditions—cannot be rejected (p-value = 0.91). We also test different subsets of the overidentifying restrictions, which lead us to keep our three instruments. Finally, we test for the endogeneity of rd−i t, with a “difference in Sargan” statistics, which is robust to clustering.28 The endogeneity hypothesis
is weakly rejected (the p-value of the Chi-square test is 0.13).
Given these tests, we can now concentrate the discussion on the results derived from the IV-OLS model. We see that both increasing domestic and foreign wind power installations foster innovation. The two coefficients are significant at the 5% level, but the size is clearly different: the elasticity is 0.05 for domestic installation and 0.48 for foreign installation. That is, a 10% increase of domestic installation induces a 0.5% increase in innovation while a 10% increase in foreign capacities increases innovation by 4.8%. This does not come as a surprise
27 We performed a Wooldridge test for autocorrelation (Wooldridge, 2002). The null hypothesis (no
autocorrelation) was rejected with a p-value of 0.0022.
as the size of the overall foreign market is on average 30 times larger than the domestic market (see Table 3).
Table 4 — Estimation results
(1) (2) (3)
IV OLS OLS Negative binomial 0.0505** 0.0546** 0.0586*** * , 1 logcapi t+ (0.0224) (0.0234) (0.0207) 0.4849*** 0.4771*** 0.4396*** * , 1 logcap− +i t (0.1625) (0.1556) (0.1677) 0.3853** 0.1319 0.0127 , logrdi t (0.1630) (0.1052) (0.0700) -0.0508 -0.2943 -0.6209* , logrd−i t (0.3669) (0.3919) (0.3212) 0.3576** 0.4842*** 0.3759*** , logKi t (0.1669) (0.1770) (0.0985)
Controls for GDP & IPR yes yes yes Country fixed effects yes yes yes
Time trend yes yes yes
Observations 336 336 336
Countries 28 28 28
Note: *=significant at the 10% level, **=significant at the 5% level, ***=significant at the 1% level. The dependent variable is the log of the number of inventions in columns 1 and 2 and the number of inventions in column 3. Columns 1 and 2 are estimated by OLS with standard errors in parentheses (clustered by country). In column 1 we instrument public R&D expenditures with public R&D expenditures in solar power, biomass, and geothermal energy. Column 3 is estimated using a negative binomial estimation. All columns include a full set of country dummies, a time trend and controls for the global level of patent rights and the world's GDP. The final sample includes 28 countries as two countries with no installations throughout the sample are dropped from the estimations.
If we now calculate the marginal effect of an additional MW installed at home or abroad at the sample mean, we find that one additional MW at home increases the number of domestic patented innovations by 0.0223, whereas one additional MW abroad only increases that number by 0.000829. Hence the marginal effect of domestic installations on innovation is
approximately 28 times larger than that of foreign installations.
Each MW added abroad induces 0.0008 inventions and this effect occurs in 27 countries (all the 28 countries of the dataset except the one where the additional MW is installed). Hence, an additional MW induces approximately an overall number of 0.0008 * 27 = 0.0216 inventions abroad, which is very close to the 0.022 inventions generated at home.
29 Recall that the value of patents is heterogeneous. Therefore, these figures describe the effect of
pull policies have a comparable aggregate impact on foreign innovation and on domestic innovation.
Why is the marginal effect of the domestic market much higher? A first possible explanation could be that wind power technologies are tailored to national specificities. Although some wind innovations aim at adapting turbines to extreme conditions found only in specific regions, most wind power technologies have a general application. A more plausible explanation is that barriers to technology diffusion—such as geographical distance, language and cultural differences, tariffs and non-tariffs barriers to trade—diminishes the potential of foreign technology markets.
In a hypothetical world where technologies could be transferred from one country to another without frictions, the location of innovators would not matter. Therefore, an important consequence of our findings is that barriers to technology diffusion also discourage innovation. The marginal effects we obtain indicate that these barriers are very strong.
Turning next to the impact of public R&D, Table 4 shows that a 10% increase of domestic public expenditures increases local innovation by 3.8%. The marginal effect of 1 million USD is 0.82 inventions. This value is in line with previous studies measuring the average R&D expenditures associated with patented innovation30 (see Arora et al., 2008). In
contrast, public support to R&D in foreign countries has no statistically significant effect31.
This suggests that immediate cross-country spillovers of technology-push policies are limited.
We can then use our econometric estimates to compare the return for innovation from public R&D and demand-pull wind policies. Installing 1 MW of wind power capacity costs between 0.65 million USD and 2 million USD relative to conventional electricity32. Hence, 1
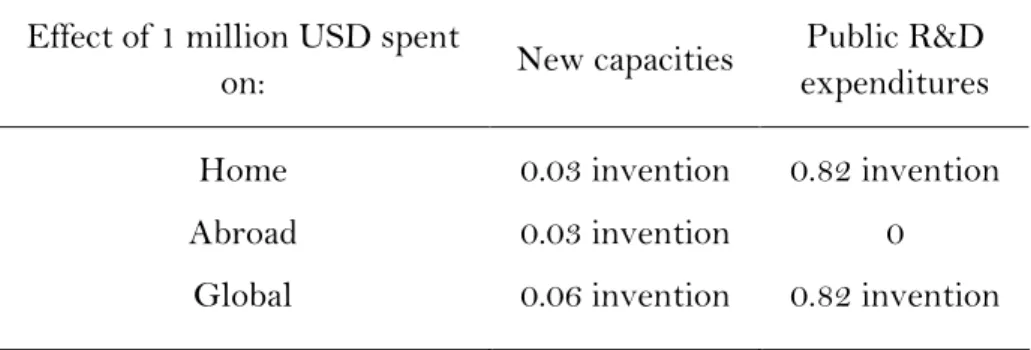
million USD allows installing between 0.5 MW and 1.5 MW. Using the conservative estimate of 1.5 MW, Table 5 compares the impact on innovation of 1 million USD spent either on public R&D or on wind power installations. The result clearly shows that public R&D expenditures are much more effective at generating new inventions than demand-pull policies.
30 Arora et al. (2008) find that a patented product innovation is associated with 1 million USD of
R&D expenditures on average. We are not aware of a study providing a monetary assessment of the impact of public R&D support on the number of patented innovations.
31 Public support for R&D in foreign countries, however, increases the stock of knowledge upon
which inventors build to develop new inventions. Foreign public R&D expenditures can thus have an indirect effect on domestic innovation in the longer term. For an analysis of international knowledge flows and their effects on innovation, see Peri (2005).
32 We use the costs calculated by the IEA, which are presented in section 2 (IEA, 2005), and assume
The policy message here is that promoting innovation is an ancillary—though potentially significant—benefit of demand-pull policies, which cannot justify per se their implementation. The table further suggests that the benefit also concerns foreign countries. This could be viewed negatively from a narrow national perspective; contrary to public R&D expenditures, subsidizing new turbines does not only create technology leaders at home, it also strengthens rivals abroad.
Table 5 – Simulations of the impact of 1 million USD on innovation
Effect of 1 million USD spent
on: New capacities
Public R&D expenditures
Home 0.03 invention 0.82 invention Abroad 0.03 invention 0
Global 0.06 invention 0.82 invention
Note: We assume that installing 1 MW of wind power costs 0.65 million USD compared to conventional electricity. Therefore, this table presents the most optimistic estimates for the impact of new capacities on innovation. We do not take into account the long-term impact of inventions through increased knowledge stock.
Turning finally to the stock of knowledge (log Ki,t), the coefficient is positive and
significant as expected, with an elasticity of 0.35. From a policy point of view, this means that new turbines and public R&D also increase innovation in the long term through the increase in the stock of knowledge, which feeds future innovation33. This additional
long-term effect, however, does not modify the overall relative impacts of demand-pull and technology-push policies.
7
Summary of the results and policy implications
In this paper, we use patent data from OECD countries to analyze the influence of domestic and foreign regulation on innovation activity in wind power technologies between 1994 and 2005. While previous papers focus on a single country, our data allow us to investigate the cross-border drivers of innovation.
We show that efforts to produce new innovations increase in response to new power capacities both at home and abroad. However, the marginal effect of domestic installations on innovation is 28 times stronger than the marginal effect of foreign installations: 1 MW installed at home induces 0.022 inventions while 1 MW installed abroad generates 0.0008 inventions.
The significant difference between marginal effects suggests the existence of high barriers to technology diffusion, which reduce the potential of foreign markets. In this respect, the existing empirical literature on technology diffusion stresses the role of
33 The size of this effect centrally depends on the value of the discount rate δ. With δ=0.1, the
additional long term impact of both demand-pull policies and public R&D through increased knowledge stock is about one half of the short-term impact.
intellectual property rights in recipient countries, trade barriers that hinder the exports of technology-intensive capital goods, constraints on foreign direct investments that limit technology transfer by multinationals, and the lack of sufficient technological absorptive capacities in certain countries (see Keller, 2004, for a review and Dechezleprêtre et al., 2010 & 2011, for a focus on environmental technologies). In terms of policy implications, our work means that lowering existing barriers to diffusion constitutes a powerful leverage for boosting environmental innovation.
Put differently, our results mean that a 1 MW wind turbine induces 0.022 inventions at home and 0.0008 inventions in each foreign country. Adding up the impact in all foreign countries, we find that the total effect on domestic and on foreign innovation is similar. This finding suggests that previous empirical studies, which only look at the effect of policies on domestic innovation, dramatically underestimate the overall impact of demand-pull environmental policies on innovation.
Finally, we find that—contrary to demand-pull policies—public support for R&D only affects domestic inventors. In line with the predictions of theoretical models of directed technical change in the presence of environmental constraints, we find evidence that public support to R&D is much more effective at generating new innovations than demand-pull policy instruments. The marginal million dollars spent on R&D support generates 0.82 new inventions whereas the same amount spent on demand-pull policies induces at best 0.06 new inventions (0.03 locally and 0.03 abroad). Therefore, innovation has to be seen as a potentially significant, but ancillary, benefit of demand-pull policies.
References
Arora, A., Ceccagnoli, M., Cohen, W., 2008. R&D and the patent premium. International Journal of Industrial Organization 26: 1153–1179
Brunnermeier, S. B., Cohen, M. A., 2003. Determinants of environmental innovation in US manufacturing industries. Journal of Environmental Economics and Management 45: 278-293.
Cohen, W.M., Nelson, R.R., Walsh, J.P., 2000. Protecting their Intellectual Assets: Appropriability Conditions and Why U.S. Manufacturing Firms Patent (or Not). NBER Working Paper no. 7552.
Crabb, J., Johnson, D., 2010. Fueling Innovation: The Impact of Oil Prices and CAFE Standards on Energy-Efficient Automotive Technology. The Energy Journal, Vol. 31 (1).
Dechezleprêtre, A., Glachant, Ménière, Y. (2010). What Drives the International Transfer of Climate Change Mitigation Technologies? Empirical Evidence from Patent Data. CERNA working paper 2010.03.
Dechezleprêtre, A., Glachant, M., Johnstone, N., Hascic, I., Ménière, Y. (2011). Invention and Transfer of Climate Change Mitigation Technologies: A Global Analysis. Review of
Environmental Economics and Policy. Working paper available at
http://ssrn.com/abstract=1414227
Dernis, H., Guellec, D., van Pottelsberghe, B., 2001. Using Patent Counts for Cross-Country Comparisons of Technology Output, STI Review 27
(http://www.oecd.org/LongAbstract/0,3425,en_2649_33703_21682516_1_1_1_1,00.html).
Frietsch, R., Schmoch, U. 2006. Technological structures and performance as reflected by patent indicators. in Schmoch, U.; Rammer, C.; Legler, H. (eds.) National Systems of
Innovation in comparison. Structure and performance indicators for knowledge societies. (Dordrecht:
Springer)
Griliches, Z., 1990. Patent Statistics as Economic Indicators: A Survey. Journal of Economic Literature, Vol. 28, No. 4, pp. 1661-1707.
IEA, 2003. Renewables for power generation. Paris, International Energy Agency.
IEA, 2005. Projected costs of electricity generation. Paris, International Energy Agency.
IEA, 2009. Wind technology roadmap. Paris, International Energy Agency.
Jaffe, A. B., Palmer, K., 1997. Environmental regulation and innovation: a panel data study. Review of Economics and Statistics 79(4): 610-619.
Johnstone, N., I. Haščič and D. Popp, 2008. "Renewable Energy Policies And Technological Innovation: Evidence Based On Patent Counts," Environmental & Resource Economics, vol. 45(1), pages 133-155.
Keller, W., 2002. Geographic Localization of International Technology Diffusion. American
Economic Review 92, 120–142.
Keller, Wolfgang, “International Technology Diffusion,” Journal of Economic Literature, XLII (2004), 752–782.
Lanjouw, J.O., Mody, A., 1996. Innovation and the International Diffusion of Environmentally Responsive Technology. Research Policy, Vol. 25, pp. 549-571.
Lanjouw, J., A. Pakes and J. Putnam (1998), “How to Count Patents and Value Intellectual Property: Uses of Patent Renewal and Application Data”, The Journal of Industrial Economics, Vol. 46 (4), pp. 405-432.
Nemet, G., 2009. "Demand-pull, technology-push, and government-led incentives for non-incremental technical change," Research Policy, 38(5), 700-709.
Neuhoff, K., 2005. "Large-Scale Deployment of Renewables for Electricity Generation," Oxford Review of Economic Policy, 21(1), 88-110.
Newell, R.G, Jaffe, A.B., Stavins, R.N., 1999. The Induced Innovation Hypothesis and Energy-Saving Technological Change. The Quarterly Journal of Economics 114:941-75
OECD, 2009. OECD Patent Statistics Manual.
Park, W., 2008. "International patent protection: 1960-2005," Research Policy, 37(4), 761-766.
Peri, G., 2005. Determinants of knowledge flows and their effect on innovation. Review of Economics and Statistics 87 (2), 308– 322.
Popp, D., 2002. Induced innovation and energy prices. The American Economic Review 92(1): 160-180.
Popp, D., 2006. International innovation and diffusion of air pollution control technologies: the effects of NOX and SO2 regulation in the U.S., Japan, and Germany. Journal of Environmental Economics and Management 51: 46-71.
Popp, D., Hafner, T., Johnstone, N., 2007. Policy vs. Consumer Pressure: Innovation and Diffusion of Alternative Bleaching Technologies in the Pulp Industry. NBER Working Paper No. W13439. Available at: http://ssrn.com/abstract=1016350
Verdolini, E., Gaelotti, M., 2009. At Home and Abroad: An Empirical Analysis of Innovation and Diffusion in Energy-Efficient Technologies. FEEM Working Paper 123-2009.
WIPO, 2010. World Intellectual Property Indicators 2010
Wooldridge, 2002. "Econometric Analysis of Cross Section and Panel Data," Cambridge, MA, MIT Press.
Appendix: Robustness checks
This section presents the robustness tests we conducted. The results are shown in Tables 6 and 7 below.
1. Alternative values of λ
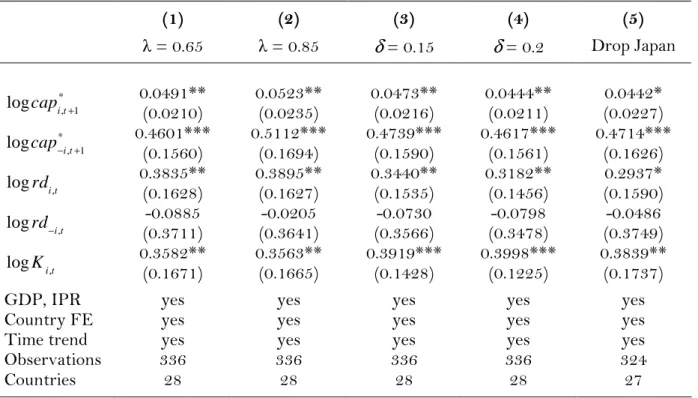
In the estimations, we use λ = 0.75, the value of λ that best fits the data. In Table 6, we report estimation results obtained for significantly different values of λ (λ = 0.65 and λ = 0.85). As shown in columns (1) and (2), the value of the coefficients is only marginally modified.
2. Alternative values of
δ
In our main estimations, we use a discount factor of 10% to construct Ki t, , the discounted stock of wind patents previously filed by inventors from country i. We test the robustness of this assumption by testing higher values of
δ
. Columns (3) and (4) of Table 6 report the results obtained when setting the value ofδ
at 15% and 20%. Not surprisingly, increasingthe value of
δ
increases the point estimates for the discounted knowledge stock. This, in turn, decreases the coefficient of public R&D expenditures, suggesting that public R&D expenditures and the knowledge stock are substitutes.3. Checking for outliers
As is commonly the case with patent data, the distribution of patents across countries is highly heterogeneous, with a few countries accounting for a large share of innovations. For this reason, it is necessary to check that our results are not driven by outliers. To do so, we considered trimming (dropping the top countries in wind innovation) or winsorizing the extreme values. Our findings were qualitatively robust when performing these changes. Column (5) of Table 6 reports the results obtained when we dropped Japan, by far the top inventor in our sample with 35% of the total patented inventions. Results are robust, although the p-values tend to increase.
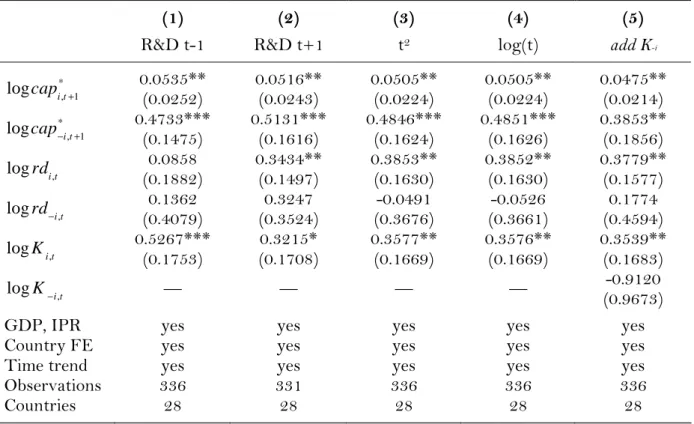
4. Alternative lags of R&D
In our mainstream estimations, we follow previous studies by using public R&D expenditures at year t to explain innovation in the same year. The reason for using contemporaneous public R&D is that public R&D expenditures mostly consist of tax credits on private R&D expenditures, which are received by companies once expenditures have been incurred. This is illustrated by columns (1) and (2) of Table 7, where we respectively report the results obtained when using lagged values or forward values of public R&D expenditures. Lagged values turn out to be insignificant while forward values remain statistically significant.
5. Alternative time controls
In addition to time-varying controls for GDP and the strictness of IP rights, our mainstream estimation include a linear time trend. We test the robustness of our results by testing non-linear time trends. Results are shown in Table 7. We use t2 in column (3) and
log(t) in column (4). Our results are robust to these alternative control variables.
6. Additional control variable
Column (5) of Table 7 reports the results obtained when we include the discounted stock of wind patents previously filed by inventors in the rest of the world as an additional control variable. This variable has no statistically significant impact. Moreover, other results are not affected.
Table 6 — Robustness checks 1 (1) (2) (3) (4) (5) λ = 0.65 λ = 0.85
δ
= 0.15δ
= 0.2 Drop Japan 0.0491** 0.0523** 0.0473** 0.0444** 0.0442* * , 1 logcapi t+ (0.0210) (0.0235) (0.0216) (0.0211) (0.0227) 0.4601*** 0.5112*** 0.4739*** 0.4617*** 0.4714*** * , 1 logcap− +i t (0.1560) (0.1694) (0.1590) (0.1561) (0.1626) 0.3835** 0.3895** 0.3440** 0.3182** 0.2937* , logrdi t (0.1628) (0.1627) (0.1535) (0.1456) (0.1590) -0.0885 -0.0205 -0.0730 -0.0798 -0.0486 , logrd−i t (0.3711) (0.3641) (0.3566) (0.3478) (0.3749) 0.3582** 0.3563** 0.3919*** 0.3998*** 0.3839** , logKi t (0.1671) (0.1665) (0.1428) (0.1225) (0.1737) GDP, IPR yes yes yes yes yes Country FE yes yes yes yes yes Time trend yes yes yes yes yes Observations 336 336 336 336 324Countries 28 28 28 28 27
Note: *=significant at the 10% level, **=significant at the 5% level, ***=significant at the 1% level. The dependent variable is the log of the number of inventions. All columns are estimated by OLS with standard errors in parentheses (clustered by country). Public R&D expenditures are instrumented with public R&D expenditures in solar power, biomass, and geothermal energy. All columns include a full set of country dummies, a time trend and controls for the global level of patent rights and the world's GDP.
Table 7 — Robustness checks 2
(1) (2) (3) (4) (5)
R&D t-1 R&D t+1 t2 log(t) add K-i
0.0535** 0.0516** 0.0505** 0.0505** 0.0475** * , 1 logcapi t+ (0.0252) (0.0243) (0.0224) (0.0224) (0.0214) 0.4733*** 0.5131*** 0.4846*** 0.4851*** 0.3853** * , 1 logcap− +i t (0.1475) (0.1616) (0.1624) (0.1626) (0.1856) 0.0858 0.3434** 0.3853** 0.3852** 0.3779** , logrdi t (0.1882) (0.1497) (0.1630) (0.1630) (0.1577) 0.1362 0.3247 -0.0491 -0.0526 0.1774 , logrd−i t (0.4079) (0.3524) (0.3676) (0.3661) (0.4594) 0.5267*** 0.3215* 0.3577** 0.3576** 0.3539** , logKi t (0.1753) (0.1708) (0.1669) (0.1669) (0.1683) -0.9120 −, logK i t — — — — (0.9673) GDP, IPR yes yes yes yes yes Country FE yes yes yes yes yes Time trend yes yes yes yes yes Observations 336 331 336 336 336
Countries 28 28 28 28 28
Note: *=significant at the 10% level, **=significant at the 5% level, ***=significant at the 1% level. The dependent variable is the log of the number of inventions. All columns are estimated by OLS with standard errors in parentheses (clustered by country). Public R&D expenditures are instrumented with public R&D expenditures in solar power, biomass, and geothermal energy. All columns include a full set of country dummies, a time trend and controls for the global level of patent rights and the world's GDP.