Short communication: Genetic relationship between calving
traits and body condition score before and after calving
in Canadian Ayrshire second-parity cows
C. Bastin ,*1 S. Loker ,† N. Gengler ,*‡ A. Sewalem ,§# and F. Miglior §# * University of Liège, Gembloux Agro-Bio Tech, Animal Science Unit, B-5030 Gembloux, Belgium
† Center for the Genetic Improvement of Livestock, University of Guelph, Guelph, Ontario, N1G 2W1, Canada ‡ National Fund for Scientific Research, B-1000 Brussels, Belgium
§ Guelph Food Research Centre, Agriculture and Agri-Food Canada, Guelph, Ontario, N1G 5C9, Canada # Canadian Dairy Network, Guelph, Ontario, N1K 1E5, Canada
ABSTRACT
The objective of this study was to investigate the ge-netic relationship between body condition score (BCS) and calving traits (including calving ease and calf sur-vival) for Ayrshire second-parity cows in Canada. The use of random regression models allowed assessment of the change of genetic correlation from 100 d before calving to 335 d after calving. Therefore, the influence of BCS in the dry period on subsequent calving could be studied. Body condition scores were collected by field staff several times over the lactation in 101 herds from Québec and calving records were extracted from the official database used for Canadian genetic evalua-tion of calving ease. Daily heritability of BCS increased from 0.07 on d 100 before calving to 0.25 at 335 d in milk. Genetic correlations between BCS at different stages ranged between 0.59 and 0.99 and indicated that genetic components for BCS did not change much over lactation. With the exception of the genetic correlation between BCS and direct calving ease, which was low and negative, genetic correlations between BCS and calving traits were positive and moderate to high. Cor-relations were the highest before calving and decreased toward the end of the ensuing lactation. The correla-tion between BCS 10 d before calving and maternal calving ease was 0.32 and emphasized the relationship between fat cows before calving with dystocia. Stan-dards errors of the genetic correlations estimates were low. Genetic correlations between BCS and calf survival were moderate to high and favorable. This indicates that cows with a genetically high BCS across lactation would have a greater chance of producing a calf that survived (maternal calf survival) and that they would transmit genes that allow the calf to survive (direct calf survival).
Key words: body condition score , calving ease , still-birth , genetic correlation
It is commonly assumed that overconditioned cows before calving are at a greater risk for calving difficulty. Animals carrying excessive body condition resulting in intrapelvic fat deposition and a reduction in pelvic area (especially for first-lactation heifers) are more likely to develop dystocia. It has also been indicated that a BCS higher than 4 (on a 5-point scale) before calving posed a significant risk for dystocia (Chassagne et al., 1999). However, previous research studying the relationship between calving traits and BCS has investigated only the phenotypic link and has been generally based on a limited number of herds. Furthermore, the use of more data and random regression models could allow the es-timation of phenotypic and genetic correlations across both the dry period and lactation between BCS as a longitudinal trait and calving traits that are measured as single lactation records. The objective of this study was to estimate the genetic correlation between calving traits and BCS recorded during the period preceding the second calving and during the following lactation.
Calving traits included calving ease (CE) and calf survival (CS). Calving ease was coded in 4 classes from 1 (unassisted calving) to 4 (surgery required). Calf sur-vival was 0 if the calf died within 24 h from birth and 1 otherwise. The study was focused on second-parity Ca-nadian Ayrshire cows. This work is the continuation of research by Bastin et al. (2010) investigating the genetic correlation between BCS and reproduction traits (in-cluding both female fertility and calving performance) in Canadian Ayrshire and Holstein first-parity cows. Aside from extending the research to a later parity, the originality of the current paper is the inclusion of BCS data recorded during the 100 d preceding calving.
Body condition score data, on a scale from 1 (thin) to 5 (fat) at increments of 0.25 (Edmonson et al., 1989), were collected by Valacta (Sainte-Anne-de-Bellevue, Québec, Canada) field staff between January 2001 and
doi: 10.3168/jds.2010-3099
© American Dairy Science Association®, 2010 .
4398
Received January 22, 2010. Accepted May 10, 2010.
September 2008 in herds from Québec. Several edits described by Bastin et al. (2010) were performed to obtain a data set including records from herds that recorded BCS regularly and in a reliable way. Body condition score data were limited to records taken from 100 d before calving to 335 d after calving for second-parity cows. Calving ease and CS records used for the Canadian genetic evaluation were then extracted from the official database of Canadian Dairy Network (Guelph, Ontario, Canada). Records were kept for herds with at least 1 cow with both BCS records and 1 calving trait records. Only cows with at least 2 BCS records, 1 before 60 DIM and 1 after 60 DIM, were used. Moreover, at least 2 observations per class of each effect (except animal effect) were required. Descriptive statistics of the edited data set are presented in Table 1. After edits the data set contained 10,637 CE records, 10,432 CS records, and 8,032 BCS records of which 1,315 were taken before calving. Cows were from 101 herds. On average, about 4 BCS records were available per cow. Finally, pedigree data were extracted from the database used for official Canadian genetic evaluations and were limited to animals born after 1985.
Two 2-trait (BCS with either CE or CS) analyses were performed. Data used for the BCS-CE analysis included 12,632 cows of which 1,706 had records on both traits. Data used in the BCS-CS analysis included 12,427 cows of which 1,640 had both BCS and CS re-cords. The model used in both analyses was the same as the one described by Bastin et al. (2010). The model was designed to show the change of the correlation between BCS and calving traits from the dry period (100 d before calving) to the end of the following lacta-tion (335 DIM). The model included 2 fixed effects for calving traits: class of 2 yr of dam birth by season of dam birth interaction, and age at calving by season of calving by sex of calf interaction. Similarly, the fixed effects of 2 yr of calving by season of calving interac-tion and age at calving by class of 14 DIM interacinterac-tion were defined for BCS. Four groups for age at calving were defined as <38 mo, from 38 to 40 mo, from 41 to
43 mo, and >44 mo. Four seasons of birth or calving were defined as December to February, March to May, June to August, and September to November. An ef-fect accounting for BCS assessors was not included in the model because this information was not available. However, the same scoring method was used by all as-sessors and standardization took place within assessor to limit bias and errors. Random effects for CE and CS were herd by class of 2 yr of birth interaction, maternal (cow) and direct (calf) environmental effect linked with BCS, and maternal and direct genetic additive effect. Random regression effects for BCS were herd by class of 2 yr of calving interaction, permanent environmental effect, and genetic additive effect. Including an environ-mental covariance between calving traits and BCS in the model allowed for the nongenetic link between BCS and those traits to be taken into account across the lactation and avoided an overestimation of the genetic correlation between traits. The covariance structure for genetic and environmental effects was described by Bastin et al. (2010); it combined the variance for the maternal effect of calving trait, the variance for the di-rect effect of calving trait, the (co)variances for random regression components for BCS, and the covariance between maternal or direct effect of calving trait and random regression components for BCS. Covariance between maternal and direct genetic effects was set to zero as in the official genetic evaluation for calving traits run by the Canadian Dairy Network. Random effects were assumed to be normally distributed and residual variances were assumed to be independent and constant over the lactation. Regression curves for BCS were modeled using Legendre polynomials of order 2 (quadratic) defined between 100 d before calving and 335 DIM; the covariates associated with DIM (ztm)
were
zt0 = 1.0,
zt1 = 3.0 0.5
x, and
CALVING TRAITS AND BODY CONDITION SCORE
Table 1. Descriptive statistics of data for the analysis of BCS, calving ease (CE) coded from 1 (unassisted calving) to 4 (surgery), and calf survival (CS) coded as 0 if the calf died within 24 h from birth and 1 otherwise
Item
Model
BCS-CE BCS-CS
No. of BCS records 8,032 8,032
No. of calving records 10,637 10,432
Mean BCS ± SD 2.90 ± 0.49 2.90 ± 0.49
Mean calving trait ± SD 1.23 ± 0.49 0.94 ± 0.23
No. of cows with records 12,632 12,427
No. of cows with records for both traits 1,706 1,640
zt2 = 5.0 0.5 (1.5x2 − 0.5), where x= − + DIM+ + 1 2 100 335 100 , with DIM standardized from −1 to 1.
(Co)variance estimation was performed using ex-pectation maximization REML (Misztal, 2007) on the complete edited data set. Standard errors of variance components were estimated by running average infor-mation REML for 1 round using final estimates given by expectation maximization REML as priors. Herita-bilities and correlations were computed as described by Bastin et al. (2010). Standard errors of heritability and correlation estimates were calculated using the method of Fischer et al. (2004) based on variance estimates from the average information inverse matrix of the average information REML output file. Because variances and standard errors for BCS were similar in both analyses, estimates presented here are those obtained with the 2-trait analysis of BCS and CE. The expected response (Rx) to selection on a calving trait was computed using
the following formula (Falconer and Mackay, 1996): R = ihx x2 ,
x
σ
where Rx is the expected response to selection for a
calving trait [maternal CE (CEm), direct CE (CEd), maternal CS (CSm), and direct CS (CSd)]; i is the selection intensity; hx2 is the heritability of the calving trait of interest; and σx is the phenotypic standard
viation of the calving trait of interest. Because the de-sirable value for CE is low, the expected response to selection for CEm and CEd was negative. The corre-lated response (CRx) in calving traits as a result of
di-rect selection on BCS 30 d before calving was estimated using the following formula (Falconer and Mackay, 1996):
CRx = ihxhbcsrgxbcsσx,
where CRx is the correlated response to selection for
BCS in a calving trait (CEm, CEd, CSm, and CSd); i is the selection intensity; hx is the square root of the
heritability of the calving trait of interest; hbcs is the
square root of the heritability of BCS; rgxbcs is the
ge-netic correlation between the BCS and the calving trait of interest; and σx is the phenotypic standard deviation
of the calving trait.
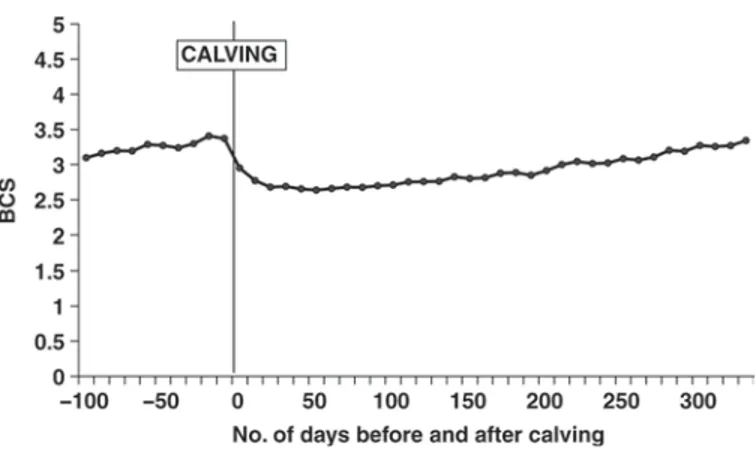
Figure 1 presents daily means of BCS from 100 d before calving to 335 d after calving. It is interesting to note that BCS increased from 100 d before calving to calving, especially during the dry period (considered to start 60 d before calving), whereas it is generally recom-mended to stabilize body condition during that period. Roche et al. (2009) indicated that first-parity animals generally failed to regain BCS postnadir as effectively as their multiparous counterparts. Therefore, the BCS increase during the period preceding the second calv-ing might be explained by the fact that the first-parity cows are managed to reach an optimal BCS at their second calving (3.5 according to Roche et al., 2009). Body condition score loss postcalving to nadir was 0.52 BCS units; BCS nadir occurred at 69 DIM. Afterward, BCS increased again until 335 DIM and reached the same level as it was at the previous calving. Sixteen percent of BCS records were collected during the 100 d before calving. Body condition score was recorded more frequently during the first 100 DIM (37% of re-cords) because it may be more useful for management purposes.
Heritability estimates for BCS across time are pre-sented in Figure 2. The 99.7% confidence interval (±3 SE) of these estimates is also presented in Figure 2 and indicated that the SE were low across DIM. Further-more, SE were higher at the end of the lactation, which is probably attributable to the nature of Legendre polynomials. Daily heritability increased constantly across time from 0.07 at 100 d before calving to 0.25 at 335 DIM; the average daily heritability throughout the period considered was 0.16. These estimates are in the same range as values reported by Dechow et al. (2001) for BCS recorded by producers and consultants on sec-ond-parity Holstein cows, using a multivariate animal model (0.07–0.20). Berry et al. (2003) presented higher estimates ranging from 0.39 to 0.51 using a random
Figure 1. Average daily BCS for Ayrshire cows from 100 d before second calving to 335 d after calving.
regression model on multilactation BCS data. Higher heritabilities in Berry et al. (2003) may be attributable to the fact that only a few trained people undertook the BCS assessments. Heritabilities for calving traits and their SE were low: 0.0202 ± 0.0003 for CEm, 0.0262 ± 0.0004 for CEd, 0.0044 ± 0.00005 for CSm, and 0.0111 ± 0.0001 for CSd. Those values were lower than the results of Jamrozik et al. (2005) for Canadian Holstein cows, especially for CEm and CEd. Differences in the models used could explain the differences observed as well as differences in the breed studied (Ayrshire vs. Holstein). Genetic correlations between BCS at differ-ent times before and after calving are shown in Table 2. Estimates ranged between 0.62 and 0.99 and decreased with increasing number of days. The genetic correlation between BCS at calving and BCS at −50 and 50 DIM was 0.96 and 0.98, respectively.
Genetic correlations between BCS and CE are pre-sented in Figure 3. The 99.7% confidence interval in-dicated that SE were low and constant over the DIM (average 0.004 and 0.006 for the correlation between BCS and CEm and CEd, respectively). The correla-tion between BCS and CEm was positive and decreased from 0.51 at 100 d before calving to 0.13 at 170 DIM; then it slightly increased until 335 DIM. Furthermore, the genetic correlation between BCS and CEd was low
and negative and ranged from −0.13 at 335 DIM to −0.01 at 100 d before calving.
Figure 4 indicates that the genetic correlations be-tween BCS and CSm and bebe-tween BCS and CSd were positive and relatively strong, and they decreased over time. The SE were low, around 0.005 for the correla-tion between BCS and CSm and from 0.002 to 0.005 for the correlation between BCS and CSd. Correlations between BCS and CSd ranged from 0.43 at 335 DIM to 0.75 at 40 d before calving. Correlations between BCS and CSm ranged from 0.27 at 335 DIM to 0.44 at 70 d before calving.
It should be noted that BCS recorded between 100 d before calving and at calving would have a causal effect on calving traits whereas BCS recorded between 1 to 335 DIM should be considered a consequence of the calving performances. Therefore, these results may indicate that a genetically high BCS before calving increased the risk of dystocia (CEm) but did not really
CALVING TRAITS AND BODY CONDITION SCORE
Figure 2. Daily heritabilities and their 99.7% confidence interval (±3 SE) for BCS in Ayrshire cows from 100 d before second calving to 335 d after calving.
Table 2. Genetic correlations between BCS based on number of days before and after calving
Item −50 0 50 100 200 300 −100 0.94 0.80 0.69 0.63 0.62 0.67 −50 1.00 0.96 0.90 0.85 0.82 0.81 0 0.96 1.00 0.98 0.96 0.93 0.87 50 0.90 0.98 1.00 0.99 0.96 0.89 100 0.85 0.96 0.99 1.00 0.98 0.91 200 0.82 0.93 0.96 0.98 1.00 0.97
Figure 3. Genetic correlations and their 99.7% confidence interval (±3 SE) of BCS from 100 d before second calving to 335 d after calv-ing with maternal calvcalv-ing ease (CEm) and direct calvcalv-ing ease (CEd).
Figure 4. Genetic correlations and their 99.7% confidence interval (±3 SE) of BCS from 100 d before second calving to 335 d after calv-ing with maternal calf survival (CSm) and direct calf survival (CSd).
influence the chance of the calf being born easily (CEd) because the genetic correlation was very low. The posi-tive genetic correlation between BCS before calving and CEm is in agreement with the common thinking that overconditioned cows before calving are at a greater risk for calving difficulty. According to Gearhart et al. (1990), cows that developed dystocia lost more body condition during the dry period than those that did not develop dystocia. Indeed, the feeding management aimed at correcting BCS of cows during the dry period and, therefore, cows losing the greatest amount of body condition before calving may have been the most over-conditioned at drying off (Gearhart et al., 1990).
Furthermore, a genetically high precalving BCS in-creased both the chance of the cow having a calf that survived (CSm) and the chance of the calf itself sur-viving (CSd). These results were in opposition to the results reported by Chassagne et al. (1999), who indi-cated that overconditioned cows would present greater risk for stillbirth than cows with an optimal BCS at calving.
Concerning the genetic relationship between calving traits and BCS during the ensuing lactation, estimates had the same sign (positive or negative) as for BCS before calving but decreased with increasing DIM, with the exception of the correlation between BCS and CEd. These results indicate that a cow that has calved with difficulty (CEm) will tend to have a higher BCS during the ensuing lactation; however,the genetic cor-relation was low to moderate (from 0.13 to 0.27). This was in contrast with the phenotypic study of Berry et al. (2007), who reported that cows that experienced dystocia lost more BCS to nadir, resulting in reduced BCS at nadir. Furthermore, results of the present study indicated that the relationship between postcalving BCS and CEd was poor and that a cow that had a calf that survived will have a genetically high BCS during the following lactation. However, Berry et al. (2007) in-dicated that incidence of stillbirths did not affect BCS in early lactation.
Some of the above results were in contrast with the literature investigating the phenotypic relationship be-tween pre- and postcalving BCS and the calving traits. This might be explained by the fact that the genetic ef-fect reflects only partly the process that regulates body condition. Roche et al. (2009) reported that lipolysis is primarily regulated genetically whereas lipogenesis is environmentally controlled. Therefore, a genetically high BCS would reflect the ability of the cow to limit the body fat mobilization rather than its ability to store fat.
Table 3 presents the expected response to selection, under the hypothesis that selection intensity is equal to 1, for CEm, CEd, CSm, and CSd as well as the
corre-lated response in the same traits as a result of selection for higher BCS 30 d before calving. First, it should be noted that to achieve favorable response of CEm, CEd, CSm, and CSd when selecting for BCS before calving, BCS has to be selected for lower values to improve CEm but for higher values to improve all other calv-ing traits. Therefore, the results indicated that uscalv-ing only BCS (and selecting for higher BCS) for improving CE is rather problematic because it would generate a nondesirable response to selection for CEm and a low response to selection for CEd. However, selecting for higher BCS to improve CS would lead to a clearly higher (183 and 203%) response to selection than se-lecting directly on CS. Given these results, efficient use of BCS to select for improved CE and CS would require the use of adapted selection indices involving all traits to counterbalance negative effects on CEm of selection for higher BCS before calving.
With the exception of the positive genetic correla-tion between CEm and BCS before calving, which emphasized the phenotypic relationship between fat cows around calving and dystocia, genetic correlations between BCS and calving traits were favorable. This seems to indicate that cows with a genetically high BCS would have a greater chance to have a calf that survives while transmitting to the calf genes that would increase chance of survival (CSd). These last statements are in line with previous research that reported that geneti-cally low BCS were related to less robust cows present-ing impaired fertility (Dechow et al., 2001; Berry et al., 2003; Bastin et al., 2010) or health disorders such as mastitis (Neuenschwander et al., 2009). Finally, results of this research indicated that BCS could be used as an indicator trait to select for maternal calving ease and calf survival and could therefore be included in selection indices.
ACKNOWLEDGMENTS
Authors are grateful to Valacta (Sainte-Anne-de-Bellevue, Québec, Canada) for providing BCS data for
Table 3. Expected direct response to selection (R) on calving traits and correlated response (CR) in calving traits as a result of selection for higher BCS at 30 d before calving1
Trait2 R CR CR/R (%) CEm −0.0098 0.0073 75 CEd −0.0127 −0.0014 11 CSm 0.0010 0.0018 183 CSd 0.0025 0.0052 203 1
Selection intensity equals 1.
2CEm = maternal calving ease; CEd = direct calving ease; CSm =
this research. Catherine Bastin acknowledges the sup-port of National Fund for Scientific Research (Brussels, Belgium) and Wallonie-Bruxelles International (CGRI-DRI, WBI, Brussels, Belgium) through grants provided for scientific stay at University of Guelph (Ontario, Canada). Additional financial support of the Ministry of Agriculture of Walloon Region of Belgium [Service Public de Wallonie, Direction générale opérationnelle “Agriculture, Ressources naturelles et Environnement” (DGA-RNE), Direction du Développement et de la Vulgarisation, Namur, Belgium] was also provided. Nicolas Gengler, who is Research Associate of the Na-tional Fund for Scientific Research (Brussels, Belgium), acknowledges this support. Additional support was provided through grants 2.4507.02F (2) and F.4552.05 of the National Fund for Scientific Research. The sup-port of DairyGen council of Canadian Dairy Network (Guelph, Ontario, Canada) and Natural Sciences and Engineering Research Council of Canada (Ottawa, Ontario, Canada) is also acknowledged. Authors are grateful to Alain Gillon (Animal Science Unit, Gem-bloux Agro-Bio Tech, University of Liège, GemGem-bloux, Belgium) as well as Jarmila Bohmanova (Center for Genetic Improvement of Livestock, University of Guel-ph) for their assistance and to Larry R. Schaeffer and Janusz Jamrozik (Center for Genetic Improvement of Livestock, University of Guelph) for their helpful com-ments and suggestions.
REFERENCES
Bastin, C., S. Loker, N. Gengler, A. Sewalem, and F. Miglior. 2010. Genetic relationships between body condition scores and reproduction traits in Canadian Holstein and Ayrshire first parity cows. J. Dairy Sci. 93:2215–2228.
Berry, D. P., F. Buckley, P. Dillon, R. D. Evans, M. Rath, and R. F. Veerkamp. 2003. Genetic parameters for body condition score, body weight, milk yield, and fertility estimated using random regression models. J. Dairy Sci. 86:3704–3717.
Berry, D. P., J. M. Lee, K. A. Macdonald, and J. R. Roche. 2007. Body condition score and body weight effects on dystocia and stillbirths and consequent effect on postcalving performance. J. Dairy Sci. 90:4201–4211.
Chassagne, M., J. Barnouin, and J. P. Chaconac. 1999. Risk factors for stillbirth in Holstein heifers under field conditions in France: A prospective survey. Theriogenology 51:1477–1488.
Dechow, C. D., G. W. Rogers, and J. S. Clay. 2001. Heritabilities and correlations among body condition scores, production traits, and reproductive performances. J. Dairy Sci. 84:266–275.
Edmonson, A. J., I. J. Lean, L. D. Weaver, T. Farver, and G. Webster. 1989. A body condition scoring chart for Holstein dairy cows. J. Dairy Sci. 72:68–78.
Falconer, D. S., and T. F. C. Mackay. 1996. Introduction to Quantitative Genetics. 4th ed. Longman, London, UK.
Fischer, T. M., A. R. Gilmour, and H. J. J. van der Werf. 2004. Computing approximate standard errors for genetic parameters derived from random regression models fitted by average information REML. Genet. Sel. Evol. 36:363–369.
Gearhart, M. A., C. R. Curtis, H. N. Herb, R. D. Smith, C. J. Sniffen, L. E. Chase, and M. D. Cooper. 1990. Relationship of changes in condition score to cow health in Holsteins. J. Dairy Sci. 73:3132– 3140.
Jamrozik, J., J. Fatehi, G. J. Kistemaker, and L. R. Schaeffer. 2005. Estimates of genetic parameters for Canadian Holstein female reproduction traits. J. Dairy Sci. 88:2199–2208.
Misztal, I. 2007. BLUPF90 family of programs. http://nce.ads.uga. edu/~ignacy/numpub/blupf90/ Accessed Jun. 2, 2009.
Neuenschwander, T. F.-O., F. Miglior, J. Jamrozik, and L. R. Schaeffer. 2009. Bivariate analyses of body condition score and health traits in Canadian Holstein cattle using a random regression model. Page 104 in Proc. 60th Annual Meeting European Association for Animal Production, Barcelona, Spain. Wageningen Academic Publishers, Wageningen, the Netherlands.
Roche, J. R., N. C. Friggens, J. C. Kay, M. W. Fisher, K. J. Stafford, and D. P. Berry. 2009. Invited review: Body condition score and its association with dairy cow productivity, health, and welfare. J. Dairy Sci. 92:5769–5801.