Accepted Manuscript
Title: Source-derived heterogeneities in the composite
(charnockite-granite) ferroan Farsund intrusion (SW Norway) Author: Jacqueline Vander Auwera Olivier Bolle Alain Dupont Christian Pin Jean-Louis Paquette Bernard Charlier Jean Clair Duchesne Nadine Mattielli Michel Bogaerts
PII: S0301-9268(14)00194-6
DOI: http://dx.doi.org/doi:10.1016/j.precamres.2014.06.003
Reference: PRECAM 4007
To appear in: Precambrian Research Received date: 9-10-2013
Revised date: 3-6-2014 Accepted date: 5-6-2014
Please cite this article as: Auwera, J.V., Bolle, O., Dupont, A., Pin, C., Paquette, J.-L., Charlier, B., Duchesne, J.C., Mattielli, N., Bogaerts, M.,Source-derived heterogeneities in the composite (charnockite-granite) ferroan Farsund intrusion (SW Norway), Precambrian Research (2014), http://dx.doi.org/10.1016/j.precamres.2014.06.003 This is a PDF file of an unedited manuscript that has been accepted for publication. As a service to our customers we are providing this early version of the manuscript. The manuscript will undergo copyediting, typesetting, and review of the resulting proof before it is published in its final form. Please note that during the production process errors may be discovered which could affect the content, and all legal disclaimers that apply to the journal pertain.
Accepted Manuscript
Source-derived heterogeneities in the composite
(charnockite-1granite) ferroan Farsund intrusion (SW Norway)
23
JACQUELINE VANDER AUWERAa*, OLIVIER BOLLEa, ALAIN DUPONTa, CHRISTIAN PINb,
4
JEAN-LOUIS PAQUETTEb, BERNARD CHARLIERa, JEAN CLAIR DUCHESNEa, NADINE
5
MATTIELLIcAND MICHEL BOGAERTSa
6
7
a
Department of Geology (B20),Université de Liège, B-4000 Liège, Belgium
8
b
Laboratoire de Géologie, Université Blaise Pascal, 5 Rue Kessler, 63038 Clermont-Ferrand,
9
France
10
c
Université Libre de Bruxelles, B-1050 Bruxelles, Belgium
11
12
* Corresponding author. Tel.:+32 4 3662253; fax: +32 4 3662029. E-mail address: 13
jvdauwera@ulg.ac.be (J. Vander Auwera). 14
15
ABSTRACT 16
The Sveconorwegian late-orogenic magmatism of southern Norway (970-916 Ma) consists of 17
two magmatic suites: the Hornblende-Biotite-Granitoids (HBG) suite and the Anorthosite-18
Mangerite-Charnockite (AMC) suite of the Rogaland Anorthosite Province (RAP), 19
characterized by opx-bearing lithologies. The Farsund body comprises elements of both suites 20
that display mingling relationships. The main facies, mostly charnockitic, contains 21
orthopyroxene whereas a subordinate granitic facies comprises hornblende and biotite. U-Pb 22
(zircon) isotopic data show overlapping ages of 931±2 Ma for the charnockitic facies and 23
926±4 Ma for the granitic facies. Both facies display similar extent of differentiation 24
demonstrating that the granitic facies was not derived by fractionation from the charnockitic 25
Accepted Manuscript
one. Mineralogical, geochemical and petrological data indicate that the charnockitic facies 26belongs to the AMC suite and the granitic facies, to the HBG suite. Strontium, Nd and Pb 27
isotopic data show that the Farsund intrusion was emplaced at the boundary between two 28
different lithotectonic units that are separated by the Farsund-RAP shear zone. This shear 29
zone likely favored the emplacement of the magmas. Most of the assimilation occurred in the 30
lower crust whereas limited differentiation likely took place in the upper crust. 31
Keywords: Sveconorwegian; Late-orogenic magmatism; U-Pb zircon age; Differentiation
32
model; Sr-Nd-Pb isotopic data 33
34
1. Introduction
35
36
Granitoid rocks are essential components of the continents and despite their rather 37
monotonous mineralogy, they have proven to be invaluable tools to decipher the structure and 38
global differentiation of the continental crust. They were previously thought as resulting from 39
the crystallization of large magma chambers at the level of emplacement (e.g. Buddington, 40
1959; Miller and Paterson, 1999), but they are now perceived by most petrologists as resulting 41
from the addition of small batches of magmas, their composite nature being cryptic in some 42
cases (e.g. Petford et al., 2000; Glazner et al., 2004; Vigneresse, 2004; Duchesne et al., 2013). 43
This interpretation is supported, among others, by isotopic data which evidence significant 44
variations in initial isotopic compositions within individual granitoids (e.g. Pressley and 45
Brown, 1999). It has also been proposed that this assemblage of magma batches may witness 46
the composition and heterogeneity of their lower crustal sources (e.g. Clemens et al., 2009). 47
Another critical question is where most of the differentiation and assimilation occurs. Recent 48
thermal modeling of the lower crust indicates that in deep crustal hot zones (Annen et al., 49
2006; Solano et al., 2012) it is possible to produce intermediate to silicic melts both by 50
Accepted Manuscript
differentiation of mafic magma intruded as sills and/or by partial melting either of the 51surrounding lower crust or of previously emplaced mafic sills (the younger ones remelting the 52
older ones). These residual and partial melts are then emplaced in the upper crust. These 53
models suggest that an important part of assimilation and/or differentiation occurs in the 54
lower crust. 55
Magmatism was abundant during the Sveconorwegian orogeny (1.1-0.93 Ga) in 56
southern Norway, most particularly during the late-orogenic period. The Farsund body 57
(Falkum et al., 1972; Falkum and Petersen, 1974; Falkum et al., 1979; Dupont et al., 2005; 58
Bolle et al., 2010) is one of the southernmost late-orogenic intrusions of this orogen. In this 59
study, we review the geology of this pluton and present new geochronological, mineral 60
chemical, geochemical and isotopic data to show that it is made up of two different 61
contemporaneous magmas, charnockitic and granitic, originating from different crustal 62
sources. We infer that most of the assimilation occurred at depth in the lower crust and that 63
magmas were rapidly transferred to their final level of emplacement without significant 64
mixing. A limited extent of differentiation took place in the upper crust. The petrology of the 65
Farsund intrusion was determined by its position close to both the Farsund-RAP shear zone 66
and the opx-in isograd related to the Sveconorwegian metamorphism. 67 68 2. Geologic setting 69 70 2.1. Regional geology 71 72
The Farsund intrusion belongs to the Sveconorwegian orogen that occupies the 73
southwestern part of the Baltic Shield and is subdivided into several segments separated by 74
large scale N-S trending crustal discontinuities (see a recent review in Bingen et al., 2008b; 75
Accepted Manuscript
Bogdanova et al., 2008) (Fig. 1). Emplacement of widespread, late-orogenic intrusions 76occurred from 0.97 to 0.92 Ga (e.g. Vander Auwera et al., 2011) after the Sveconorwegian 77
regional metamorphism that took place from 1.035 to 0.97 Ga (Bingen et al., 2008a) and 78
grades from greenschist or epidote-amphibolite-facies in the NE to granulite facies in the SW. 79
Two late-orogenic magmatic suites have been recognized based on petrography and 80
geochemistry (Vander Auwera et al., 2003) (Figs. 1-2): an Anorthosite-Mangerite-81
Charnockite (AMC) suite (e.g. Demaiffe et al., 1986; Wilson et al., 1996; Duchesne, 2001; 82
Bolle and Duchesne, 2007) and a suite of granitoids characterized by the abundance of 83
hornblende and biotite (HBG suite) (e.g. Andersson et al., 1996; Andersen et al., 2001; 84
Vander Auwera et al., 2003). The AMC suite is restricted to the westernmost and warmest 85
part of the orogen, where it forms the Rogaland Anorthosite Province (RAP), whereas the 86
granitoids of the HBG suite were emplaced in the rest of southern Norway. Three intrusions, 87
including the Farsund body, identified as composite intrusions on Fig. 1 display petrographic 88
facies corresponding to the two suites. The HBG suite is slightly older (970±6 to 932±4 Ma) 89
than the AMC suite (932±9 to 916±9 Ma) (U-Pb on zircon: Pasteels et al., 1979; Schärer et 90
al., 1996; Andersen et al., 2002; Bingen et al., 2006; Andersen et al., 2007; Vander Auwera et 91
al., 2011) but the end of the the HBG magmatic event (932±4 Ma) corresponds to the 92
beginning of the AMC suite (932±9 Ma). As synthesized by Vander Auwera et al. (2011), the 93
AMC suite is anhydrous and contains dominant orthopyroxene together with clinopyroxene, 94
whereas the HBG suite has a significant H2O content (e.g. Bogaerts et al., 2006) stabilizing 95
hornblende and biotite. Titanite is also a characteristic phase of many intrusions in the HBG 96
suite whereas clinopyroxene is scarce and has only been observed as relic cores within 97
amphibole (Bogaerts et al., 2003a; Bolle et al., 2003b; Vander Auwera et al., 2003). Available 98
data also indicate that the HBG suite has a higher oxygen fugacity than the AMC suite, which 99
translates into a higher magnetite/ilmenite ratio in the HBG suite (Vander Auwera et al., 100
Accepted Manuscript
2011) and a pronounced positive magnetic signature on aeromagnetic surveys (Andersson et 101al., 1996). The HBG and AMC differentiation trends are similar, except that the AMC trend 102
has a higher FeOt/MgO and K2O content and lower CaO, Sr, U, Th than the HBG trend 103
(Vander Auwera et al., 2011). Based on radiogenic isotope data (Sr, Nd and Pb), two different 104
crustal components, C1 and C2, have been recognized in the Sveconorwegian late-orogenic 105
magmatism (Andersen et al., 1994; Andersen and Sundvoll, 1995; Knudsen et al., 1997; Bolle 106
et al., 2003a; Vander Auwera et al., 2003; Vander Auwera et al., 2008). The igneous rocks 107
with the C1 fingerprint display radiogenic initial Sr and Pb isotopes, and mildly unradiogenic 108
initial epsilon Nd values (Sri = 0.735, εNdt = -4.9). C1 was calculated as the average Sr-Nd 109
isotopic composition of the Pre-Sveconorwegian rocks from southern Norway and was 110
estimated from the isotopic composition of representative samples of the Pre-Sveconorwegian 111
gneisses of the Rogaland/Vest Agder sector (Menuge, 1988; Vander Auwera et al., 2003) and 112
of high-grade metasediments from the Bamble sector (Andersen et al., 1995; Knudsen et al., 113
1997). In contrast, samples with the C2 signature have lower initial Sr and Pb isotopic ratios, 114
combined with even less radiogenic Nd (Sri = 0.712, εNdt = -7.8). The C2 component 115
corresponds to the source region of the Ubergsmoen augen gneiss unit outcropping in the 116
Bamble sector (1.12 Ga) (Andersen et al., 1994). Andersen et al. (2001) suggested indeed 117
that, in southern Norway, the deep continental crust has a rather uniform composition similar 118
to the source of this unit. The C1 component has been mostly recognized in the AMC suite 119
whereas C2 is more typical of the HBG suite. As a major crustal shear zone, the Farsund-RAP 120
shear zone (Bolle et al., 2010), has been identified in the eastern part of the RAP and is 121
broadly coincident with the boundary between the AMC and HBG domains (Fig. 2), it has 122
been proposed that this steeply dipping shear zone separates two different lithotectonic units 123
(Bolle et al., 2010; Vander Auwera et al., 2011). 124
Accepted Manuscript
Both the AMC and HBG suites display limited volumes of mafic lithologies, 125gabbronorites in the HBG suite, primitive opx-bearing monzodiorites (jotunites) and high-Al 126
gabbros in the AMC suite, which display strikingly similar geochemical and radiogenic 127
isotope (Sr, Nd, Pb) compositions (Demaiffe et al., 1990; Vander Auwera et al., 2003; Vander 128
Auwera et al., 2008; Charlier et al., 2010; Vander Auwera et al., 2011). This observation and 129
experimental studies performed on these rock-types (Fram and Longhi, 1992; Longhi et al., 130
1999) led Vander Auwera et al. (2011) to propose that they were derived by partial melting of 131
similar lower crustal sources. These inferred lower crustal protoliths were interpreted to 132
reflect a previous important mafic underplating having occurred in the 1.05 to 1.5 Ga period 133
(Schiellerup et al., 2000; Vander Auwera et al., 2011). Vander Auwera et al. (2011) also 134
emphasized the role of the subsequent Sveconorwegian regional metamorphism (from 1.035 135
to 0.97 Ga: Bingen and van Breemen, 1998) in modifying these underplated magmas before 136
the start of the late-orogenic magmatism (0.97 to 0.916 Ga). Indeed, lower crustal segments 137
were variably metamorphosed as granulite facies conditions prevailed in the westernmost part 138
of the orogen, west of the opx-in isograd. The higher grade metamorphism produced the 139
dehydrated lower crustal sources of the AMC suite, whereas the more hydrated sources of the 140
HBG suite were preserved east of this isograd. The composition of the Sveconorwegian late-141
orogenic magmatism thus appears to have been controlled by two boundaries, the 142
Sveconorwegian opx-in isograd and the Farsund-RAP shear zone (Fig. 2). Igneous bodies 143
formed west of the opx-in isograd have anhydrous parageneses (orthopyroxene present), 144
whereas those formed east of this isograd have hydrated parageneses (amphibole). West of the 145
Farsund-RAP shear zone, the effect of the C1 isotopic component is detected in the 146
differentiation trend, whereas east of this shear zone, the C2 signature is observed. 147
148
2.2. The Farsund intrusion
Accepted Manuscript
150The Farsund intrusion (ca. 105 km2: Bolle et al., 2010) is the type locality for 151
“farsundite” (Kolderup, 1903), a term proposed as a synonym of hypersthene monzogranite 152
but finally abandoned in the Streckeisen classification (Streckeisen, 1974) (Fig. 2). Its 153
southern contact, partly covered by quaternary moraines, has been redefined southwards by 154
Bolle et al. (2010) (Fig. 3). The pluton borders the Lyngdal granodiorite belonging to the 155
HBG suite to the east and the Hidra leuconorite belonging to the AMC suite to the west. It 156
was thus emplaced at the boundary between the AMC and HBG domains. Moreover, the 157
Farsund intrusion is in contact with banded gneissic rocks (Falkum, 1998) that are in 158
amphibolite facies to the NE and in granulite facies to the south (Falkum et al., 1979; Falkum, 159
1982, 1998). Consequently, the pluton also straddles the Sveconorwegian opx-in isograd (Fig. 160
2). The Farsund intrusion is separated from the Lyngdal granodiorite and the Hidra 161
leuconorite by a thin unit of gneisses (Falkum et al., 1979; Marker et al., 2003). 162
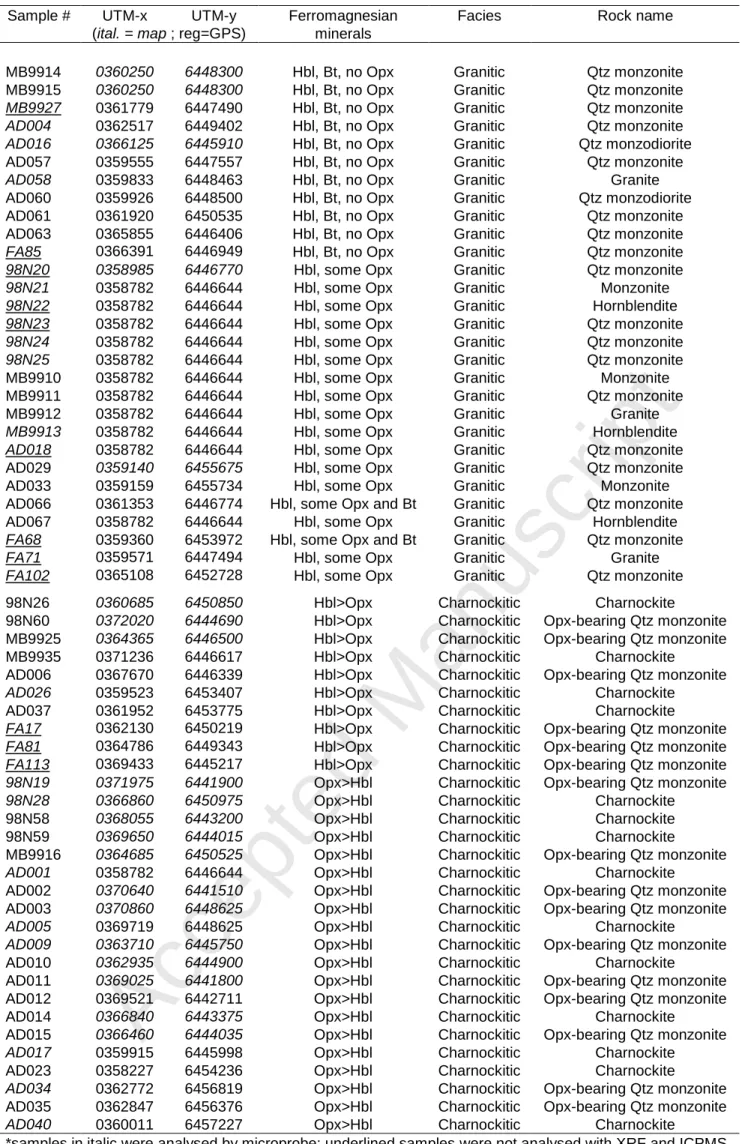
Macroscopic and microscopic observations indicate that the Farsund intrusion has a 163
dominant facies which is dark and contains orthopyroxene, and a subordinate facies 164
significantly lighter in color and containing hornblende and biotite (Fig. 3). These two facies 165
display a range of composition (Table 1) from intermediate (opx-bearing quartz monzonitic 166
versus monzonitic) to silicic (charnockitic versus granitic) but will be referred to as 167
charnockitic (Frost and Frost, 2008a) and granitic, respectively. The two facies are 168
intermingled at various scales with frequent lobate contacts between them. Coarse- (average 169
grain size of 2-4 mm) and fine-grained (1-2 mm) varieties have been recognized within both 170
facies and are also locally mingled. A particularly well exposed example of mingling within 171
the granitic facies is at Jøllestø, on the western coast (Fig. 3). There, a coarse-grained quartz 172
monzonite is mingled with a finer-grained monzonite containing cm-sized plagioclase similar 173
to those observed in the coarse grained quartz monzonite. The latter also contains lenticular 174
Accepted Manuscript
enclaves of opx-bearing hornblendites several cm to several dm in size (Fig. 4A). These 175hornblendites essentially contain mafic minerals (hornblende, Fe-Ti oxides, apatite, zircon 176
and orthopyroxene) and are interpreted as cumulate segregations. 177
The Farsund intrusion displays three other types of enclaves. The most abundant are 178
angular enclaves, several cm to m in size, interpreted as fragments from the banded gneissic 179
country-rocks (Fig. 4B). Less abundant leucogranitic enclaves, several dm in size, with 180
diffuse contacts with the enclosing rock have also been observed. Rare cm- to dm- lobate 181
microgranular enclaves (MME: Barbarin and Didier, 1992) also occur. A large body (3km2) 182
of banded gneiss has been mapped in the center of the intrusion (Fig. 3). It could correspond 183
to a roof pendant or a pinnacle from the underlying floor (Bolle et al., 2010). Its contacts with 184
the Farsund intrusion are not exposed. Thin (cm to dm-thickness) dikes of aplites and 185
pegmatites have very locally been observed, mostly in the charnockitic facies. 186
A detailed structural study, based on the anisotropy of magnetic susceptibility (AMS) 187
technique and combined with micro- to macrostructural observations, showed that near the 188
contacts the Farsund intrusion is concordant with the regional structure displayed by the 189
surrounding gneisses (Bolle et al., 2010). Minerals show microscopic textures resulting from 190
ductile deformation: undulous extinction of quartz and feldspars, subgrains in quartz, curved 191
polysynthetic twins in plagioclase, kinked orthopyroxene. The structural data also revealed 192
the steeply dipping Farsund shear zone (Bolle et al., 2010) that straddles the NE border of the 193
intrusion (Fig. 2). This shear zone has been interpreted as part of a major structure, the 194
Farsund-RAP shear zone located east of the RAP (Bolle et al., 2010). 195
196
3. Petrography and mineral chemical composition
197
198
3.1. Petrography
Accepted Manuscript
200As shown by Middlemost (1968), Falkum et al. (1979) and Bolle et al. (2010), 201
amphibole, plagioclase, alkali feldspar, quartz, magnetite, ilmenite, apatite and zircon are 202
observed in all samples whereas orthopyroxene, biotite and titanite are not ubiquitous. In the 203
charnockitic facies, the ferromagnesian minerals are orthopyroxene and hornblende with 204
locally some clinopyroxene and/or biotite (Fig.4 C-D). Titanite is absent and the proportion of 205
ilmenite is generally higher than that of magnetite. Zircon and apatite occur as euhedral 206
inclusions, mostly in orthopyroxene but also in feldspars and opaques (Fig. 4 C-D). Opaques 207
are usually anhedral, associated with pyroxenes and locally surrounded by a thin rim of 208
amphibole. The orthopyroxene (modal abundance of 7 to 25 %) is slightly poikilitic. It 209
contains one or two sets of clinopyroxene exsolution (inverted pigeonite) (Fig. 4 D). 210
Clinopyroxene also occurs as individual grains and some of these grains are clearly external 211
granules. Plagioclase (modal abundance of 20 to 25%) is anhedral to subhedral and where 212
locally included in K-feldspar, it displays lobated contours. K-feldspar (modal abundance of 213
20 to 25%) is locally a microcline, finely perthitic and contains inclusions of quartz, 214
pyroxenes, opaques, zircon and apatite. Myrmekites at feldspar grain boundaries have been 215
observed. Quartz (modal abundance of 10 to 25%) occurs as small rounded grains or crystals 216
displaying irregular contours. The proportion of amphibole varies greatly and is either higher 217
or lower than that of orthopyroxene (Fig. 3). Accordingly, some samples displaying a very 218
low amount of orthopyroxene and locally biotite have been included in the granitic facies (see 219
Table 1). The petrographic textures suggest early crystallization of apatite and opaques 220
followed by orthopyroxene, plagioclase and zircon. In the granitic facies, the ferromagnesian 221
minerals are hornblende (Fig. 4 E-F) and biotite with generally much more amphibole than 222
biotite, titanite is abundant in many samples and the proportion of magnetite is usually higher 223
than that of ilmenite. Petrographic textures are similar to the charnockitic facies. Amphibole 224
Accepted Manuscript
(modal abundance of 20 to 30%) is mostly anhedral to subhedral locally poikilitic displaying 225interstitial contours toward feldspars and quartz. Apatite, opaques locally surrounded by a thin 226
rim of titanite, zircon and amphibole form clusters. The abundance of biotite varies from none 227
to a few grains to a few percents. It is strongly pleochroic from light brown to deep reddish 228
brown, mostly hypidiomorphic but locally shows interstitial contacts with feldspars and 229
quartz. It has also been observed surrounding opaques and locally partly included in 230
amphibole. The order of crystallization is similar to the one deduced for the charnockitic 231
facies except that the orthopyroxene is replaced by amphibole. The crystallization of biotite 232
seems to be penecontemporaneous with or slightly later than amphibole. 233
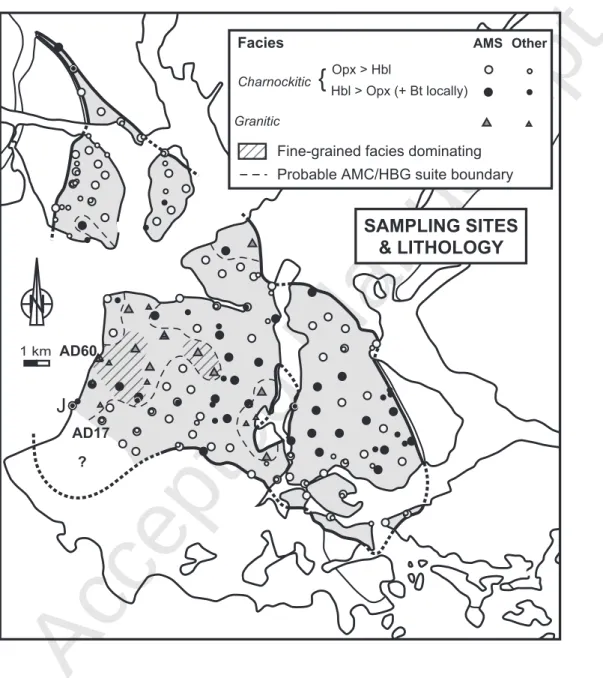
The granitic facies displays no regular distribution within the intrusion as it occurs in 234
the west and central parts as well as close to the northeastern margin (Fig. 3). It is possible 235
that the contours of the domains occupied by the two facies of the Farsund intrusion may not 236
have retained their magmatic aspect as they have been modified by the late subsolidus 237
deformation (Bolle et al., 2010). 238
239
3.2. Mineral composition
240
241
Amphiboles are hastingsite except for one sample plotting in the edenite field (Fig. 5A 242
- Supplementary Table S1A). The amphiboles from the charnockitic and granitic facies have 243
significantly different Mg#’s (charnockitic: Mg# = 0.22-0.31; granitic: Mg# = 0.39-0.60) that 244
partly overlap with the Mg#’s of the amphiboles from the AMC and HBG suites, respectively. 245
Their fluorine content ranges from 0.17 a.p.f.u. up to 1.11 a.p.f.u. and increases with their 246
Mg# (Fig. 5B). This Fe2+-F avoidance, also observed in micas, has been explained by the 247
crystal field theory, the crystal field splitting parameter being lower when Fe2+ is coordinated 248
to F- rather than to OH- (Rosenberg and Foit, 1977). 249
Accepted Manuscript
Most low-Ca pyroxenes are ferrosilite whereas clinopyroxenes range from augite to 250hedenbergite (Morimoto, 1989). Heretoo, two groups of pyroxenes with low and high Mg#’s 251
can be recognized (Fig. 5C-D, - Supplementary Table S1B-S1C) with the former overlapping 252
in composition those of the AMC suite. In the HBG suite, clinopyroxenes (diopside) only 253
occur as relic cores in amphiboles and have a higher Mg# than the clinopyroxenes from the 254
Farsund intrusion. 255
The Fe# of biotite ranges from 0.50 to 0.76 (Fig. 5E - Supplementary Table S1D). 256
Biotites from the Farsund samples have relatively elevated Fe# compared with biotites from 257
the HBG suite, in agreement with what is observed for the amphiboles. Also, there is a 258
general decrease of F/Cl versus Fe# for all samples, illustrating the same Fe2+-F avoidance as 259
in amphiboles (Rosenberg and Foit, 1977), but the trend is not well defined (Fig. 5F). Ti 260
a.p.f.u. ranges from 0.4 to 0.6 indicating high temperatures of equilibration (Henry et al., 261
2005). 262
The composition of plagioclase (An24 to An29) is similar to the values observed in the 263
HBG (An15-31: Vander Auwera et al., 2003) and AMC suites (An19-40: Bolle and Duchesne, 264
2007) (Supplementary Table S1E-F). Temperatures estimated with the two-feldspar 265
thermometer of Putirka (2008) are low (650-700°C) indicating that the feldspars re-266
equilibrated down to subsolidus conditions in agreement with the observed narrow range of 267
composition and the experimental data of Bogaerts et al. (2006). 268
269
4. Whole-rock Geochemistry
270
271
Both facies recognized in the Farsund intrusion are ferroan, metaluminous and most 272
samples straddle the boundary between the calc-alkalic and alkali-calcic fields of the MALI 273
index (Frost et al., 2001; Frost and Frost, 2008b) (Fig. 6). The Farsund charnockite thus 274
Accepted Manuscript
belongs to the group of ferroan charnockites that are frequently associated with AMCG suites 275(Emslie et al., 1994; Rajesh, 2007; Frost and Frost, 2008a; Rajesh, 2012). Samples overlap the 276
fields of quartz monzonite and granite in the Ab-An-Or diagram (Fig. 7) and display high 277
contents of Ga (Ga*10000/Al > 2.6) and incompatible elements (Zr+Nb+Ce+Y > 350 ppm) 278
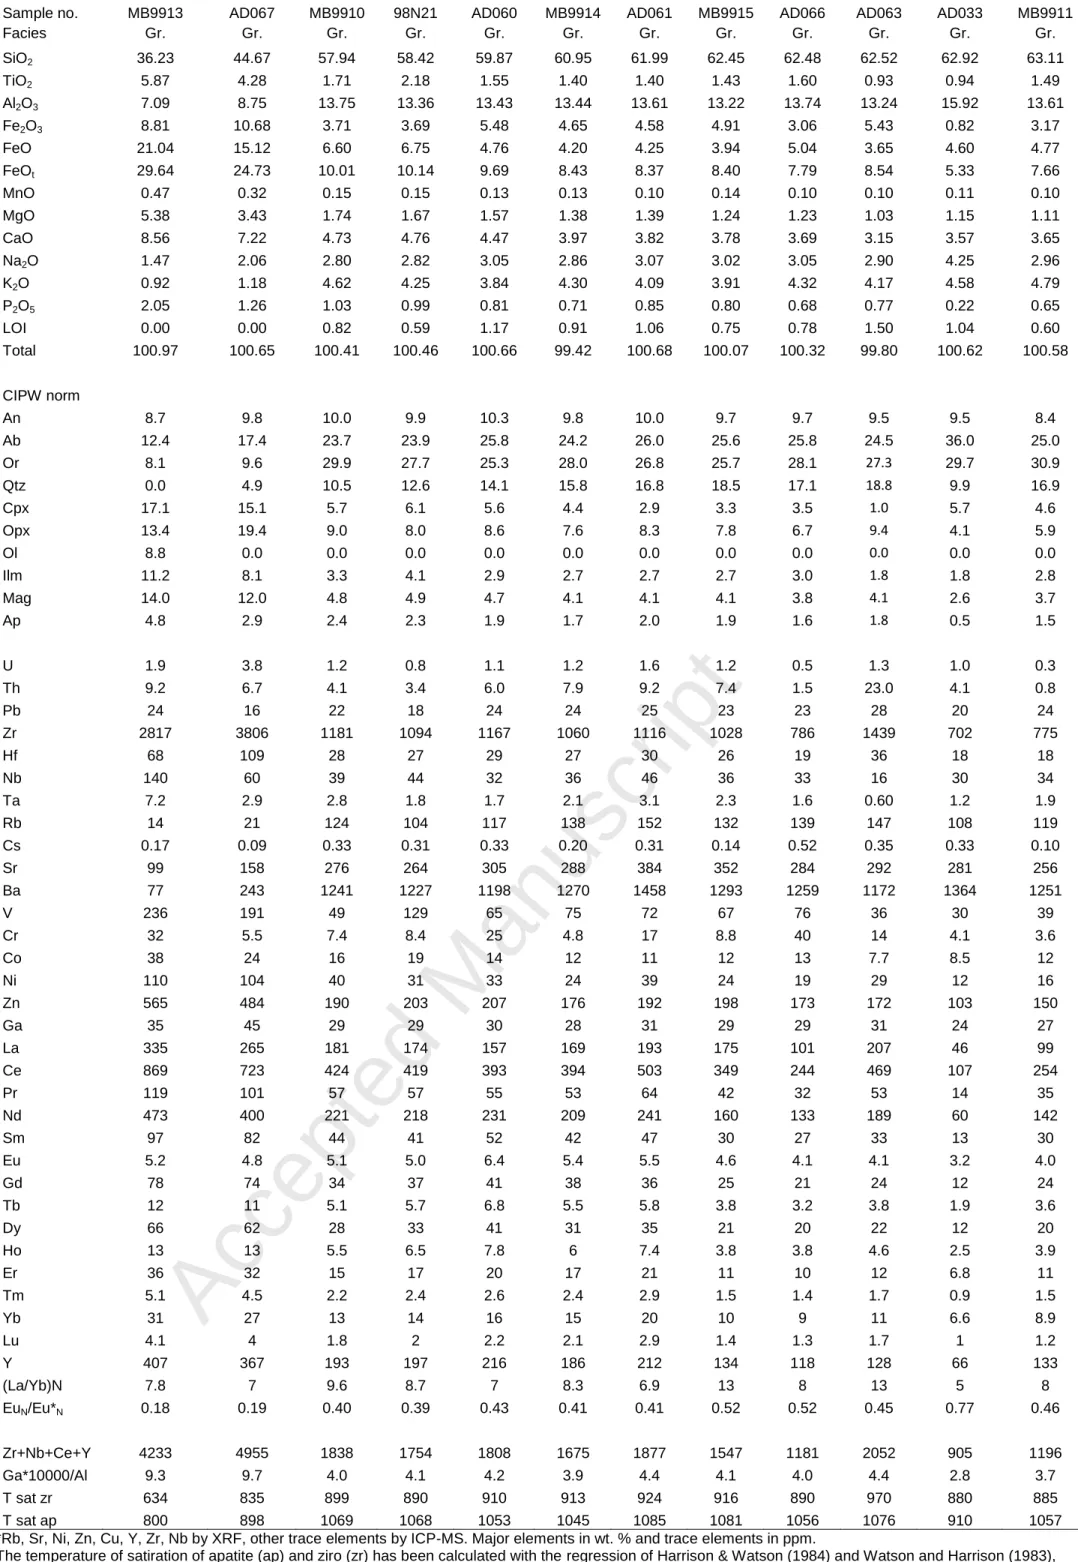
(Whalen et al., 1987) (see Table 2). 279
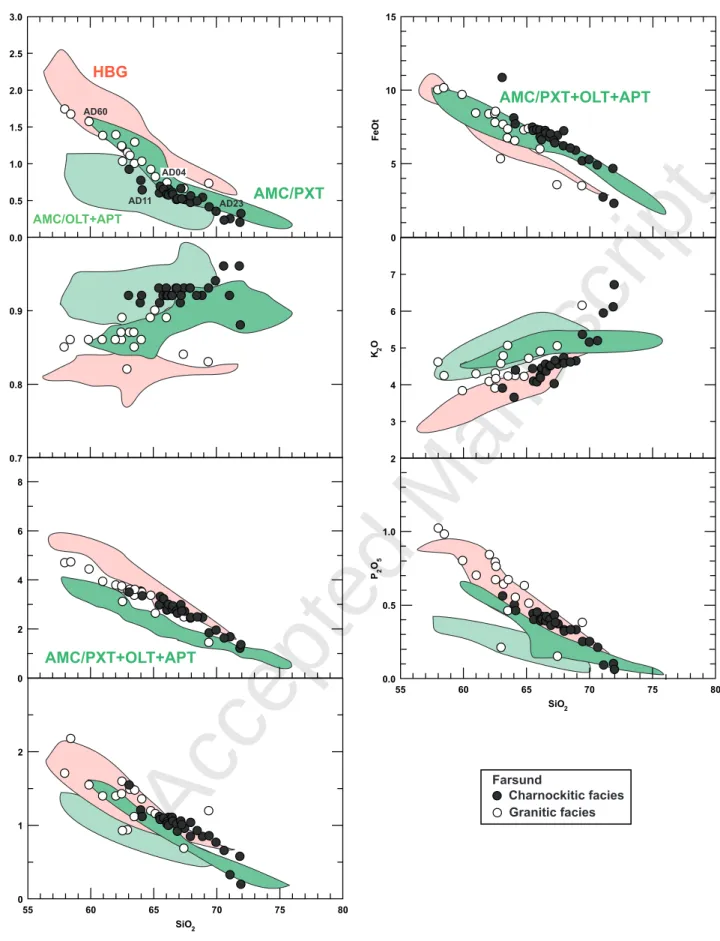
The Farsund differentiation trends display decreasing MgO, FeOt, MnO (not shown), 280
CaO, TiO2, P2O5 and increasing K2O with increasing SiO2 (Fig. 8). Both facies display similar 281
extent of differentiation (granitic facies: 59.9 to 69.4 wt wt. % SiO2; charnockitic facies: 63.1 282
to 71.9wt. % SiO2) indicating that the granitic facies was not produced by differentiation from 283
the charnockitic one. The two facies have similar major element contents. However, the 284
charnockitic facies has slightly higher contents of FeO and MnO that translate into higher 285
FeOt/(FeOt+MgO) ratios. These small differences are the same as those observed at a larger 286
scale between the AMC and HBG suites (Fig. 8). However, the two facies have overlapping 287
compositions in CaO and K2O that plot between the HBG and AMC trends. 288
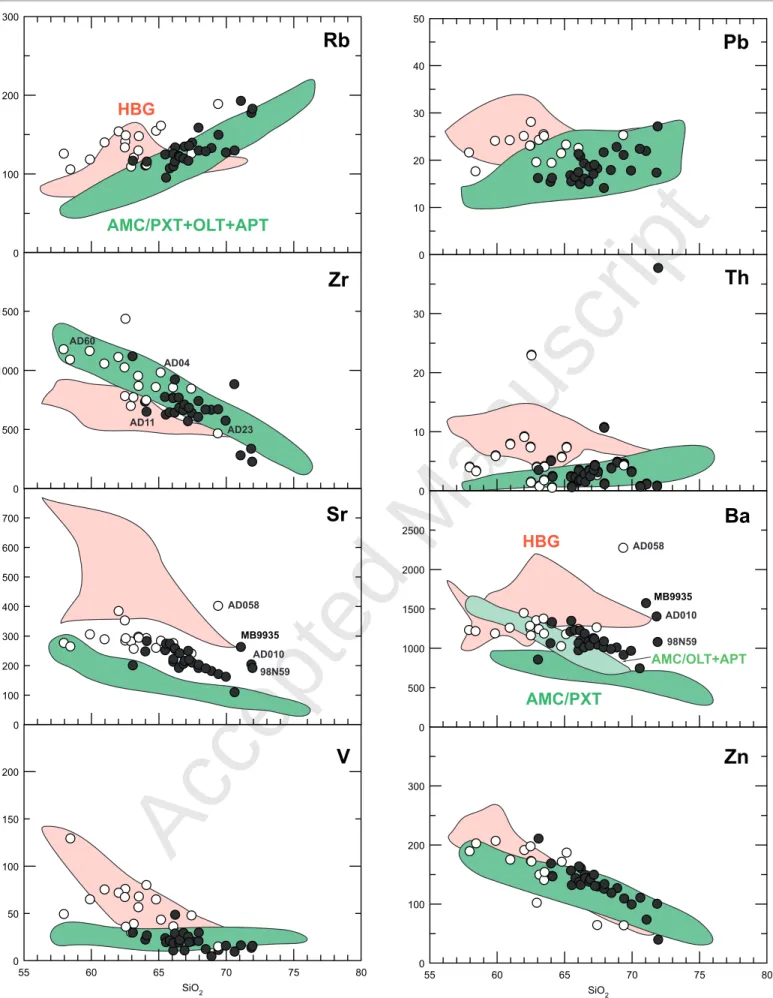
The granitic facies has higher Rb, Pb, Th and V than the charnockitic facies (Fig. 9). 289
Again these differences are the same as those observed between the AMC and HBG suites 290
(Fig. 9). Nevertheless, both facies have a similar Sr content that plot between the HBG and 291
AMC trends. 292
The charnockitic and granitic facies have REE patterns displaying some fractionation 293
of the LREE and a negative Eu anomaly (Fig. 10). The REE patterns of the granitic facies 294
show slightly higher LREE fractionation and more pronounced negative Eu anomalies than 295
the charnockitic facies (La/YbN = 5 to 14.5 and Eu/Eu*= 0.18 to 0.77 in the granitic facies; 296
La/YbN = 3.8 to 9.7 and Eu/Eu* = 0.36 to 1.02 in the charnockitic facies). These differences 297
are also observed between the HBG (La/YbN = 5.18 to 15.66; Eu/Eu* = 0.37 to 1.1) and AMC 298
(La/YbN = 3.7 to 10.5; Eu/Eu* = 0.21 to 1.1) suites (Fig. 10). Several samples (AD003, 299
Accepted Manuscript
AD034, AD010 in the charnockitic facies) display positive Eu anomalies (Fig. 10 and Table 3002) and/or Sr and Ba contents significantly higher (98N59, AD010, MB9935 in the 301
charnockitic facies; AD058 in the granitic facies) than the differentiation trend suggestive of 302
some accumulation of feldspar. Sample AD058 from the granitic facies displays a lower REE 303
content than the other samples from the same facies as it is the most differentiated one (69.36 304
wt.% SiO2). The REE data presented by Petersen (1980) for a few samples of the Farsund 305
intrusion are similar to those of the charnockitic facies (Fig. 10). . 306
307
5. Geochronology and radiogenic isotopes
308
309
Samples AD17 and AD60, selected for geochronology, are typical examples of 310
respectively the charnockitic and granitic facies and have been collected in different areas of 311
the intrusion (Fig. 3). No mingling was observed at the location of sample AD17 whereas 312
mingling within the granitic facies, between coarse and fine-grained varieties, has been 313
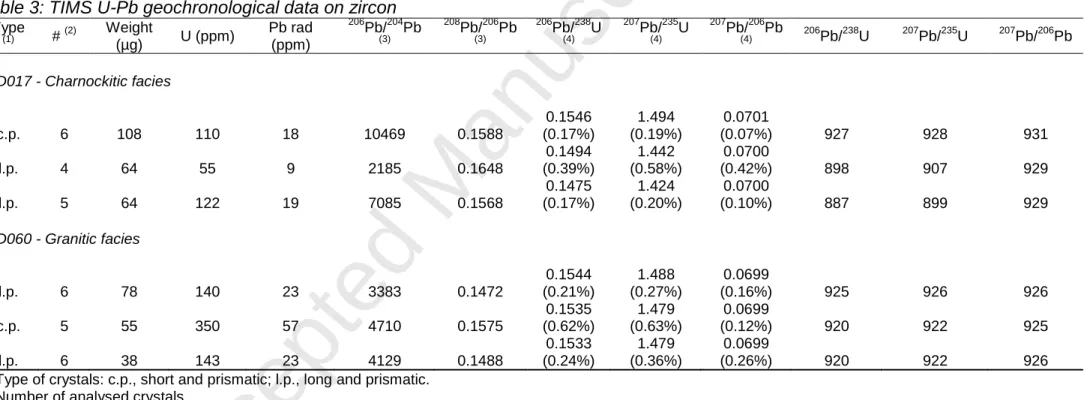
observed in the area of sample AD60. The three fractions of zircon from samples AD17 314
(charnockitic facies) and AD60 (granitic facies) display small degree of discordance (from 315
negligible for AD60 up to 5% for AD17). The upper intercepts of the Concordia curve, 931±2 316
Ma for AD17 (charnockitic facies) and 926±4 Ma for AD60 (granitic facies) (Fig. 11, Table 317
3), are interpreted as crystallization ages, while the lower intercepts are considered to be 318
geologically meaningless. These new geochronological data are in agreement with the range 319
of 920 to 940 Ma previously proposed by Pasteels et al. (1979) based on U-Pb zircon data 320
from sample PA70A and with geological observations (Falkum et al., 1972; Falkum et al., 321
1979; Bolle et al., 2010) which indicate that the Farsund intrusion is younger than the Lyngdal 322
hornblende- and biotite-bearing granodiorite (HBG suite) dated at 950 ± 5 Ma (U-Pb zircon 323
age; Pasteels et al., 1979). The ages of the granitic and charnockitic facies overlap within 324
Accepted Manuscript
analytical errors and show that the Farsund body was emplaced at a time corresponding to the 325end of the HBG magmatic event (932±4 Ma) and the beginning of the AMC suite (932±9 Ma) 326
(see review by Vander Auwera et al., 2011). The mingling relationships observed in the field 327
between the two facies indicate their coeval character but it could be speculated that although 328
there is a 1 Ma overlap of the analytical uncertainties at the 95% confidence level, the granitic 329
venue, exemplified by sample AD60, corresponds to a slightly younger batch of this facies. 330
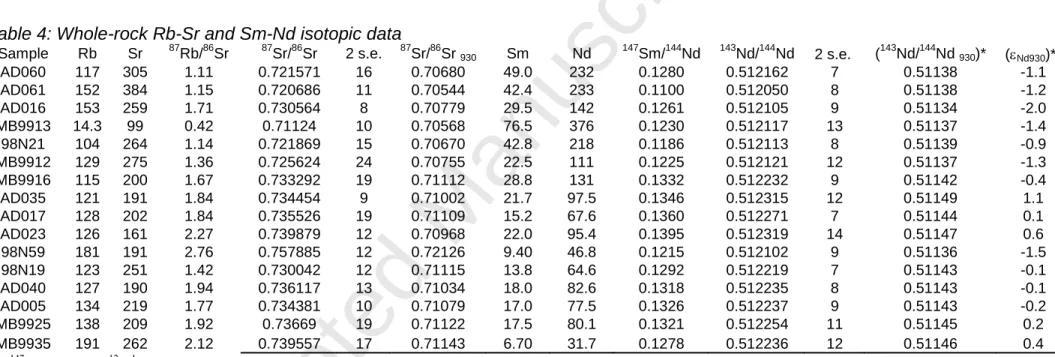
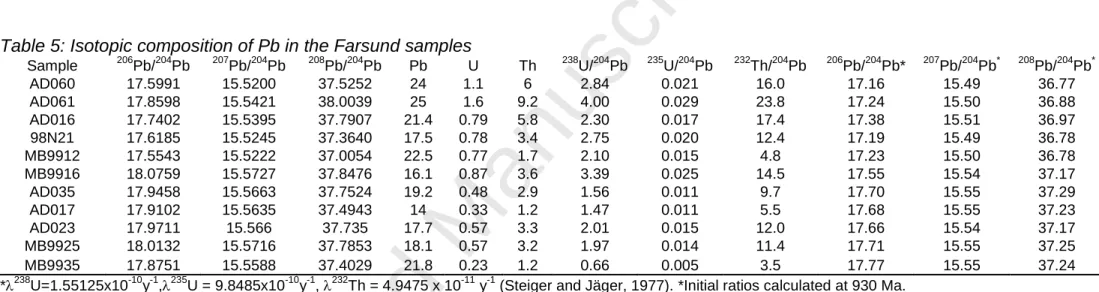
As can be seen in the εNdt vs. (87Sr/86Sr)930 (Table 4, Fig. 12A) and (207Pb/204Pb)930 vs. 331
(206Pb/204Pb)930 (Table 5, Fig. 12B) diagrams, the granitic and charnockitic facies show 332
significant differences. Specifically, the granitic facies has mildly negative epsilon Nd (1 to -333
2) and relatively low Srinitial ratios (0.7054-0.7078) implying source materials that were both 334
weakly enriched in LREE (moderate Sm/Nd), and in Rb relative to Sr (moderate Rb/Sr), on a 335
time-integrated basis. In contrast, in the charnockitic facies, the initial Srisotope signature is 336
significantly more radiogenic, with 0.7097 < (87Sr/86Sr)930 < 0.7111 (with one sample as high 337
as 0.7213, possibly reflecting an inaccurate correction of 87Sr ingrowth since 930 Ma), while 338
initial epsilon Nd values scatter around zero (mean = -0.1 and SD = 0.7, for 8 data). These 339
data imply that the bulk source for that group of samples was characterized by almost 340
unfractionated LREE, combined with relatively high Rb/Sr ratios. Moreover, the 341
(207Pb/204Pb)930 and (206Pb/204Pb)930 are higher in the charnockitic facies compared to values in 342
the granitic facies. These differences in isotopic composition mimic those observed between 343
the AMC and HBG suites (Fig. 12A-B). 344
345
6. Discussion
346
347
Mineralogy, mineral compositions, whole-rock major and trace element data as well as 348
geochronological and isotopic data clearly indicate that the Farsund intrusion was built by the 349
Accepted Manuscript
mingling of two coeval magmas, the charnockitic and granitic facies, that respectively belong 350to the AMC and HBG suites. This conclusion is in agreement with the emplacement of the 351
Farsund body at the boundary between the two domains occupied by the AMC (in the west) 352
and HBG (in the east) magmatic suites (Fig. 2) and at a time corresponding to the temporal 353
switch from the HBG to the AMC suite. Consequently, when discussing the sources of the 354
magmas, the differentiation processes and the crystallization conditions, we will consider two 355
different parental magmas with reference to previous work made on the AMC and HBG 356
suites. 357
358
6.1. Sources of the Farsund magmas
359
360
The least differentiated compositions of the granitic and charnockitic facies are, 361
respectively, a quartz monzodiorite (sample AD60) and an opx-bearing quartz monzonite 362
(sample AD011). In a previous study discussing the origin of the ferroan granitoids of the 363
HBG suite and using the experimental data of Beard and Lofgren (1991) and Sisson et al. 364
(2005) together with geochemical data, Vander Auwera et al. (2008) showed that a quartz 365
monzodioritic composition very similar to the AD60 quartz monzodiorite could be produced 366
either by partial melting or by fractional crystallization from a mafic (amphibolitic) 367
composition but recognized that the partial melting process produces a better fit of the trace 368
element data. Similarly, using experimental data acquired on opx-bearing monzodioritic 369
(jotunitic) composition, Vander Auwera et al. (1998) showed that a an opx-bearing quartz 370
monzonitic composition like sample AD011 could be produced by partial melting of or by 371
fractional crystallization from an anhydrous mafic source in reducing conditions. It is also 372
possible that both processes, fractional crystallization and partial melting, occurred 373
simultaneously. In Farsund, no mafic (gabbroic) composition has been observed suggesting 374
Accepted Manuscript
that in this case, partial melting could the dominant process. Partial melting of lower crustal 375sources has also been proposed by Emslie et al. (1994), Rajesh and Santosh (2004) and 376
Rajesh (2007) as a plausible process to produce ferroan charnockitic magma. 377
378
6.2. Differentiation of the Farsund magmas
379
380
The charnockitic and granitic facies display a differentiation trend from 63.1 to 71.9 381
wt.% SiO2 and from 59.9 to 69.4 wt.% SiO2, respectively. A detailed discussion of the 382
possible differentiation processes (see Supplementary material) shows that fractional 383
crystallization was the dominant process. The same conclusion was reached for the 384
charnockites of the nearby Bjerkreim-Sokndal layered intrusion and the Apophysis, both 385
belonging to the AMC suite (Duchesne and Wilmart, 1997; Bolle and Duchesne, 2007). 386
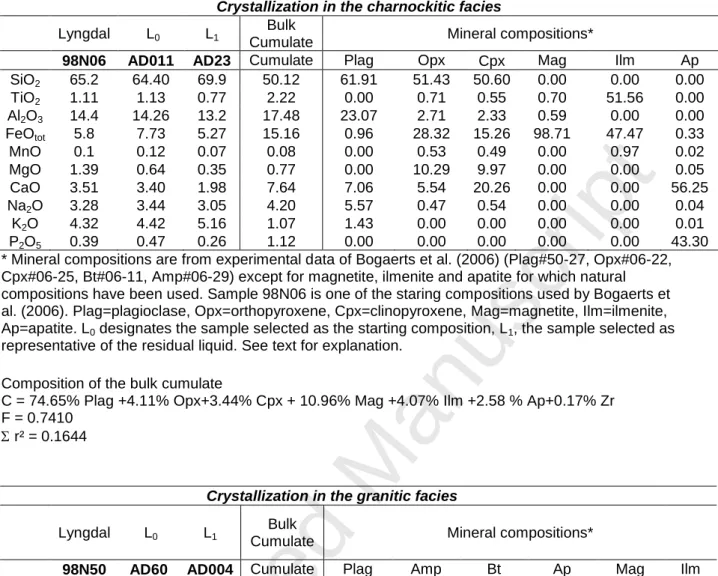
In order to model the fractional crystallization process, the least and most 387
differentiated samples belonging to both facies have been selected. Samples in which some 388
accumulation of feldspar (see section 4) may have occurred, have not been considered in the 389
modeling. In the charnockitic facies, sample AD011 (64.4 wt.% SiO2) was considered as a 390
plausible starting composition (L0) and sample AD23 (69.9 wt.% SiO2) as the residual liquid 391
(L1). Mineral compositions were mostly selected among the experimental phases obtained by 392
Bogaerts et al. (2006) because sample 98N06 (64.8 wt.% SiO2) used by these authors has a 393
similar composition to AD011 (see Table 6) and because a larger range of mineral 394
compositions is available in the experimental dataset thus enabling to select intermediate 395
mineral compositions. The least square regression method indeed calculates a bulk cumulate. 396
Subtraction of a cumulate composed of plagioclase (74.7%), orthopyroxene (4.1%), 397
clinopyroxene (3.4%), ilmenite (4.1%), magnetite (11%) and apatite (2.6%) drives the liquid 398
from L0 to L1 after 26% of crystallization with Σr2 of 0.16 (Table 6). This calculated cumulate 399
Accepted Manuscript
compares rather well with the experimental data of Bogaerts et al. (2006) on 98N06, except 400that it has a significantly higher proportion of plagioclase and a lower proportion of 401
clinopyroxene than observed in the experimental charges (experimental charge 06-27: 53% 402
plagioclase, 4% orthopyroxene, 10% clinopyroxene, 3% ilmenite, 6% magnetite, 2% apatite 403
and 22% biotite). Since the liquidus of the plagioclase is significantly reduced when H2O 404
increases in the melt, we interpret the above discrepancies as resulting from a higher 405
proportion of H2O in the experimental charge (4.2 wt.%) compared to the Farsund magma. 406
This induces a lower proportion of plagioclase and thus a higher proportion of clinopyroxene, 407
the other calcic phase of the cumulate. Biotite is abundant in the experimental charge and 408
absent in the charnockitic facies. We interpret this difference as resulting from the 409
significantly lower Fe# (0.7) of the starting composition 98N06 used by Bogaerts et al. (2006) 410
compared to the Fe# (0.87) of sample AD011. Indeed, the stability field of biotite decreases 411
with increasing Fe# (Frost and Frost, 2008a). The calculated cumulate has been further tested 412
using trace elements and the Rayleigh distillation law: 413 414 CL = C0. F(D-1) 415 416
where CL and C0 are the concentrations of the trace element in, respectively, the residual 417
liquid and the starting compositions, F is the fraction of residual liquid that has been derived 418
from the least square regression method and D, the bulk partition coefficient D = ΣDi.Xi 419
where Di is the partition coefficient of the trace element between the mineral i and the liquid 420
and Xi is the fraction of the mineral i in the subtracted cumulate. 421
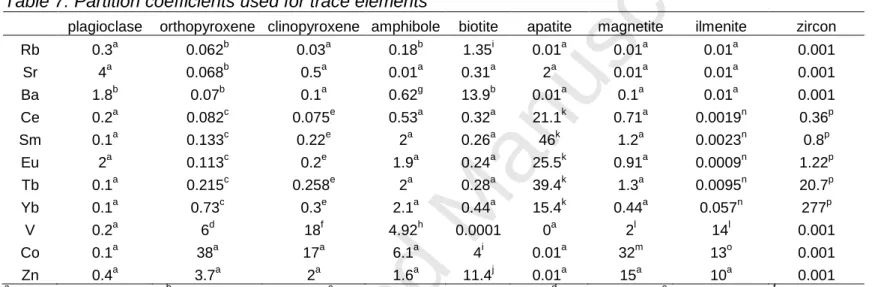
Partition coefficients were selected from the literature for dacitic to rhyolitic 422
compositions and are listed in Table 7. Zircon, known for its high partition coefficients for 423
HREE, was a fractionating phase as Zr decreases with increasing SiO2 (Fig. 9). A small 424
Accepted Manuscript
proportion of zircon was thus added to the subtracted cumulate. This proportion was 425estimated by mass balance, considering that all Zr is in the zircon and knowing the fraction of 426
residual liquid (F=0.74). The proportion of zircon calculated in this way is 0.17%. The 427
calculated residual liquid compares well with the observed composition thus supporting the 428
bulk cumulate obtained from the least square regression method (see Supplementary Table 429
S2). However, the calculated Ba content (1204 ppm) is higher than observed (977 ppm), 430
suggesting that either the proportion of plagioclase in the cumulate, the main Ba carrier, is too 431
low, or the partition coefficient selected for Ba is too low (1.8: Table 7). The second 432
hypothesis appears more plausible as the calculated Sr content, another element strongly 433
depending on the proportion of plagioclase in the cumulate, compares well with the observed 434
one. A partition coefficient of 2.74 for Ba would produce a residual liquid with 977 ppm Ba. 435
Such high values for DBa have been reported by several authors (Nagasawa, 1973; Nash and 436
Crecraft, 1985; Villemant, 1988; Mahood and Stimac, 1990). 437
In the granitic facies, samples AD60 (59.9 wt.% SiO2) and AD004 (65.1 wt.% SiO2) 438
were selected respectively for the starting composition (L0) and the residual liquid (L1). 439
Subtraction of a bulk cumulate composed of plagioclase (39.1%), amphibole (46.8%), biotite 440
(2.8%), ilmenite (1.9%), magnetite (5.4%) and apatite (3.7%) drives the liquid from L0 to L1 441
after 25% of crystallization with Σr2 of 0.0008 (Table 6). Given the Zr contents of L
0 and L1, 442
the proportion of zircon in the cumulate was calculated at 0.34% by mass balance. Here, the 443
calculated cumulate contains a proportion of plagioclase that compares very well with the 444
experimental data obtained on sample 98N50 (59.6 wt.% SiO2) by Bogaerts et al. (2006) at a 445
5.4% H2O in the melt (experimental charge 50-31: 33% plagioclase, 52% amphibole, 5% 446
biotite, 4% ilmenite, 4% magnetite, 2% apatite). This better fit in the case of the granitic 447
facies is no surprise as the Lyngdal granodiorite belongs to the HBG suite and displays the 448
granitic facies. The calculated trace elements composition of L1 (see Supplementary Table 449
Accepted Manuscript
S3) is in good agreement with the observed composition. It is worth noting that given the 450restricted range of SiO2 in both facies, the fraction of liquid is high (0.75) at the end of the 451
differentiation. 452
These calculations show that it is possible to predict both differentiation trends with a 453
fractional crystallization process. In this case, disequilibrium crystallization occurs because 454
crystals are chemically isolated from the residual liquid either by mechanical separation or 455
because diffusion is too slow. As already mentioned, ultramafic segregations essentially made 456
up of amphibole, pyroxene, Fe-Ti oxides, apatite and zircon with some plagioclase were 457
observed locally, at Jøllestø (Fig. 3-4A). In the field, these segregations differ from the 458
inclusions of banded gneisses (Fig. 4B) that are also observed in Farsund, in having a higher 459
color index and lacking a clear schistosity. These segregations indicate that some mechanical 460
separation, between minerals of high (ferromagnesian) and low density (plagioclase), was 461
indeed possible in the Farsund magmas, possibly because of their rather low viscosities (see 462
Supplementary material). Noteworthy, the calculated cumulate of the granitic trend is very 463
similar to the measured composition of sample AD067, one of the ultramafic segregations 464
(Table 2). These observations thus support the interpretation in terms of fractional 465
crystallization. The Farsund major and trace elements differentiation trends are linear in 466
Harker plots whereas in theory, fractional crystallization should produce curved trends. 467
However, because bulk partition coefficients are mostly less than three, the power laws 468
trajectories are rather flat and produce nearly linear trends. Also, the differentiation trends will 469
also be affected by variations in partition coefficients resulting from evolving melt and 470
mineral compositions. As pointed out by Clemens and Stevens (2012), « phenocrysts 471
unmixing », a process by which a fixed crystal assemblage is progressively separated from the 472
residual melt after some degree of crystallization took place, would also produce linear trends 473
in variation diagrams. These are the same as those resulting from a fractional crystallization 474
Accepted Manuscript
process if the separated mineral assemblage has the same mineral composition as the 475cumulate. This process depends on the efficiency of fractionation. 476
We conclude that in the Farsund magmas, the main cause of heterogeneity, and the 477
occurrence of two facies, were inherited from the source. Mixing was inefficient (as an 478
homogeneisation mechanism) between the two parent magmas and within each facies (see 479
Supplementary material). Both differentiation trends can be predicted by fractional 480
crystallization, but « phenocrysts unmixing » might also account for the data. Indeed, these 481
processes are not mutually exclusive. 482
The initial Sr and Pb isotopic composition of the granitic and charnockitic facies are 483
different whereas their Nd isotopes display a more continuous trend. As Sr and Pb are 484
relatively more mobile than Nd, the different Sr and Pb isotopic compositions could result 485
from the interaction with fluids (e.g. Romer et al., 2005). However, we think that this 486
hypothesis is highly unlikely in the case of the Farsund intrusion for three reasons. First, no 487
evidence of fluid circulation (miaroles, veins) was observed in the field and pegmatitic and 488
aplitic dykes are very scarce. Second, the magmas were below fluid saturation (see section 489
6.3) thus precluding the exsolution of magmatic fluid and percolation of brines. Third, the 490
surrounding rocks were metamorphosed mostly at granulite facies conditions before the 491
emplacement of the intrusion. 492
The persistence of different isotopic compositions in the two facies shows that most of 493
the assimilation took place before emplacement. Indeed, if their isotopic composition was 494
controlled by assimilation of the surrounding rocks during rising and/or emplacement, they 495
should display overlapping isotopic compositions. Moreover, their contrasted isotopic 496
compositions correspond at a larger scale to the isotopic compositions displayed by the HBG 497
and AMC suites, respectively. We take this as evidence that the different isotopic 498
compositions of the two facies do not result from one being contaminated by the surrounding 499
Accepted Manuscript
rocks and the other not. Following the above hypothesis on the origin of the least 500differentiated compositions of the Farsund intrusion, we suggest that contamination occurred 501
in the lower crust, probably by bulk assimilation when the partial melting process took place. 502
The opx-bearing quartz monzonitic magma, assimilated the C1 crust whereas the quartz 503
monzodioritic magma assimilated the C2 crust. The extent of this assimilation has been 504
estimated by Bolle et al. (2003a) and Vander Auwera et al. (2008) to about 10% but this is a 505
tentative estimation as it strongly depends on the trace elements (Sr, Nd) content of the C1 506
and C2 components for which no precise constraint currently exists. The important point is 507
that isotopic data show that the different batches of magmas that made the Farsund pluton 508
were variably contaminated in the lower crust before their ascent in the upper crust. 509
510
6.3. P-T-fH2O conditions of the Farsund magmas 511
512
The pressure of emplacement and crystallization has been estimated with the Al-in- 513
hornblende geobarometer of Johnson and Rutherford (1989) as amphibole is ubiquitous even 514
though in very low abundance in some samples of the charnockitic facies. This geobarometer 515
was selected since crystallization took place under water-undersaturated conditions (see 516
below). The average pressure of emplacement based on the analyses of 108 amphiboles is 517
410±40 MPa, with concordant results for the two facies. This result is in agreement with the 518
pressure range of emplacement (200-400 MPa) estimated for the nearby Lyngdal granodiorite, 519
based on experimental data on two representative samples (Bogaerts et al., 2006). 520
Apatite saturation temperatures overlap in both facies, 1044°C to 886°C in the 521
charnockitic facies and 1085°C to 800°C in the granitic facies (Table 2), and indicate that 522
apatite is a liquidus phase in agreement with the continuous decrease of P2O5 with increasing 523
SiO2 (Fig. 8). Apatite reached saturation at a slightly higher temperature in the granitic facies 524
Accepted Manuscript
probably because of the higher P2O5 content of this facies. Zircon saturation temperatures are 525significantly lower, between 699°C and 941°C with an average of 849°C (Table 2) indicating 526
that zircon was a late crystallizing phase. These high temperatures (1020°C and 900°C) agree 527
with the experimental results (1025°C-750°C) obtained on two samples (98N50 - 59.6 wt.% 528
SiO2 - and 98N06 - 64.8 wt.% SiO2) of the Lyngdal intrusion (Bogaerts et al., 2006) and more 529
generally with estimates on igneous charnockites (Frost and Frost, 2008a). 530
The H2O content in the charnockitic and granitic magmas has been estimated using the 531
phase diagrams of Bogaerts et al. (2006). As mentioned above, sample 98N06 (Lyngdal 532
granodiorite) is similar to AD011 (charnockitic facies) except that it has a lower Fe# (0.7) 533
than the latter (0.87). Sample 98N50 (Lyngdal granodiorite) is close to AD60 (granitic facies) 534
except for K2O (3.90 wt.% in AD60 and 2.88 wt.% in 98N50). Petrographic observations 535
indicate that amphibole is a late crystallizing phase in the charnockitic facies and, when it is 536
scarce, it only occurs as narrow rims around the pyroxenes and Fe-Ti oxides. On the other 537
hand, in this facies, orthopyroxene is abundant and petrographic textures suggest its early 538
crystallization. Accordingly, the 98N06 phase diagram indicates that the H2O content must 539
have been below 5 wt.% at the beginning of crystallization and reached about 6 wt.% near the 540
solidus (Bogaerts et al., 2006). Assuming a fraction of liquid of 0.75 based on the modeling of 541
the fractional crystallization, the H2O content can thus be estimated at 4.5 wt.% at the liquidus 542
of the charnockitic facies. This H2O content probably represents a maximum value as 543
comparison between the calculated and experimental cumulates indicates that in the 544
charnockitic magma, the H2O content was lower than in the experimental charge (4.2 wt.%). 545
It is possible that the late crystallisation of amphibole in the charnockitic facies as rims around 546
opaques or Fe-Mg silicates was due to an increased proportion of H2O in the boundary layer 547
close to the Fe-Mg silicates. The absence of orthopyroxene in the granitic facies imposes that 548
the H2O content was > 6 wt.% when amphibole crystallized (Bogaerts et al., 2006). 549
Accepted Manuscript
Considering an H2O content of 6.5 wt.% in the liquid when its fraction was 0.75, an H2O 550content higher than 5 wt.% can be estimated for the liquidus of the granitic facies taking into 551
account the amount of H2O present in the cumulate (amphibole, biotite). The good agreement 552
between the calculated cumulate and the experimental one, which is in equilibrium with a 553
melt containing 5.4 wt.% H2O, supports this result. Not surprisingly, the charnockitic and 554
granitic facies are characterized by different water contents. However, their different 555
mineralogies probably also result from their different Fe# as an increase of the melt Fe# 556
expands the stability field of orthopyroxene and shrinks that of amphibole and biotite (Naney, 557
1983; Frost and Frost, 2008a). 558
Given the estimated H2O content of the parent magmas and the fraction of residual 559
liquid calculated with the least square regression method (about 0.75), the H2O content in the 560
residual melt has been calculated to 6.1 wt.% H2O and 6.4 wt.% in the charnockitic and 561
granitic facies, respectively. In this calculation, the amount of H2O present in the cumulate of 562
the granitic facies (1.5 wt.% in the amphibole and 3 wt.% in the biotite) was taken into 563
account. These values are well below H2O saturation which is reached in these liquids at 564
about 9.2 to 10 wt. % H2O at 0.4 GPa according to the experimental data of Bogaerts et al. 565
(2006). Consequently, second boiling and gas-driven filter processes (Anderson et al., 1984; 566
Sisson and Bacon, 1999) have not occurred in the Farsund intrusion. Two lines of evidence 567
indicate that most of the water initially present in the parent magmas was concentrated in the 568
residual melts. First, the amount of water in the cumulates is negligible (less than 1 wt. % in 569
the granitic facies: amphibole and biotite present in the subtracted cumulate, Table 6; 570
anhydrous phases in the cumulates of the charnockitic facies, Table 6) and second, aplitic and 571
pegmatitic dykes are very rare and usually of limited thickness (about 1 dm). The residual 572
liquids were thus abundant (F = 0.75) and had low viscosities (high H2O content and 573
temperature, see Supplementary material). Given these properties, we suggest that they were 574
Accepted Manuscript
able to leave the magma chamber and rise up to the surface of the Mesoproterozic continental 575crust to produce volcanism, an hypothesis already proposed by Bogaerts et al. (2003b) for the 576
nearby Lyngdal intrusion and by Vander Auwera et al. (2008) for the granitoids of the HBG 577
suite. This process potentially tranferred a significant amount of H2O from the lower crust to 578 the surface. 579 580 7. Conclusions 581 582
The Farsund intrusion was built up by the emplacement and mingling of two different 583
broadly coeval magmas that belong to the two Sveconorwegian late-orogenic magmatic suites 584
recognized in southern Norway: the HBG and AMC suites. 585
The geochemistry of the Farsund body was controlled by its location close to both the 586
opx-in isograd of the Sveconorwegian regional metamorphism and the Farsund-RAP shear 587
zone that separates two different lithotectonic units. The charnockitic facies displaying the 588
petrographic and geochemical characteristics of the AMC suite (opx-bearing) also bear 589
evidence of the C1 component characterized by relatively radiogenic Sr (0.7097-0.7111) and 590
Pb isotopes, combined with epsilon-Nd values scattered around zero whereas the granitic 591
facies having the signature of the HBG suite (abundant hornblende) show isotopic signatures 592
of the C2 component characterized by significantly lower Sr isotope ratios (0.70540.7078) 593
and less radiogenic Pb isotopes, associated with mildly negative epsilon-Nd values (ca. -1). It 594
is also very likely that the Farsund-RAP shear zone favored the ascent and emplacement of 595
the Farsund magmas. 596
Taken as a whole, mineral composition, geochemical and isotopic data clearly indicate 597
that the two magmas did not mix during rise through the crust, final emplacement and 598
crystallization at about 0.4 GPa, thus further suggesting that these processes were fast in 599
Accepted Manuscript
agreement with the rather low viscosities of the magmas. Moreover, the isotopic composition 600of the two magmas was modified in the lower crustal source by bulk assimilation of the C1 or 601
C2 components. These data support recent models suggesting that granitic bodies are built by 602
multiple batches of magmas derived from contrasting sources. Modeling of the differentiation 603
shows that fractional crystallization can predict the observed trends in both magmas and 604
indicates that a limited extent of differentiation occurred in the shallow magma chamber. It 605
was also speculated that part of the rather H2O-rich residual melts could have erupted on the 606
Mesoproterozoic continental crust thus contributing to the transfer of H2O from the lower 607
crust to the atmosphere. 608
609
Acknowledgements
610
This work was funded by the Belgian Fund for scientific research (FNRS), the Research 611
Funds of the University of Liège and A.D. received a FRIA PhD fellowship. G. Bologne is 612
thanked for the assistance with X-ray fluorescence and ICPMS analyses. An earlier version of 613
the manuscript has been improved thanks to the constructive comments of B. Bonin and S. 614
Erdmann. Detailed comments and helpful suggestions provided by two anonymous reviewers 615
were greatly appreciated. 616 617 References 618 619
Andersen, T., Andresen, A., Sylvester, A., 2001. Nature and distribution of deep crustal 620
reservoirs in the southwestern part of the Baltic shield: evidence from Nd, Sr and Pb 621
isotope data on late Sveconorwegian granites. Journal of the Geological Society 158, 622
253-267. 623
Andersen, T., Andresen, A., Sylvester, A., 2002. Timing of late- to post-tectonic 624
Sveconorwegian granitic magmatism in South Norway. Norges geologiske 625
undersøkelse Bulletin 440, 5-18. 626
Andersen, T., Graham, S., Sylvester, A.G., 2007. Timing and tectonic significance of 627
Sveconorwegian A-type granitic magmatism in Telemark, southern Norway: new 628
results from laser-ablation ICPMS U-Pb dating of zircon. Norges Geologiske 629
Accepted Manuscript
Undersøkelse Bulletin 447, 17-31.630
Andersen, T., Hagelia, P., Whitehouse, M.J., 1994. Precambrian multi-stage crustal 631
evolution in the Bamble sector of south Norway: Pb isotopic evidence from a 632
Sveconorwegian deep-seated granitic intrusion. Chemical Geology (Isotope Geoscience 633
Section) 116, 327-343. 634
Andersen, T., Maijer, C., Veschure, R.H., 1995. Metamorphism, provenance ages and source 635
characteristics of Precambrian clastic metasediments in the Bamble sector, south 636
Norway. Petrology 3, 321-339. 637
Andersen, T., Sundvoll, B., 1995. Neodymium isotope systematics of the mantle beneath the 638
Baltic shield: evidence for depleted mantle evolution since the Archaean. Lithos 35, 639
235-243. 640
Anderson, A.T.J., Swihart, G.H., Artioli, G., Geiger, C.A., 1984. Segregation vesicles, gas 641
filter-pressing, and igneous differentiation. Journal of Geology 92, 55-72. 642
Andersson, M., Lie, J., Husebye, E., 1996. Tectonic setting of post-orogenic granites within 643
SW Fennoscandia based on deep seismic and gravity data. Terra Nova 8, 558-566. 644
Annen, C., Blundy, J.D., Sparks, R.S.J., 2006. The genesis of intermediate and silicic 645
magmas in Deep crustal hot zones. Journal of Petrology 47, 505-539. 646
Bacon, C.R., Druitt, T.H., 1988. Compositional evolution of the zoned calc-alkaline magma 647
chamber of Mount Mazama, crater Lake, Oregon. Contributions to Mineralogy and 648
Petrology 98, 224-256. 649
Barbarin, B., Didier, J., 1992. Genesis and evolution of mafic microgranular enclaves 650
through various types of interaction between coexisting felsic and mafic magmas. 651
Transactions of the Royal Society of Edinburgh, Earth Sciences 83, 145-153. 652
Barker, F., 1979. Trondhjemite: Definition, environment and hypotheses of origin. In: 653
Barker, F. (Ed.), Trondhjemites, dacites and related rocks. Elsevier, Amsterdam, pp. 1-654
12. 655
Barling, J., Weis, D., Demaiffe, D., 2000. A Sr-, Nd-, and Pb-isotopic investigation of the 656
transition between two megacyclic units of the Bjerkreim-Sokndal layered intrusion, 657
south Norway. Chemical Geology 165, 47-65. 658
Bea, F., Pereira, M., Stroh, A., 1994. Mineral/leucosome trace-element partitioning in a 659
peraluminous migmatite (a laser ablation-ICP-MS study). Chemical Geology 117, 291-660
312. 661
Beard, J.S., Lofgren, G.E., 1991. Dehydration melting and water-saturated melting of 662
basaltic and andesitic greenstones and amphibolites a 1, 3, 6.9 kb. Journal of Petrology 663
32, 365-401. 664
Bingen, B., Davis, W., Hamilton, M., Engvik, A., Stein, H., Skar, Ø., Nordgulen, Ø., 2008a. 665
Geochronology of high-grade metamorphism in the Sveconorwegian belt, South 666
Norway: U-Pb, Th-Pb and Re-Os data. Norwegian Journal of Geology 88, 13-42. 667
Bingen, B., Nordgulen, Ø., Viola, G., 2008b. A four-phase model for the Sveconorwegian 668
orogeny, SW Scandinavia. Norwegian Journal of Geology 88, 43-72. 669
Bingen, B., Skår, Ø., Marker, M., Sigmond, E.M.O., Nordgulen, Ø., Ragnhildsveit, J., 670
Mansfeld, J., Tucker, R.D., Liégeois, J.-P., 2005. Timing of continental building in the 671
Sveconorwegian orogen, SW Norway. Norwegian Journal of Geology 85, 87-116. 672
Bingen, B., Stein, H.J., Bogaerts, M., Bolle, O., Mansfeld, J., 2006. Molybdenite Re-Os 673
dating constrains gravitational collapse of the Sveconorwegian orogen, SW 674
Scandinavia. Lithos 87, 328-346. 675
Bingen, B., van Breemen, O., 1998. U-Pb monazite ages in amphibolite- to granulite-facies 676
orthogneisses reflect hydrous mineral breakdown reactions: Sveconorwegian Province 677
of SW Norway. Contributions to Mineralogy and Petrology 132, 336-353. 678
Bogaerts, M., Scaillet, B., Liégeois, J.-P., Vander Auwera, J., 2003a. Petrology and 679
Accepted Manuscript
geochemistry of the Lyngdal granodiorite (Southern Norway) and the role of fractional 680crystallization in the genesis of the Proterozoic ferro-potassic A-type granites. 681
Precambrian Research 124, 149-184. 682
Bogaerts, M., Scaillet, B., Vander Auwera, J., 2003b. Emplacement of the Lyngdal 683
granodiorite (SW Norway) at the brittle-ductile transition in a hot crust. Joint EGS-684
EUG. Cambridge University Publications, Nice (France), p. 03611. 685
Bogaerts, M., Scaillet, B., Vander Auwera, J., 2006. Phase equilibria of the Lyngdal 686
granodiorite (Norway) : Implications for the origin of metaluminous ferroan granitoids. 687
Journal of Petrology 47, 2405-2431. 688
Bogdanova, S., Bingen, B., Gorbatschev, R., Kheraskova, T., Kozlov, V., Puchkov, V., 689
Volozh, Y., 2008. The East European Craton (Baltica) before and during the assembly 690
of Rodinia. Precambrian Research 160, 23-45. 691
Bolle, O., Demaiffe, D., Duchesne, J.C., 2003a. Petrogenesis of jotunitic and acidic members 692
of an AMC suite (Rogaland anorthosite province, SW Norway): a Sr and Nd isotopic 693
assessment. Precambrian Research 124, 185-214. 694
Bolle, O., Diot, H., Trindade, R.I.F., 2003b. Magnetic fabrics in the Holum granite (Vest-695
Agder, southernmost Norway): implications for the late evolution of the 696
Sveconorwegian (Grenvillian) orogen of SW Scandinavia. Precambrian Research 121, 697
221-249. 698
Bolle, O., Diot, H., Liégeois, J.-P., Vander Auwera, J., 2010. The Farsund intrusion (SW 699
Norway): a marker of Late-Sveconorwegian (Grenvillian) coeval transtension and 700
gravity-driven tectonism. Journal of Structural Geology 32, 1500-1518. 701
Bolle, O., Duchesne, J.C., 2007. The Apophysis of the Bjerkreim-Sokndal layered intrusion 702
(Rogaland anorthosite province, SW Norway): a composite pluton build up by 703
tectonically-driven emplacement of magmas along the margin of an AMC igneous 704
complex. Lithos 98, 292-312. 705
Buddington, A., 1959. Granite emplacement with special reference to North America. 706
Geological Society of America Bulletin 70, 671-747. 707
Charlier, B., Duchesne, J.C., Vander Auwera, J., Storme, J.Y., Maquil, R., Longhi, J., 2010. 708
Polybaric fractional crystallization of high-alumina basalt parental magmas in the 709
Egersund-Ogna massif-type anorthosite (Rogaland, SW Norway) constrained by 710
plagioclase and high-alumina orthopyroxene megacrysts. Journal of Petrology 51, 711
2515-2546. 712
Clemens, J.D., Helps, P.A., Stevens, G., 2009. Chemical structure in granitic magmas - A 713
signal from the source? Earth and Environmental Science Transactions of the Royal 714
Society of Edinburgh 100, 159-172. 715
Clemens, J.D., Stevens, G., 2012. What controls chemical variation in granitic magmas? 716
Lithos 134-135, 317-329. 717
Dekker, A.G., 1978. Amphiboles and their host rocks in the high-grade metamorphic 718
Precambrian of Rogaland/Vest-Agder, SW. Norway. Rijksuniversiteit te Utrecht, 719
Utrecht. 720
Demaiffe, D., Bingen, B., Wertz, P., Hertogen, J., 1990. Geochemistry of the Lyngdal 721
hyperites (S.W. Norway): comparison with the monzonorites associated with the 722
Rogaland anorthosite complex. Lithos 24, 237-250. 723
Demaiffe, D., Weis, D., Michot, J., Duchesne, J.C., 1986. Isotopic constraints on the genesis 724
of the anorthosite suite of rocks. Chemical Geology 57, 167-179. 725
Duchesne, J.C., 2001. The Rogaland Intrusive Massifs- an excursion guide. NGU Report 726
2001.29, Geological Survey of Norway. 727
Duchesne, J.C., Liégeois, J.-P., Bolle, O., Vander Auwera, J., Bruguier, O., Matukov, D.I., 728
Sergeev, S., 2013. The fast evolution of a crustal hot zone at the end of a 729
Accepted Manuscript
transpressional regime: The Saint-Tropez peninsula granites and related dykes (Maures 730Massif, SE France). Lithos 162-163, 195-220. 731
Duchesne, J.C., Wilmart, E., 1997. Igneous charnockites and related rocks from the 732
Bjerkreim-Sokndal layered intrusion (Southwest Norway): a jotunite (hypersthene 733
monzodiorite)-derived A-type granitoid suite. Journal of Petrology 38, 337-369. 734
Dupont, A., 2004. Pétrologie, géochimie et géochimie isotopique du massif de Farsund 735
(Norvège): implications pour le magmatisme AMCG. Université de Liège, Liège, pp. 736
279. 737
Dupont, A., Vander Auwera, J., Paquette, J.-L., Pin, C., Bogaerts, M., 2005. Inefficiency of 738
magma mixing and source heterogeneity in the genesis of granitoids: the example of 739
the Farsund body (southern Norway). Joint EGS-EUG. Cambridge Publications, Nice 740
(France). 741
Emslie, R.F., Hamilton, M.A., Thiérault, R.J., 1994. Petrogenesis of a Mid-Proterozoic 742
Anorthosite - Mangerite - Charnockite - Granite (AMCG) complex: isotopic and 743
chemical evidence from the Nain plutonic suite. Journal of Geology 102, 539-558. 744
Ewart, A., Griffin, W., 1994. Application of proton-microprobe data to trace-element 745
partitioning in volcanic rocks. Chemical Geology 117, 251-284. 746
Falkum, T., 1982. Geologisk kart over Norge, berggrunnskart Mandal - 1:250000, Norges 747
Geologiske Undersøkelse. 748
Falkum, T., 1998. The Sveconorwegian magmatic and tectonometamorphic evolution of the 749
high-grade Proterozoic Flekkefjord complex. Norges Geologiske Undersøkelse Bulletin 750
434, 5-33. 751
Falkum, T., Petersen, J., 1974. A three-fold division of the "farsundite" plutonic complex at 752
Farsund, southern Norway. Norsk Geologisk Tidsskrift 54, 361-366. 753
Falkum, T., Wilson, J., Annis, M., Fregerslev, S., Zimmermann, H., 1972. The intrusive 754
granites of the Farsund area, South Norway. Norsk Geologisk Tidsskrift 52, 463-465. 755
Falkum, T., Wilson, J., Petersen, J., Zimmermann, H., 1979. The intrusive granites of the 756
Farsund area, south Norway: their interrelations and relations with the Precambrian 757
metamorphic envelope. Norsk Geologisk Tidsskrift 59, 125-139. 758
Faure, G., 1986. Principles of isotope geology. Wiley, New York, pp. 589. 759
Fram, M., Longhi, J., 1992. Phase equilibria of dikes associated with Proterozoic anorthosite 760
complexes. American Journal of Science 77, 605-616. 761
Frost, B.R., Frost, C.D., 2008a. On charnockites. Gondwana Research 13, 30-44. 762
Frost, B.R., Frost, C.D., 2008b. A geochemical classification for feldspathic igneous rocks. 763
Journal of Petrology 49, 1955-1969. 764
Frost, B.R., Arculus, R.J., Barnes, C.G., Collins, W.J., Ellis, D.J., Frost, C.D., 2001. A 765
geochemical classification of granitic rock suites. Journal of Petrology 42, 2033-2048. 766
Fujimaki, H., 1986. Partition coefficients of Hf, Zr, and REE between zircon, apatite and 767
liquid. Contributions to Mineralogy and Petrology 94, 42-45. 768
Glazner, A.F., Bartley, J.M., Coleman, D.S., Gray, W., Taylor, R.Z., 2004. Are plutons 769
assembled over millions of years by amalgamation from small magma chambers? GSA 770
Today 14, 4-11. 771
Harrison, T.M., Watson, E.B., 1984. The behavior of apatite during crustal anatexis: 772
equilibrium and kinetic considerations. Geochimica et Cosmichimica Acta 48, 1467-773
1477. 774
Henry, D.J., Guidotti, C.V., Thomson, J.A., 2005. The Ti-saturation surface for low-to-775
medium pressure metapelitic biotites: implications for geothermometry and Ti-776
substitution mechanisms. American Mineralogist 90, 316-328. 777
Jacobsen, S., Wasserburg, G.J., 1980. Sm-Nd isotopic evolution of chondrites. Earth and 778
Planetary Science Letters 50, 139-155. 779