TABLE TESTS AND NONLINEAR DYNAMIC SIMULATIONS BY THE
PROPER ORTHOGONAL DECOMPOSITION (POD)
Serena CATTARI1, Ambra CHIOCCARIELLO 2, Hervé DEGÉE 3, Catherine DONEUX4, Sergio
LAGOMARSINO5, Christophe MORDANT6
ABSTRACT
The paper focuses on the interpretation and numerical simulation of the results of shaking table tests on two masonry buildings mock-ups, performed at Laboratório Nacional de Engenharia Civil (LNEC) in Lisbon, within the purposes of the SERIES project Transnational Access activities (Mendes et al. 2014, Lu et al. 2014). Shaking table tests have produced a huge amount of remarkable data that need to be properly interpreted, in order to get general and synthetic information on the seismic behaviour.
To this aim, different techniques of data interpretation are applied, consisting in some traditional approaches (e.g. the frequencies analysis or the identification of an equivalent linear system) and in the innovative use of the Proper Orthogonal Decomposition (POD) technique. Together with the interpretation of experimental results, the paper also illustrates the nonlinear dynamic simulation of these two models by Tremuri program (Lagomarsino et al. 2013), which is based on the equivalent frame approach. The results achieved showed a good agreement between experimental and numerical results, highlighting that the tools adopted are quite effective in interpreting the nonlinear response of URM masonry structures.
INTRODUCTION
Current trends in the field of the performance-based seismic assessment of new and, in particular, existing buildings are oriented to the use of nonlinear analyses, both static, as proposed in international codes (ASCE SEI 41-06 2007, EN 1998-3 2005), and dynamic, by the execution of Incremental Dynamic Analyses – IDA (Vamvatsikos and Cornell 2002). In the case of masonry buildings, the use of nonlinear approaches is even more necessary due to their seismic behavior characterized by the occurrence of cracking even for low levels of seismic demand. It is evident that reliable numerical models are needed for performing such complex analyses: to this aim, the support of experimental results constitutes an essential tool to validate and corroborate their use. In particular, information on the dynamic response are valuable, which can be achieved by shaking table tests, but the difficulty in interpreting the results in an effective and synthetic way arises.
1 Assistant Professor, DICCA - University of Genoa, Genoa (Italy), serena.cattari@unige.it 2 Graduate student, University of Genoa, Genoa (Italy), ambra.chioccariello@yahoo.it 3 Full Professor, Hasselt University (Belgium), herve.degee@uhasselt.be
4 Research engineer, Catholic University of Louvain, (Belgium), catherine.doneux@uclouvain.be 5 Full Professor, DICCA - University of Genoa, Genoa (Italy), sergio.lagomarsino@unige.it 6 PhD Student, University of Liege (Belgium), cmordant@ulg.ac.be
2
Within this context, the paper aims to face these issues through the interpretation and numerical simulation of the experimental campaign recently performed on the 3-D shaking table at Laboratório Nacional de Engenharia Civil (LNEC) in Lisbon, within the purposes of the SERIES project Transnational Access activities (Mendes et al. 2014, Lu et al. 2014, Jaeger et al. 2014). Among various tools adopted for the interpretation of experimental and numerical data, the innovative use of the Proper Orthogonal Decomposition (POD) technique has been tested; indeed, in the past it has been already applied in economics or other engineering fields (Han and Feeny 2003, Solari et al. 2007) and, more recently, also in the interpretation of nonlinear dynamic analyses (Lagomarsino and Cattari 2014). The numerical simulation was carried out through the equivalent frame approach, by using the Tremuri program (Lagomarsino et al. 2013), in which recently new multilinear phenomenological constitutive laws for the nonlinear response of masonry panels have been implemented. Although the quite simple configuration of tested mock-ups would allow also the adoption of more accurate modeling strategies (like as detailed finite element models), this choice is justified by the large spread of such approach in the engineering practice, as expressly suggested also by some codes (EN 1998-3 2005, NTC 2008) and supported by its capability to analyze 3D buildings even very complex with a reasonable computational effort. Despite this, a systematic validation of its reliability is still lacking in literature, thus these numerical simulations of experimental results represent an interesting example.
DESCRIPTION OF THE EXPERIMENTAL CAMPAIGN
Two full scale 2-storey buildings (Models A and B, as illustrated in Figure 1), with dimensions of 3.7x4.2 m2 at ground floor and a height of 5.4 m, have been tested on the 3-D shaking table of the Laboratório Nacional de Engenharia Civil (LNEC) in Lisbon using a series of seismic records, with increasing intensity (Mendes et al. 2014, Lu et al. 2014, Jaeger et al. 2014).
a) b) c)
Figure 1. Geometrical plan view of Model A (a) and B (b) and view of the mock-up B in the LNEC laboratory before the testing campaign (c)
They have been built by using premium insulation filled clay blocks (from Wienerberger), with thin layer mortar (approximately 1 mm thickness). These modern blocks are conceived for providing good mechanical strength but also for thermal insulation, in order to fulfil the strict legal requirements for heating/cooling energy demand. The seismic input is semi-artificial earthquake based on a central European record (Friuli 1976 earthquake – Tolmezzo Station), fitted to a specific EC8 elastic response spectrum. In particular, the reference signals (REF) were obtained by scaling the N-S (E-W) component to PGA = 0,36 g (0,32 g) and used in the shaking table transversal (longitudinal) direction. These signals were scaled down to 12,5%, 25%, 37,5%, 50%, 62,5%, 75%, 87,5% resulting into the following eight seismic stages: consecutive uniaxial loading in both directions for the first stage, followed by identification of natural frequency, and then by biaxial loading for the next stage, and so on (Figure 2). For each load level several shakes with increasing intensity were performed to
reach the final intensity of the single step, giving a total number of 62 shakes for model A and 54 shakes for model B.
Figure 1 shows a geometrical plan of the two models: Model A is regular in plan while model B includes significant irregularities, related to the distribution of openings. In both models the two storeys are equal. The red arrows in Figure 1 specify the position of the piezoelectric accelerometer installed on the models at the level of the RC slab (both the intermediate and the one on the top). The blue arrows, on the other hand, show the position of the LED placed at the level of RC slabs and used by the optical system which records the displacements that the structure undergoes. The same configuration of accelerometers and LED optical system has been adopted on both models. The acronyms used in the scheme have the following meanings: TN = Transversal acceleration (displacement) of North façade, TS = Transversal acceleration (displacement) of South façade, LE = Longitudinal acceleration (displacement) of East façade, LW = Longitudinal acceleration (displacement) of West façade.
Figure 2. Shaking table acceleration signals applied to Model A)
TOOLS ADOPTED FOR THE INTERPRETATION OF RESULTS
The experimental data have been analysed by adopting different techniques with the aim of achieving a synthetic description of the dynamic behaviour exhibited during the tests. Basically three tools have been adopted as summarized in Figure 3.
Firstly, the acceleration time histories have been processed using a classical frequency analysis: the accelerations recorded on the shaking table and those transmitted to the mock-up have been re-elaborated by using a Fourier transform and computing the transfer function in order to identify the fundamental frequencies of the mock-up.
Secondly, the fundamental frequencies of vibration have been identified by defining an equivalent linear system: the equivalence is established in such way to approximate the actual displacement time-histories recorded in the mock-up through the response of this linear system subjected to the same input acceleration. To this aim, an algorithm implemented in Matlab (Van Overschee and De Moor 1994) has been adopted, by considering different systems characterized by various degree of freedom and then by adopting that characterized by the lowest error in simulating the original response. The identified system is synthetically described in terms of periods (or frequencies) and damping factor.
Thirdly, both recorded signals (accelerations and displacements) have been processed with the Proper Orthogonal Decomposition technique (POD). As proposed in Lagomarsino and Cattari (2014), this tool may result quite effective in the understanding of the dynamic behaviour of a structure starting from a great quantity of data, as those recorded during shaking table tests. In fact, once organised the signal in a data matrix whose columns contain the signal time histories (in such a way
Transversal PGA (REF) Stage Longitudinal 01T 01L 02 03T 03L 04 05T 05L 06 07T 07L 08 12,5% 12,5% 25% 37,5% 37,5% 50% 67,5% 67,5% 75% 87,5% 87,5% 100%
4
that each line displays the variables observed at the same time), the matrix is decomposed through a basis of orthonormal vectors in order to obtain a new matrix whose components are uncorrelated. The basis used is the covariance matrix (C). By solving the eigenvalue problem (that is by determining the eigenvectors and the eigenvalues of the covariance matrix C) it is possible to define, respectively, the modes of response and the energy associates with them.
Figure 3. Summary of the different tools adopted for the interpretation of results, the input recorded data which they have been applied to and their aim.
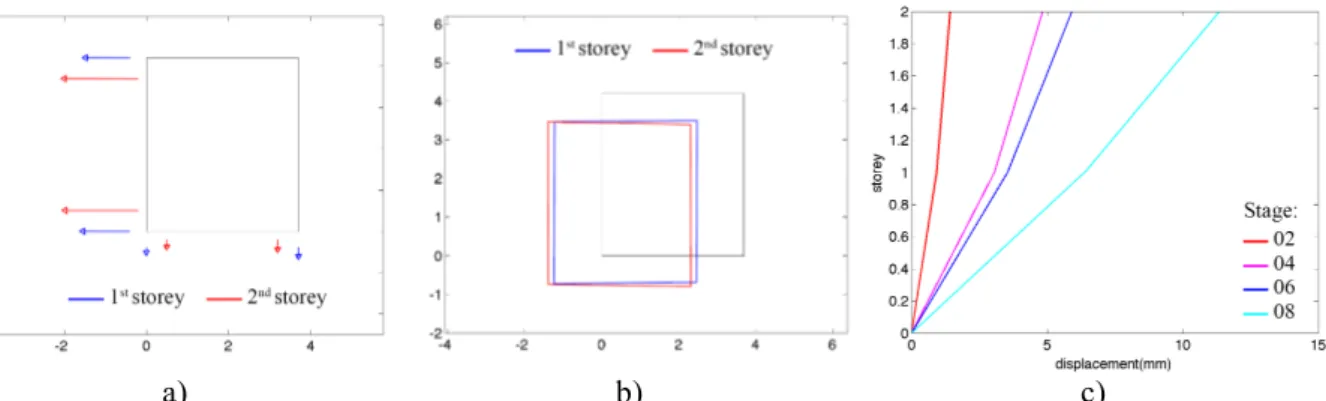
The application of POD technique to the acceleration signals allows determining the distribution of inertial forces transmitted to the structure (Figure 4a): for example, they may be useful to calibrate adaptive pushover analysis. If applied to the displacement histories, it may support the definition of deformed shapes both in plan than in elevation (Figure 4b/c). The main advantage, compared to refer to single and instantaneous peaks of the response (e.g. the maximum displacement occurred in a point of the structure, like as the top level), is to interpret the structural response occurred in terms of dominant behaviours.
Figure 4. Example of the results obtained through the POD analysis (Model A): a) plan view of the inertial forces transmitted to the first and second level (stage 01T); b) plan view of the deformed shape of the first and
second storey (stage 01T); c) deformed shape in elevation of the west façade (stages from 02 to 08) Once the signals coming from the experimental campaign have been analysed, the same tools were used for processing the results of the nonlinear dynamic analysis of the numerical models developed in Tremuri program.
NUMERICAL SIMULATION
A nonlinear dynamic numerical simulation has been performed on two mock-ups described in previous paragraphs by adopting the equivalent frame approach; in particular, the Tremuri program was used (Lagomarsino et al. 2013), in which recently some new multilinear phenomenological constitutive laws for the nonlinear response of masonry panels have been implemented (Cattari 2014). According to the equivalent frame approach, each resistant masonry wall is subdivided into a set of deformable masonry panels (piers and spandrels), in which the deformation and the nonlinear response are concentrated, and rigid portions, which connect the masonry panels. The program allows to model diaphragms as orthotropic membrane finite elements (in plane stress).This approach, which is also expressly suggested in some seismic codes (EN 1998-3 2005, NTC 2008), requires a limited number of degrees of freedom, with a reasonable computational effort, allowing the analysis of complex three-dimensional models of URM structures, obtained by assembling walls and floors, mainly referring to their in-plane strength and stiffness contributions. Figure 5 shows a 3D view of two structural models, highlighting the equivalent frame idealization of main façades.
Figure 5. Equivalent frame model of mock-up A (d) and B (a,b,c) and a sketch aiming at representing the hysteretic response of multilinear constitutive laws implemented in Tremuri program (e)
The deformable elements are modelled as nonlinear beams by adopting the constitutive law illustrated in Figure 5e, that describes the element response by assuming a proper force-displacement relationship (Cattari 2014). In particular, it is based on a phenomenological approach and allows to
6
describe: the nonlinear response until very severe damage levels (from 1 to 5) through progressing strength decay (βEi) in correspondence of assigned values of drift (θEi); a quite accurate hysteretic
response (through the definition of the α,δ,χ and γ parameters). Thanks to a proper assignment of such parameters, this constitutive law allows to describe the distinctive features of various failure modes (flexural, shear and mixed as well) and to capture the different behaviour of piers and spandrels, as highlighted by the evidence of various experimental campaigns (e.g. in Beyer and Dazio 2012). The reliability of the equivalent frame approach and these new constitutive laws in describing the response of URM buildings has been recently discussed also in Cattari and Lagomarsino (2013) by simulating the actual response of a three-storey structure damaged by the 2012 Emilia earthquake.
The maximum shear strength of the panel (Vy) is computed on the basis of common strength
criteria proposed in literature and implemented in the software (Lagomarsino et al. 2013), which aim to interpret the flexural and shear response that may occur in URM panels (Magenes and Calvi 1997, Calderini et al. 2009). In particular, they are based on the approximate evaluation of the local/mean stress state produced by the applied forces on predefined points/sections of the panel, assessing then its admissibility with reference to the limit strength domain of the constituent material, usually idealised through oversimplifications based on few mechanical parameters. The shear strength of the panel (V) is obtained as the minimum value given by proper criteria, which are function of the current value of the axial force (N) acting on the element (that varies during the analysis due to the application of horizontal loads, the redistribution phenomena and the vertical component in case of nonlinear dynamic analysis).
In the examined case, the flexural response have been computed according to the beam theory, neglecting the tensile strength of the material and assuming an appropriate normal stress distribution at the compressed toe (EN 1998-3 2005, NTC 2008):
𝑉!,!"=
𝑙𝑡 𝑝 2𝛼! 1 −
𝑝
𝜅𝑓! (1)
while the shear one, through the criterion proposed by Mann and Muller (1981), is given by: 𝑉!&!, !!!"# = 𝑙𝑡 𝑏(𝑐 + 𝜇𝑝) ≤ 𝑙𝑡 𝑏 𝑓!" 𝛽! 1 + 𝑝 𝑓!" (2)
where: 𝛼!= 𝜓 ℎ 𝑙 is a coefficient that takes into account the boundary conditions of the panel (ψ=0.5 for panels fully restrained at the top); k =0.85; l, t and h are the transversal length, the thickness and the height of the panel, respectively; b is a coefficient that varies from 1 to 1.5 as a function of the slenderness of the panel, aimed to take into account the mean shear stress value at the centre of the panel (introduced in the Mann and Muller criterion according to what proposed in Lagomarsino et al. 2013); c and µ are the equivalent friction coefficient and cohesion (computed as
µ=µ/ 1+ 2
(
µΔy/ Δx)
and c = c / 1+ 2µΔ(
y/ Δx)
respectively, starting from the local friction coefficient µ and the cohesion c of mortar joints and the length Δx and the height Δy of the unit); p isthe mean compressive stress acting on the panel; fbt is the tensile strength of the unit; and β1 is a
coefficient that varies as a function of the shape of the unit (assumed in this case equal to 1.67). Also reinforced concrete elements, which are present in the mock-ups at floor level through r.c. ring beams, are modelled as nonlinear beams with lumped plasticity in the end sections (Cattari and Lagomarsino 2013).
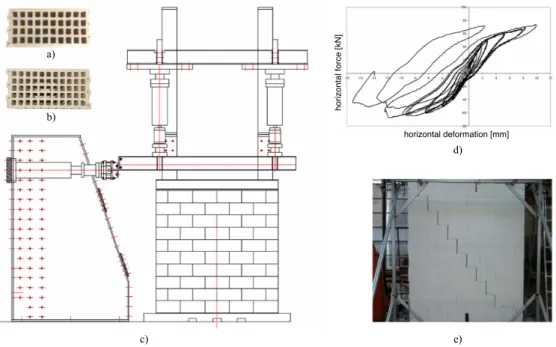
Few tests were performed on single constituents and assemblages of masonry, thus the calibration of parameters necessary to define the nonlinear response of URM panels has been done on basis of other experimental results available in literature on similar masonry types. In particular, the results of the experimental campaign carried out at the University of Kassel, which is involved in the ESECMaSE project (Enhanced Safety and Efficient Construction of Masonry Structures in Europe, www.esecmase.org), has been assumed as reference (Deliverables D4.4, D4.5 and D7.1 2007). Within the different masonry types tested in such large campaign, the results on panels made up by optimised bricks (type 1 or 2) using thin layer mortar (test n° 5, 7, 9, 10, 12, 13, 14, 15) have been adopted
(Figure 6): in fact, they have a pattern of holes quite similar to Wienerberger blocks. Panels alternatively subjected to a prevailing flexural or shear responses have been properly selected in order to calibrate the mechanical parameters which the corresponding strength criteria are based on.
Tables 1 and 2 summarize the parameters adopted in numerical simulations for both mock-ups; in particular, starting from the values calibrated on basis of results of panels tested during the ESECMaSE project, some modifications have been applied on basis of expert judgement in order to take into account the differences in the masonry adopted in experimental campaign carried out at LNEC laboratory.
Figure 6. Reference ESECMaSE panels tested at Kassel University: optimised clay unit type 1 (a) and type 2 (b); setup adopted for static-cyclic test (c); hysteresis curve (d) and crack pattern (e) of wall n°9
Table 1. Mechanical strength parameters defined for the ESECMaSE masonry panels and for the panels of numerical models analysed in TREMURI
Parameter 𝐟𝐦
[MPa] ∆𝐱[m] ∆𝐲[m] 𝛍 [−] 𝐜 [MPa] 𝛍 [−] 𝐜 [𝐌𝐏𝐚] [MPa] 𝐟𝐛𝐭
ESECMaSE 6,7 0,365 0,250 0,600 0,240 0,329 0,132 0,380
TREMURI 5,6 0,400 0,250 0,790 0,180 0,400 0,090 0,360
Table 2. Parameters that characterize the monotonic response of masonry panels in numerical model
Parameter θE,3 θE,4 θE,5 𝜷𝑬,𝟑 𝜷𝑬,𝟒
Piers Shear 0,003 0,005 0,007 0,7 0,4
Flexural 0,005 0,01 0,015 0 0,85
Spandrels Shear/Flexural 0,003 0,006 0,02 0,6 0,6
Finally, despite the quite regular and simple structure of two examined mock-ups, some additional uncertainties in the equivalent frame modelling have been considered by performing a preliminary sensitivity analysis and calibration of the models. In particular, in this preliminary phase, the following effects have been evaluated: i) different possible choices in defining the effective height of masonry piers; ii) the role of the flange effect; iii) the assignment of Young Modulus (E) and Shear Modulus (G) for masonry panels. Regarding issue ii), the rigid nodes at the corner, initially modelled as 3-dimensional nodes, have been split in two 2D nodes, each one defined in the plane of a wall,
a) b) c) d) e) horizontal deformation [mm] h o ri z o n ta l fo rc e [ k N ]
8
connected by an elastic link (Figure 5c): thus, varying the elastic properties of such links it was possible to simulate different degrees of connection between orthogonal walls. Regarding issue iii), a proper reduction of the elastic modulus has been adopted in order to balance these different effects: the higher stiffness usually associated to the equivalent frame model due to the introduction of rigid area; the initial cracked state induced in the model due to the transport phase. Such phase of initial calibration have been carried out by considering as target only the fundamental frequencies identified on the mock-ups before the beginning of shaking table tests.
Finally, regarding the nonlinear dynamic analysis, it has to be mentioned that, due to a too big computational effort demanded for charging the same sequence in acceleration, the signal had to be divided in two sequences, transversal and longitudinal, from which the first stage was removed. The two sequences mentioned are defined by simulating: in transversal direction stages 02, 03T, 04, 05T, 06, 07T, 08; in longitudinal direction stages 02, 03L, 04, 05L, 06, 07L, 08. The dynamic analyses were carried out by applying simultaneously the three components of accelerograms (transversal, longitudinal and vertical one).
DESCRIPTION OF RESULTS
In general, even documented only partially in this paper, a quite good agreement between experimental and numerical results has been observed by considering the whole sets of results and both models simulated (for which the same mechanical parameters have been adopted).
Firstly, a qualitative interpretation of results in terms of main global failure mode occurred is discussed. In general, the experimental results highlight that, in both models, the damage has been mostly concentrated in the transversal direction, where the response of the structure reached a higher level of damage: in correspondence of the last stage, in case of Model A, a storey mechanism located at top level occurred, while in Model B located at ground storey. Figure 7 shows the comparison between the experimental and numerical results in terms of damage pattern for Model B (asymmetric): the damage simulated is quite consistent with the actual one, both in terms of extension and localisation.
North façade South façade
Figure 7. Experimental (a,c) and simulated (b,d) damage on Model B (Asymmetric) for North (a,b) and South (c,d) façades; particulars of the damage occurred in piers no.8 (f) and no.9 (g) of North façade and pier no. 28 (h)
Figure 8 shows the main transversal and longitudinal frequencies as a function of the PGA values corresponding to even stages. In particular, the blue line refers to the frequencies recognised by the dynamic characterisations carried out before each seismic stage. These values are compared with the experimental data (in green) and the numerical results (in red) post-processed through the identification of the linear equivalent system. In the case of experimental data, it has been verified that results achieved with this latter technique are in agreement with those coming from the analysis in the frequency domain. In general it may be observed that the numerical model, despite a slight overestimation in longitudinal direction and a slight underestimation in transversal direction, is able to correctly capture the degradation in stiffness occurred.
Transversal Frequency Longitudinal Frequency
Mo d el A Mo d el B
Figure 8. Frequencies associated with different values of PGA (even stages).
Figure 9 illustrates the displacements of the second level for some walls and two models, as computed by the application of POD technique, as a function of the PGA values corresponding to different stages. In particular, the transversal displacements of South and North façades (TS and TN) and longitudinal displacements of East and West façades (LE and LW) are illustrated. Numerical results show a substantial agreement with the experimental ones. In particular, it is relevant to note how, despite some reasonable differences, the model is capable to capture the activation of the global failure mechanism in correspondence of the correct stage.
2 3 4 5 6 7 8 0 1 2 3 4 5 6 f [H z] PGA [m/s^2] f transv - PGA 2 3 4 5 6 7 8 0 1 2 3 4 5 6 f [H z] PGA [m/s^2] f long - PGA 2 3 4 5 6 7 8 0 1 2 3 4 5 6 f [H z] PGA [m/s^2] f transv - PGA 2 3 4 5 6 7 8 0 1 2 3 4 5 6 f [H z] PGA [m/s^2] f long - PGA 3,000 4,000 5,000 6,000 7,000 0,000 1,000 2,000 3,000 4,000 5,000 6,000 7,000 f [H z] PGA [m/s^2] f long - PGA
10
Figure 9. Comparison between the experimental and numerical results coming from non-linear dynamic analysis: displacement of the second level of walls associated with different values of PGA (values corresponding to even
stages: 02, 04, 06, 08).
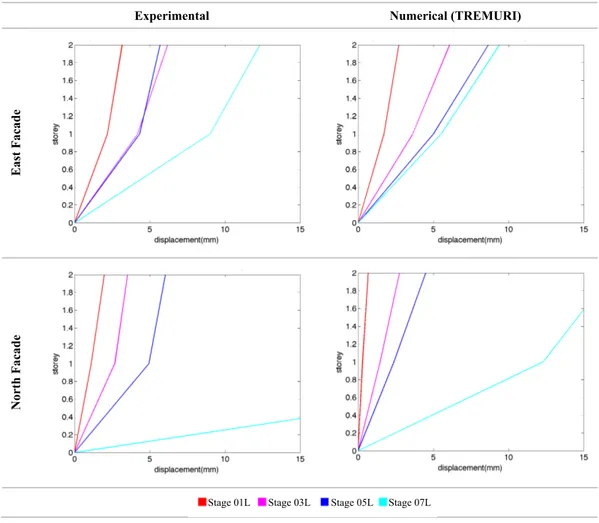
Finally, Figure 10 shows a schematic representation of the deformed shape of North and East façade of the Model B as a function of progressing stages; once more, they have been obtained by the application of the POD technique to the displacement time histories (experimental and numerical ones). In the case of East façade, the numerical simulation correctly gets from the beginning a deformed shape with more pronounced displacements at ground floor, according to that testified by
Experimental Numerical (TREMURI)
M od el A Tr an sve rs al d is p lac eme n t o f S ou th an d N or th F aç ad e (TS an d TN ) M od el A Lon gi tu d in al d is p lac eme n t of Eas t an d W es t F aç ad e (LE an d LW ) M od el B Tr an sve rs al d is p lac eme n t of N or th an d S ou th F aç ad e (TS an d TN ) M od el B Lon gi tu d in al d is p lac eme n t of Eas t an d W es t fac ed ( LE an d LW ) 0 1 2 3 4 5 0 5 10 15 P G A [m/ s^ 2] displacement of 2nd storey [mm] TS TN 0 1 2 3 4 5 0 5 10 15 P G A [m/ s^ 2] displacement of 2nd storey [mm] TS TN 0 1 2 3 4 5 0 5 10 15 P G A [m/ s^ 2] displacement of 2nd storey [mm] LE LW 0 1 2 3 4 5 0 5 10 15 P G A [m/ s^ 2] displacement of 2nd storey [mm] LE LW 0 1 2 3 4 5 0 5 10 15 P G A [m/ s^ 2] displacement of 2nd storey [mm] TS TN 0 1 2 3 4 5 0 5 10 15 P G A [m/ s^ 2] displacement of 2nd storey [mm] TS TN 0 1 2 3 4 5 0 5 10 15 P G A [m/ s^ 2] displacement of 2nd storey [mm] LE LW 0 1 2 3 4 5 0 5 10 15 P G A [m/ s^ 2] displacement of 2nd storey [mm] LE LW
the experimental response. In the case of North façade, the response occurred once active the final global mechanism is simulated in correct way, while at the beginning a linear response is more pronounced than in the experimental one.
Figure 9. Comparison between experimental and numerical results coming from nonlinear dynamic analysis: deformed shape (elevation view) of East end North façade of Model B (asymmetric) for the even stages
CONCLUSIONS
The paper presents the interpretation and, then, the numerical simulation of the experimental campaign on two masonry mock-ups, performed on the shaking table at Laboratório Nacional de Engenharia Civil (LNEC) in Lisbon.
In general, the equivalent frame modelling strategy adopted revealed to be quite reliable on simulating the actual response of two models. After an initial proper calibration of mechanical parameters, based on experimental results available on a similar masonry type and based on widely accepted criteria, no additional tuning was necessary. This represents a validation of the robustness of the equivalent frame approach in describing the seismic response of two models characterized by a symmetric and asymmetric configurations.
Moreover, among the different tools adopted to interpret the results, the POD technique revealed to be quite effective to capture the dominant dynamic response of such structures. Future research developments could be addressed to corroborate their use in interpreting the results of nonlinear dynamic analyses also for the aim of defining seismic assessment procedures.
Experimental Numerical (TREMURI)
Eas t F ac ad e N or th F ac ad e
12
AKNOWLEDGMENTS
The experimental testing campaign has received funding from the European Union Seventh Framework Programme (FP7/2007-2013) under grant agreement n° 227887, SERIES. In particular, the authors are grateful to the colleagues of LNEC (Earthquake Engineering Division) who carried out the shake table tests, as well as to Dr. Jaeger from Wienerberger and Dr. Lu who coordinated the project and provided the material for testing. C. Mordant also acknowledges the support received from FRIA.
REFERENCES
ASCE/SEI 41-06 (2007) “Seismic Rehabilitation of Existing Buildings”, American Society of Civil Engineers, Reston, VA
Beyer K, Dazio A. (2012) “Quasi-static cyclic tests on masonry spandrels”, Earthquake Spectra, 28(3): 907-929. Calderini C, Cattari S, Lagomarsino S (2009) “In-plane strength of unreinforced masonry piers”, Earthquake
Engineering and Structural Dynamics, 38(2), pp. 243-267
Cattari S (2014) “Static and dynamic analysis of masonry buildings: nonlinear models for piers and spandrels”, Bulletin of Earthquake Engineering, submitted
Cattari S, Lagomarsino S (2013) “Seismic assessment of mixed masonry-reinforced concrete buildings by non-linear static analyses”, Earthquake and Structures, 4(3):241-264,Techno-Press, ISSN:2092-7614
Cattari S, Lagomarsino S (2013) “Analisi non lineari per la simulazione del danno di un fabbricato in San Felice sul Panaro (Emilia, 2012)”, Proceedings of XV Convegno ANIDIS “L’Ingegneria Sismica in Italia”, Padova, 1-4 July 2013, paper no. G12 , Padova University Press, CD-Rom (in Italian)
Deliverable D 4.4+4.5 (2007) “Report on the verification of the design model with test results of WP 6, 7 and 8 and Final report on the integral shear model and its verification by experimental results”, ESECMaSE Project -Enhanced Safety and Efficient Construction of Masonry Structures in Europe, available at: http://www.esecmase.org/doc/deliverables_public/D_4.4+4.5._TUD.pdf
Deliverable D 7.1 (2007) “Test results on the behaviour of masonry under static (monotonic and cyclic) in plane lateral loads”, ESECMaSE Project -Enhanced Safety and Efficient Construction of Masonry Structures in Europe, available at: http://www.esecmase.org/doc/deliverables_public/D_7.1_UNIK.pdf
EN 1998-3 (2005) “Eurocode 8: Design of structures for earthquake resistance - Part 3: Assessment and retrofitting of buildings”, CEN (European Committee for Standardization), Brussels, Belgium
Han S, Feeny B (2003) “Application of proper orthogonal decomposition to structural vibration analysis”, Mechanical Systems and Signal Processing, Vol.17, Issue 5, pp.989-1001, 2003.
Jaeger A, Mendes L, Degèe H, Mordant C, Lu S (2014) “Rütteltisch-Versuche an Gebaüden aus wärmedämmendem Ziegelmauerwerk", Mauerwerk vol. 18(2), 2014, 67-77
Lagomarsino S, Penna A, Galasco A, Cattari S (2013) “TREMURI program: an equivalent frame model for the nonlinear seismic analysis of masonry buildings”, Engineering Structures, 56: 1787-1799
Lagomarsino S, Cattari S (2014) “Seismic Performance of Historical Masonry Structures Through Pushover and Nonlinear Dynamic Analyses”, 2ECEES book (Ed. A. Ansal), Springer (in preparation)
Lu S, Jaeger A., Degèe H, Mordant C, Chioccariello A, Rakizevic Z, Sendova V, Candeias P, Mendes L, Campos Costa P, Coelho E (2014) Two full-scale shaking table tests of two-storey modern thermal insulation clay block masonry buildings including nonlinear pushover analysis, Proceedings of the 2ECEES conference, 24-29 August, Istanbul.
Mann W, Müller H (1980) “Failure of shear-stressed masonry - An enlarged theory, tests and application to shear-walls”, Proceedings of the International Symposium on Loadbearing Brickwork, London, 1-13. Magenes G, Calvi GM (1997) “In-plane seismic response of brick masonry walls”, Earthquake Engineering and
Structural Dynamics; 26:1091-1112
Mendes L, Candeias P, Correia A, Costa AC, Coelho E, Jäger A, Lu S, Degee H, Mordant C (2014) “Full scale testing of modern unreinforced thermal insulation clay block masonry houses”, Proceedings of the 9th International Masonry Conference, 7-9/7/2014, Guimaraes, Portugal.
NTC 2008 “Decreto Ministeriale 14/1/2008. Norme tecniche per le costruzioni”, Ministry of Infrastructures and Transportations. G.U. S.O. n.30 on 4/2/2008; 2008 (in Italian).
Solari G, Carassale L, Tubino F (2007) “Proper Orthogonal Decomposition in wind engineering. Part 1: A state-of-the-art and some prospects”, Wind and Structures, 10:153-176, ISSN: 1226-6116, 2007.
Vamvatsikos D, Cornell CA (2002) “Incremental dynamic analysis”,Earthquake Engineering & Structural Dynamics, 31(3): 491-514
Van Overschee P, De Moor B (1994) “N4SID: Subspace algorithms for the identification of combined deterministic-stochastic systems”, Automatica, Special Issue on Statistical Processing and Control, 30(1):75-9