IFAC PapersOnLine 51-27 (2018) 140–145
ScienceDirect
Available online at www.sciencedirect.com
2405-8963 © 2018, IFAC (International Federation of Automatic Control) Hosting by Elsevier Ltd. All rights reserved. Peer review under responsibility of International Federation of Automatic Control.
10.1016/j.ifacol.2018.11.653
A Simplified Waveform Energetics Approach to Interpreting Arterial and
Venous Pressure
Shaun M. Davidson*, Joel Balmer*, Chris Pretty*, Thomas Desaive**, J. Geoffrey Chase*
*Department of Mechanical Engineering, University of Canterbury, Christchurch, New Zealand (e-mail: shaun.davidson@pg.canterbury.ac.nz)
**GIGA-Cardiovascular Sciences, University of Liège, Liège, Belgium (e-mail: tdesaive@ulg.ac.be)
Abstract: This paper develops a novel methodology for extracting simple, beat-to-beat, lumped metrics of
systemic circulation performance by comparing the catheter pressure waveforms from the femoral artery and vena cava. Their diagnostic potential is compared to the similar, clinically used metric ΔMP, the drop in mean blood pressure between the aorta and vena cava, across an experimental cohort encompassing the progression of sepsis and several clinical interventions known to alter circulatory state. Both Ofe→vc, the
model derived pressure attenuation between the femoral artery and vena cava, and the clinical metric, ΔMP, performed well. However, Ofe→vc reduced the optimal average time to sepsis detection from endotoxin
infusion from 46.2 minutes for ΔMP to 11.6 minutes, for a slight increase in false positive rate from 1.8% to 6.2%. Thus, the potential diagnostic benefits of this novel approach are demonstrated, and a case is made for further investigation.
Keywords: Bio-signal analysis, processing and interpretation; Cardiovascular system; Decision support
systems
1. INTRODUCTION
Sepsis is a type of distributive shock that drives myocardial depression (Hunter and Doddi, 2010), and is a significant contributor to intensive care unit (ICU) admissions, with 10.4% of ICU admissions in the US attributed, and mortality, with an associated mortality rate of 20 – 50% (Martin et al., 2003). The effects of sepsis are often compounded by inadequate or incorrect diagnosis in the ICU, which leads to increased length of stay, cost and mortality, further inflating these figures (Angus et al., 2001; Pineda et al., 2001). ICU management of conditions, such as sepsis, frequently relies on information rich pressure measurements from catheters situated in the arteries and veins near the heart. However, despite the information rich nature of these waveforms, the use of catheters is not necessarily associated with improved clinical outcomes (Frazier and Skinner, 2008; Chatterjee, 2009).
One of the possible reasons for this outcome is the ability of the human mind to simultaneously track only three to four variables effectively (Halford et al., 2005). ICU clinicians are frequently presented with a far greater volume of information. Clinicians are thus forced to rely on simplifications of the large amount of measured information, such as mean pressures instead of pressure waveforms, to allow for easy and rapid interpretation of this information. Thus, improved methods for the simplification, abstraction and synthesis of clinical information from these waveforms to ensure the most relevant pieces of clinical information are extracted and presented to clinicians in an easy to interpret fashion has the potential to
bring significant benefits to patient diagnosis and titration of treatment.
As a distributive shock condition, sepsis primarily effects the peripheral areas of the systemic circulation. Fortunately, pressure catheters are frequently situated in the systemic circulation in the ICU, popularly in the aorta, femoral artery or vena cava (Gershengorn et al., 2014b; Gershengorn et al., 2014a; Harvey et al., 2005). While the situation of catheters in the periphery itself is impossible due to the small diameter of peripheral blood vessels, the pressure wave passing from artery to vein via the periphery should be modulated by, and thus contain information on the condition of, these peripheral blood vessels. This paper explores a means of extracting information about the condition of the systemic circulation by comparing associated arterial and venous pressure waveforms without fully modelling the circulatory system, an approach that could offer significant insight for relatively little effort. There are several popular, existing methods for the comparison of input and output waveforms, such as arterial and venous pressures. Among the most common are transfer functions, frequently generated using fast Fourier transforms (Welch, 1967) or empirical mode decomposition (Huang et al., 1998). While both approaches have proven effective at information extraction, neither is able to effectively incorporate the extensive a-priori knowledge available about the circulatory system, or directly account for the effects on either waveform by active circulatory components such as the heart. In addition, transfer functions output a full spectra for each heartbeat analysed, which is not necessarily easier to rapidly interpret in a clinical environment than the catheter waveform itself. An
10th IFAC Symposium on Biological and Medical Systems São Paulo, Brazil, September 3-5, 2018
Copyright © 2018 IFAC 140
© 2018, IFAC (International Federation of Automatic Control) Hosting by Elsevier Ltd. All rights reserved.
A Simplified Waveform Energetics Approach to Interpreting Arterial and
Venous Pressure
Shaun M. Davidson*, Joel Balmer*, Chris Pretty*, Thomas Desaive**, J. Geoffrey Chase*
*Department of Mechanical Engineering, University of Canterbury, Christchurch, New Zealand (e-mail: shaun.davidson@pg.canterbury.ac.nz)
**GIGA-Cardiovascular Sciences, University of Liège, Liège, Belgium (e-mail: tdesaive@ulg.ac.be)
Abstract: This paper develops a novel methodology for extracting simple, beat-to-beat, lumped metrics of
systemic circulation performance by comparing the catheter pressure waveforms from the femoral artery and vena cava. Their diagnostic potential is compared to the similar, clinically used metric ΔMP, the drop in mean blood pressure between the aorta and vena cava, across an experimental cohort encompassing the progression of sepsis and several clinical interventions known to alter circulatory state. Both Ofe→vc, the
model derived pressure attenuation between the femoral artery and vena cava, and the clinical metric, ΔMP, performed well. However, Ofe→vc reduced the optimal average time to sepsis detection from endotoxin
infusion from 46.2 minutes for ΔMP to 11.6 minutes, for a slight increase in false positive rate from 1.8% to 6.2%. Thus, the potential diagnostic benefits of this novel approach are demonstrated, and a case is made for further investigation.
Keywords: Bio-signal analysis, processing and interpretation; Cardiovascular system; Decision support
systems
1. INTRODUCTION
Sepsis is a type of distributive shock that drives myocardial depression (Hunter and Doddi, 2010), and is a significant contributor to intensive care unit (ICU) admissions, with 10.4% of ICU admissions in the US attributed, and mortality, with an associated mortality rate of 20 – 50% (Martin et al., 2003). The effects of sepsis are often compounded by inadequate or incorrect diagnosis in the ICU, which leads to increased length of stay, cost and mortality, further inflating these figures (Angus et al., 2001; Pineda et al., 2001). ICU management of conditions, such as sepsis, frequently relies on information rich pressure measurements from catheters situated in the arteries and veins near the heart. However, despite the information rich nature of these waveforms, the use of catheters is not necessarily associated with improved clinical outcomes (Frazier and Skinner, 2008; Chatterjee, 2009).
One of the possible reasons for this outcome is the ability of the human mind to simultaneously track only three to four variables effectively (Halford et al., 2005). ICU clinicians are frequently presented with a far greater volume of information. Clinicians are thus forced to rely on simplifications of the large amount of measured information, such as mean pressures instead of pressure waveforms, to allow for easy and rapid interpretation of this information. Thus, improved methods for the simplification, abstraction and synthesis of clinical information from these waveforms to ensure the most relevant pieces of clinical information are extracted and presented to clinicians in an easy to interpret fashion has the potential to
bring significant benefits to patient diagnosis and titration of treatment.
As a distributive shock condition, sepsis primarily effects the peripheral areas of the systemic circulation. Fortunately, pressure catheters are frequently situated in the systemic circulation in the ICU, popularly in the aorta, femoral artery or vena cava (Gershengorn et al., 2014b; Gershengorn et al., 2014a; Harvey et al., 2005). While the situation of catheters in the periphery itself is impossible due to the small diameter of peripheral blood vessels, the pressure wave passing from artery to vein via the periphery should be modulated by, and thus contain information on the condition of, these peripheral blood vessels. This paper explores a means of extracting information about the condition of the systemic circulation by comparing associated arterial and venous pressure waveforms without fully modelling the circulatory system, an approach that could offer significant insight for relatively little effort. There are several popular, existing methods for the comparison of input and output waveforms, such as arterial and venous pressures. Among the most common are transfer functions, frequently generated using fast Fourier transforms (Welch, 1967) or empirical mode decomposition (Huang et al., 1998). While both approaches have proven effective at information extraction, neither is able to effectively incorporate the extensive a-priori knowledge available about the circulatory system, or directly account for the effects on either waveform by active circulatory components such as the heart. In addition, transfer functions output a full spectra for each heartbeat analysed, which is not necessarily easier to rapidly interpret in a clinical environment than the catheter waveform itself. An
10th IFAC Symposium on Biological and Medical Systems São Paulo, Brazil, September 3-5, 2018
Copyright © 2018 IFAC
140
A Simplified Waveform Energetics Approach to Interpreting Arterial and
Venous Pressure
Shaun M. Davidson*, Joel Balmer*, Chris Pretty*, Thomas Desaive**, J. Geoffrey Chase*
*Department of Mechanical Engineering, University of Canterbury, Christchurch, New Zealand (e-mail: shaun.davidson@pg.canterbury.ac.nz)
**GIGA-Cardiovascular Sciences, University of Liège, Liège, Belgium (e-mail: tdesaive@ulg.ac.be)
Abstract: This paper develops a novel methodology for extracting simple, beat-to-beat, lumped metrics of
systemic circulation performance by comparing the catheter pressure waveforms from the femoral artery and vena cava. Their diagnostic potential is compared to the similar, clinically used metric ΔMP, the drop in mean blood pressure between the aorta and vena cava, across an experimental cohort encompassing the progression of sepsis and several clinical interventions known to alter circulatory state. Both Ofe→vc, the
model derived pressure attenuation between the femoral artery and vena cava, and the clinical metric, ΔMP, performed well. However, Ofe→vc reduced the optimal average time to sepsis detection from endotoxin
infusion from 46.2 minutes for ΔMP to 11.6 minutes, for a slight increase in false positive rate from 1.8% to 6.2%. Thus, the potential diagnostic benefits of this novel approach are demonstrated, and a case is made for further investigation.
Keywords: Bio-signal analysis, processing and interpretation; Cardiovascular system; Decision support
systems
1. INTRODUCTION
Sepsis is a type of distributive shock that drives myocardial depression (Hunter and Doddi, 2010), and is a significant contributor to intensive care unit (ICU) admissions, with 10.4% of ICU admissions in the US attributed, and mortality, with an associated mortality rate of 20 – 50% (Martin et al., 2003). The effects of sepsis are often compounded by inadequate or incorrect diagnosis in the ICU, which leads to increased length of stay, cost and mortality, further inflating these figures (Angus et al., 2001; Pineda et al., 2001). ICU management of conditions, such as sepsis, frequently relies on information rich pressure measurements from catheters situated in the arteries and veins near the heart. However, despite the information rich nature of these waveforms, the use of catheters is not necessarily associated with improved clinical outcomes (Frazier and Skinner, 2008; Chatterjee, 2009).
One of the possible reasons for this outcome is the ability of the human mind to simultaneously track only three to four variables effectively (Halford et al., 2005). ICU clinicians are frequently presented with a far greater volume of information. Clinicians are thus forced to rely on simplifications of the large amount of measured information, such as mean pressures instead of pressure waveforms, to allow for easy and rapid interpretation of this information. Thus, improved methods for the simplification, abstraction and synthesis of clinical information from these waveforms to ensure the most relevant pieces of clinical information are extracted and presented to clinicians in an easy to interpret fashion has the potential to
bring significant benefits to patient diagnosis and titration of treatment.
As a distributive shock condition, sepsis primarily effects the peripheral areas of the systemic circulation. Fortunately, pressure catheters are frequently situated in the systemic circulation in the ICU, popularly in the aorta, femoral artery or vena cava (Gershengorn et al., 2014b; Gershengorn et al., 2014a; Harvey et al., 2005). While the situation of catheters in the periphery itself is impossible due to the small diameter of peripheral blood vessels, the pressure wave passing from artery to vein via the periphery should be modulated by, and thus contain information on the condition of, these peripheral blood vessels. This paper explores a means of extracting information about the condition of the systemic circulation by comparing associated arterial and venous pressure waveforms without fully modelling the circulatory system, an approach that could offer significant insight for relatively little effort. There are several popular, existing methods for the comparison of input and output waveforms, such as arterial and venous pressures. Among the most common are transfer functions, frequently generated using fast Fourier transforms (Welch, 1967) or empirical mode decomposition (Huang et al., 1998). While both approaches have proven effective at information extraction, neither is able to effectively incorporate the extensive a-priori knowledge available about the circulatory system, or directly account for the effects on either waveform by active circulatory components such as the heart. In addition, transfer functions output a full spectra for each heartbeat analysed, which is not necessarily easier to rapidly interpret in a clinical environment than the catheter waveform itself. An
10th IFAC Symposium on Biological and Medical Systems São Paulo, Brazil, September 3-5, 2018
Copyright © 2018 IFAC 140
A Simplified Waveform Energetics Approach to Interpreting Arterial and
Venous Pressure
Shaun M. Davidson*, Joel Balmer*, Chris Pretty*, Thomas Desaive**, J. Geoffrey Chase*
*Department of Mechanical Engineering, University of Canterbury, Christchurch, New Zealand (e-mail: shaun.davidson@pg.canterbury.ac.nz)
**GIGA-Cardiovascular Sciences, University of Liège, Liège, Belgium (e-mail: tdesaive@ulg.ac.be)
Abstract: This paper develops a novel methodology for extracting simple, beat-to-beat, lumped metrics of
systemic circulation performance by comparing the catheter pressure waveforms from the femoral artery and vena cava. Their diagnostic potential is compared to the similar, clinically used metric ΔMP, the drop in mean blood pressure between the aorta and vena cava, across an experimental cohort encompassing the progression of sepsis and several clinical interventions known to alter circulatory state. Both Ofe→vc, the
model derived pressure attenuation between the femoral artery and vena cava, and the clinical metric, ΔMP, performed well. However, Ofe→vc reduced the optimal average time to sepsis detection from endotoxin
infusion from 46.2 minutes for ΔMP to 11.6 minutes, for a slight increase in false positive rate from 1.8% to 6.2%. Thus, the potential diagnostic benefits of this novel approach are demonstrated, and a case is made for further investigation.
Keywords: Bio-signal analysis, processing and interpretation; Cardiovascular system; Decision support
systems
1. INTRODUCTION
Sepsis is a type of distributive shock that drives myocardial depression (Hunter and Doddi, 2010), and is a significant contributor to intensive care unit (ICU) admissions, with 10.4% of ICU admissions in the US attributed, and mortality, with an associated mortality rate of 20 – 50% (Martin et al., 2003). The effects of sepsis are often compounded by inadequate or incorrect diagnosis in the ICU, which leads to increased length of stay, cost and mortality, further inflating these figures (Angus et al., 2001; Pineda et al., 2001). ICU management of conditions, such as sepsis, frequently relies on information rich pressure measurements from catheters situated in the arteries and veins near the heart. However, despite the information rich nature of these waveforms, the use of catheters is not necessarily associated with improved clinical outcomes (Frazier and Skinner, 2008; Chatterjee, 2009).
One of the possible reasons for this outcome is the ability of the human mind to simultaneously track only three to four variables effectively (Halford et al., 2005). ICU clinicians are frequently presented with a far greater volume of information. Clinicians are thus forced to rely on simplifications of the large amount of measured information, such as mean pressures instead of pressure waveforms, to allow for easy and rapid interpretation of this information. Thus, improved methods for the simplification, abstraction and synthesis of clinical information from these waveforms to ensure the most relevant pieces of clinical information are extracted and presented to clinicians in an easy to interpret fashion has the potential to
bring significant benefits to patient diagnosis and titration of treatment.
As a distributive shock condition, sepsis primarily effects the peripheral areas of the systemic circulation. Fortunately, pressure catheters are frequently situated in the systemic circulation in the ICU, popularly in the aorta, femoral artery or vena cava (Gershengorn et al., 2014b; Gershengorn et al., 2014a; Harvey et al., 2005). While the situation of catheters in the periphery itself is impossible due to the small diameter of peripheral blood vessels, the pressure wave passing from artery to vein via the periphery should be modulated by, and thus contain information on the condition of, these peripheral blood vessels. This paper explores a means of extracting information about the condition of the systemic circulation by comparing associated arterial and venous pressure waveforms without fully modelling the circulatory system, an approach that could offer significant insight for relatively little effort. There are several popular, existing methods for the comparison of input and output waveforms, such as arterial and venous pressures. Among the most common are transfer functions, frequently generated using fast Fourier transforms (Welch, 1967) or empirical mode decomposition (Huang et al., 1998). While both approaches have proven effective at information extraction, neither is able to effectively incorporate the extensive a-priori knowledge available about the circulatory system, or directly account for the effects on either waveform by active circulatory components such as the heart. In addition, transfer functions output a full spectra for each heartbeat analysed, which is not necessarily easier to rapidly interpret in a clinical environment than the catheter waveform itself. An
10th IFAC Symposium on Biological and Medical Systems São Paulo, Brazil, September 3-5, 2018
Shaun M. Davidson et al. / IFAC PapersOnLine 51-27 (2018) 140–145 141
A Simplified Waveform Energetics Approach to Interpreting Arterial and
Venous Pressure
Shaun M. Davidson*, Joel Balmer*, Chris Pretty*, Thomas Desaive**, J. Geoffrey Chase*
*Department of Mechanical Engineering, University of Canterbury, Christchurch, New Zealand (e-mail: shaun.davidson@pg.canterbury.ac.nz)
**GIGA-Cardiovascular Sciences, University of Liège, Liège, Belgium (e-mail: tdesaive@ulg.ac.be)
Abstract: This paper develops a novel methodology for extracting simple, beat-to-beat, lumped metrics of
systemic circulation performance by comparing the catheter pressure waveforms from the femoral artery and vena cava. Their diagnostic potential is compared to the similar, clinically used metric ΔMP, the drop in mean blood pressure between the aorta and vena cava, across an experimental cohort encompassing the progression of sepsis and several clinical interventions known to alter circulatory state. Both Ofe→vc, the
model derived pressure attenuation between the femoral artery and vena cava, and the clinical metric, ΔMP, performed well. However, Ofe→vc reduced the optimal average time to sepsis detection from endotoxin
infusion from 46.2 minutes for ΔMP to 11.6 minutes, for a slight increase in false positive rate from 1.8% to 6.2%. Thus, the potential diagnostic benefits of this novel approach are demonstrated, and a case is made for further investigation.
Keywords: Bio-signal analysis, processing and interpretation; Cardiovascular system; Decision support
systems
1. INTRODUCTION
Sepsis is a type of distributive shock that drives myocardial depression (Hunter and Doddi, 2010), and is a significant contributor to intensive care unit (ICU) admissions, with 10.4% of ICU admissions in the US attributed, and mortality, with an associated mortality rate of 20 – 50% (Martin et al., 2003). The effects of sepsis are often compounded by inadequate or incorrect diagnosis in the ICU, which leads to increased length of stay, cost and mortality, further inflating these figures (Angus et al., 2001; Pineda et al., 2001). ICU management of conditions, such as sepsis, frequently relies on information rich pressure measurements from catheters situated in the arteries and veins near the heart. However, despite the information rich nature of these waveforms, the use of catheters is not necessarily associated with improved clinical outcomes (Frazier and Skinner, 2008; Chatterjee, 2009).
One of the possible reasons for this outcome is the ability of the human mind to simultaneously track only three to four variables effectively (Halford et al., 2005). ICU clinicians are frequently presented with a far greater volume of information. Clinicians are thus forced to rely on simplifications of the large amount of measured information, such as mean pressures instead of pressure waveforms, to allow for easy and rapid interpretation of this information. Thus, improved methods for the simplification, abstraction and synthesis of clinical information from these waveforms to ensure the most relevant pieces of clinical information are extracted and presented to clinicians in an easy to interpret fashion has the potential to
bring significant benefits to patient diagnosis and titration of treatment.
As a distributive shock condition, sepsis primarily effects the peripheral areas of the systemic circulation. Fortunately, pressure catheters are frequently situated in the systemic circulation in the ICU, popularly in the aorta, femoral artery or vena cava (Gershengorn et al., 2014b; Gershengorn et al., 2014a; Harvey et al., 2005). While the situation of catheters in the periphery itself is impossible due to the small diameter of peripheral blood vessels, the pressure wave passing from artery to vein via the periphery should be modulated by, and thus contain information on the condition of, these peripheral blood vessels. This paper explores a means of extracting information about the condition of the systemic circulation by comparing associated arterial and venous pressure waveforms without fully modelling the circulatory system, an approach that could offer significant insight for relatively little effort. There are several popular, existing methods for the comparison of input and output waveforms, such as arterial and venous pressures. Among the most common are transfer functions, frequently generated using fast Fourier transforms (Welch, 1967) or empirical mode decomposition (Huang et al., 1998). While both approaches have proven effective at information extraction, neither is able to effectively incorporate the extensive a-priori knowledge available about the circulatory system, or directly account for the effects on either waveform by active circulatory components such as the heart. In addition, transfer functions output a full spectra for each heartbeat analysed, which is not necessarily easier to rapidly interpret in a clinical environment than the catheter waveform itself. An
Copyright © 2018 IFAC 140
A Simplified Waveform Energetics Approach to Interpreting Arterial and
Venous Pressure
Shaun M. Davidson*, Joel Balmer*, Chris Pretty*, Thomas Desaive**, J. Geoffrey Chase*
*Department of Mechanical Engineering, University of Canterbury, Christchurch, New Zealand (e-mail: shaun.davidson@pg.canterbury.ac.nz)
**GIGA-Cardiovascular Sciences, University of Liège, Liège, Belgium (e-mail: tdesaive@ulg.ac.be)
Abstract: This paper develops a novel methodology for extracting simple, beat-to-beat, lumped metrics of
systemic circulation performance by comparing the catheter pressure waveforms from the femoral artery and vena cava. Their diagnostic potential is compared to the similar, clinically used metric ΔMP, the drop in mean blood pressure between the aorta and vena cava, across an experimental cohort encompassing the progression of sepsis and several clinical interventions known to alter circulatory state. Both Ofe→vc, the
model derived pressure attenuation between the femoral artery and vena cava, and the clinical metric, ΔMP, performed well. However, Ofe→vc reduced the optimal average time to sepsis detection from endotoxin
infusion from 46.2 minutes for ΔMP to 11.6 minutes, for a slight increase in false positive rate from 1.8% to 6.2%. Thus, the potential diagnostic benefits of this novel approach are demonstrated, and a case is made for further investigation.
Keywords: Bio-signal analysis, processing and interpretation; Cardiovascular system; Decision support
systems
1. INTRODUCTION
Sepsis is a type of distributive shock that drives myocardial depression (Hunter and Doddi, 2010), and is a significant contributor to intensive care unit (ICU) admissions, with 10.4% of ICU admissions in the US attributed, and mortality, with an associated mortality rate of 20 – 50% (Martin et al., 2003). The effects of sepsis are often compounded by inadequate or incorrect diagnosis in the ICU, which leads to increased length of stay, cost and mortality, further inflating these figures (Angus et al., 2001; Pineda et al., 2001). ICU management of conditions, such as sepsis, frequently relies on information rich pressure measurements from catheters situated in the arteries and veins near the heart. However, despite the information rich nature of these waveforms, the use of catheters is not necessarily associated with improved clinical outcomes (Frazier and Skinner, 2008; Chatterjee, 2009).
One of the possible reasons for this outcome is the ability of the human mind to simultaneously track only three to four variables effectively (Halford et al., 2005). ICU clinicians are frequently presented with a far greater volume of information. Clinicians are thus forced to rely on simplifications of the large amount of measured information, such as mean pressures instead of pressure waveforms, to allow for easy and rapid interpretation of this information. Thus, improved methods for the simplification, abstraction and synthesis of clinical information from these waveforms to ensure the most relevant pieces of clinical information are extracted and presented to clinicians in an easy to interpret fashion has the potential to
bring significant benefits to patient diagnosis and titration of treatment.
As a distributive shock condition, sepsis primarily effects the peripheral areas of the systemic circulation. Fortunately, pressure catheters are frequently situated in the systemic circulation in the ICU, popularly in the aorta, femoral artery or vena cava (Gershengorn et al., 2014b; Gershengorn et al., 2014a; Harvey et al., 2005). While the situation of catheters in the periphery itself is impossible due to the small diameter of peripheral blood vessels, the pressure wave passing from artery to vein via the periphery should be modulated by, and thus contain information on the condition of, these peripheral blood vessels. This paper explores a means of extracting information about the condition of the systemic circulation by comparing associated arterial and venous pressure waveforms without fully modelling the circulatory system, an approach that could offer significant insight for relatively little effort. There are several popular, existing methods for the comparison of input and output waveforms, such as arterial and venous pressures. Among the most common are transfer functions, frequently generated using fast Fourier transforms (Welch, 1967) or empirical mode decomposition (Huang et al., 1998). While both approaches have proven effective at information extraction, neither is able to effectively incorporate the extensive a-priori knowledge available about the circulatory system, or directly account for the effects on either waveform by active circulatory components such as the heart. In addition, transfer functions output a full spectra for each heartbeat analysed, which is not necessarily easier to rapidly interpret in a clinical environment than the catheter waveform itself. An
10th IFAC Symposium on Biological and Medical Systems São Paulo, Brazil, September 3-5, 2018
A Simplified Waveform Energetics Approach to Interpreting Arterial and
Venous Pressure
Shaun M. Davidson*, Joel Balmer*, Chris Pretty*, Thomas Desaive**, J. Geoffrey Chase*
*Department of Mechanical Engineering, University of Canterbury, Christchurch, New Zealand (e-mail: shaun.davidson@pg.canterbury.ac.nz)
**GIGA-Cardiovascular Sciences, University of Liège, Liège, Belgium (e-mail: tdesaive@ulg.ac.be)
Abstract: This paper develops a novel methodology for extracting simple, beat-to-beat, lumped metrics of
systemic circulation performance by comparing the catheter pressure waveforms from the femoral artery and vena cava. Their diagnostic potential is compared to the similar, clinically used metric ΔMP, the drop in mean blood pressure between the aorta and vena cava, across an experimental cohort encompassing the progression of sepsis and several clinical interventions known to alter circulatory state. Both Ofe→vc, the
model derived pressure attenuation between the femoral artery and vena cava, and the clinical metric, ΔMP, performed well. However, Ofe→vc reduced the optimal average time to sepsis detection from endotoxin
infusion from 46.2 minutes for ΔMP to 11.6 minutes, for a slight increase in false positive rate from 1.8% to 6.2%. Thus, the potential diagnostic benefits of this novel approach are demonstrated, and a case is made for further investigation.
Keywords: Bio-signal analysis, processing and interpretation; Cardiovascular system; Decision support
systems
1. INTRODUCTION
Sepsis is a type of distributive shock that drives myocardial depression (Hunter and Doddi, 2010), and is a significant contributor to intensive care unit (ICU) admissions, with 10.4% of ICU admissions in the US attributed, and mortality, with an associated mortality rate of 20 – 50% (Martin et al., 2003). The effects of sepsis are often compounded by inadequate or incorrect diagnosis in the ICU, which leads to increased length of stay, cost and mortality, further inflating these figures (Angus et al., 2001; Pineda et al., 2001). ICU management of conditions, such as sepsis, frequently relies on information rich pressure measurements from catheters situated in the arteries and veins near the heart. However, despite the information rich nature of these waveforms, the use of catheters is not necessarily associated with improved clinical outcomes (Frazier and Skinner, 2008; Chatterjee, 2009).
One of the possible reasons for this outcome is the ability of the human mind to simultaneously track only three to four variables effectively (Halford et al., 2005). ICU clinicians are frequently presented with a far greater volume of information. Clinicians are thus forced to rely on simplifications of the large amount of measured information, such as mean pressures instead of pressure waveforms, to allow for easy and rapid interpretation of this information. Thus, improved methods for the simplification, abstraction and synthesis of clinical information from these waveforms to ensure the most relevant pieces of clinical information are extracted and presented to clinicians in an easy to interpret fashion has the potential to
bring significant benefits to patient diagnosis and titration of treatment.
As a distributive shock condition, sepsis primarily effects the peripheral areas of the systemic circulation. Fortunately, pressure catheters are frequently situated in the systemic circulation in the ICU, popularly in the aorta, femoral artery or vena cava (Gershengorn et al., 2014b; Gershengorn et al., 2014a; Harvey et al., 2005). While the situation of catheters in the periphery itself is impossible due to the small diameter of peripheral blood vessels, the pressure wave passing from artery to vein via the periphery should be modulated by, and thus contain information on the condition of, these peripheral blood vessels. This paper explores a means of extracting information about the condition of the systemic circulation by comparing associated arterial and venous pressure waveforms without fully modelling the circulatory system, an approach that could offer significant insight for relatively little effort. There are several popular, existing methods for the comparison of input and output waveforms, such as arterial and venous pressures. Among the most common are transfer functions, frequently generated using fast Fourier transforms (Welch, 1967) or empirical mode decomposition (Huang et al., 1998). While both approaches have proven effective at information extraction, neither is able to effectively incorporate the extensive a-priori knowledge available about the circulatory system, or directly account for the effects on either waveform by active circulatory components such as the heart. In addition, transfer functions output a full spectra for each heartbeat analysed, which is not necessarily easier to rapidly interpret in a clinical environment than the catheter waveform itself. An
São Paulo, Brazil, September 3-5, 2018
A Simplified Waveform Energetics Approach to Interpreting Arterial and
Venous Pressure
Shaun M. Davidson*, Joel Balmer*, Chris Pretty*, Thomas Desaive**, J. Geoffrey Chase*
*Department of Mechanical Engineering, University of Canterbury, Christchurch, New Zealand (e-mail: shaun.davidson@pg.canterbury.ac.nz)
**GIGA-Cardiovascular Sciences, University of Liège, Liège, Belgium (e-mail: tdesaive@ulg.ac.be)
Abstract: This paper develops a novel methodology for extracting simple, beat-to-beat, lumped metrics of
systemic circulation performance by comparing the catheter pressure waveforms from the femoral artery and vena cava. Their diagnostic potential is compared to the similar, clinically used metric ΔMP, the drop in mean blood pressure between the aorta and vena cava, across an experimental cohort encompassing the progression of sepsis and several clinical interventions known to alter circulatory state. Both Ofe→vc, the
model derived pressure attenuation between the femoral artery and vena cava, and the clinical metric, ΔMP, performed well. However, Ofe→vc reduced the optimal average time to sepsis detection from endotoxin
infusion from 46.2 minutes for ΔMP to 11.6 minutes, for a slight increase in false positive rate from 1.8% to 6.2%. Thus, the potential diagnostic benefits of this novel approach are demonstrated, and a case is made for further investigation.
Keywords: Bio-signal analysis, processing and interpretation; Cardiovascular system; Decision support
systems
1. INTRODUCTION
Sepsis is a type of distributive shock that drives myocardial depression (Hunter and Doddi, 2010), and is a significant contributor to intensive care unit (ICU) admissions, with 10.4% of ICU admissions in the US attributed, and mortality, with an associated mortality rate of 20 – 50% (Martin et al., 2003). The effects of sepsis are often compounded by inadequate or incorrect diagnosis in the ICU, which leads to increased length of stay, cost and mortality, further inflating these figures (Angus et al., 2001; Pineda et al., 2001). ICU management of conditions, such as sepsis, frequently relies on information rich pressure measurements from catheters situated in the arteries and veins near the heart. However, despite the information rich nature of these waveforms, the use of catheters is not necessarily associated with improved clinical outcomes (Frazier and Skinner, 2008; Chatterjee, 2009).
One of the possible reasons for this outcome is the ability of the human mind to simultaneously track only three to four variables effectively (Halford et al., 2005). ICU clinicians are frequently presented with a far greater volume of information. Clinicians are thus forced to rely on simplifications of the large amount of measured information, such as mean pressures instead of pressure waveforms, to allow for easy and rapid interpretation of this information. Thus, improved methods for the simplification, abstraction and synthesis of clinical information from these waveforms to ensure the most relevant pieces of clinical information are extracted and presented to clinicians in an easy to interpret fashion has the potential to
bring significant benefits to patient diagnosis and titration of treatment.
As a distributive shock condition, sepsis primarily effects the peripheral areas of the systemic circulation. Fortunately, pressure catheters are frequently situated in the systemic circulation in the ICU, popularly in the aorta, femoral artery or vena cava (Gershengorn et al., 2014b; Gershengorn et al., 2014a; Harvey et al., 2005). While the situation of catheters in the periphery itself is impossible due to the small diameter of peripheral blood vessels, the pressure wave passing from artery to vein via the periphery should be modulated by, and thus contain information on the condition of, these peripheral blood vessels. This paper explores a means of extracting information about the condition of the systemic circulation by comparing associated arterial and venous pressure waveforms without fully modelling the circulatory system, an approach that could offer significant insight for relatively little effort. There are several popular, existing methods for the comparison of input and output waveforms, such as arterial and venous pressures. Among the most common are transfer functions, frequently generated using fast Fourier transforms (Welch, 1967) or empirical mode decomposition (Huang et al., 1998). While both approaches have proven effective at information extraction, neither is able to effectively incorporate the extensive a-priori knowledge available about the circulatory system, or directly account for the effects on either waveform by active circulatory components such as the heart. In addition, transfer functions output a full spectra for each heartbeat analysed, which is not necessarily easier to rapidly interpret in a clinical environment than the catheter waveform itself. An
Copyright © 2018 IFAC 140
A Simplified Waveform Energetics Approach to Interpreting Arterial and
Venous Pressure
Shaun M. Davidson*, Joel Balmer*, Chris Pretty*, Thomas Desaive**, J. Geoffrey Chase*
*Department of Mechanical Engineering, University of Canterbury, Christchurch, New Zealand (e-mail: shaun.davidson@pg.canterbury.ac.nz)
**GIGA-Cardiovascular Sciences, University of Liège, Liège, Belgium (e-mail: tdesaive@ulg.ac.be)
Abstract: This paper develops a novel methodology for extracting simple, beat-to-beat, lumped metrics of
systemic circulation performance by comparing the catheter pressure waveforms from the femoral artery and vena cava. Their diagnostic potential is compared to the similar, clinically used metric ΔMP, the drop in mean blood pressure between the aorta and vena cava, across an experimental cohort encompassing the progression of sepsis and several clinical interventions known to alter circulatory state. Both Ofe→vc, the
model derived pressure attenuation between the femoral artery and vena cava, and the clinical metric, ΔMP, performed well. However, Ofe→vc reduced the optimal average time to sepsis detection from endotoxin
infusion from 46.2 minutes for ΔMP to 11.6 minutes, for a slight increase in false positive rate from 1.8% to 6.2%. Thus, the potential diagnostic benefits of this novel approach are demonstrated, and a case is made for further investigation.
Keywords: Bio-signal analysis, processing and interpretation; Cardiovascular system; Decision support
systems
1. INTRODUCTION
Sepsis is a type of distributive shock that drives myocardial depression (Hunter and Doddi, 2010), and is a significant contributor to intensive care unit (ICU) admissions, with 10.4% of ICU admissions in the US attributed, and mortality, with an associated mortality rate of 20 – 50% (Martin et al., 2003). The effects of sepsis are often compounded by inadequate or incorrect diagnosis in the ICU, which leads to increased length of stay, cost and mortality, further inflating these figures (Angus et al., 2001; Pineda et al., 2001). ICU management of conditions, such as sepsis, frequently relies on information rich pressure measurements from catheters situated in the arteries and veins near the heart. However, despite the information rich nature of these waveforms, the use of catheters is not necessarily associated with improved clinical outcomes (Frazier and Skinner, 2008; Chatterjee, 2009).
One of the possible reasons for this outcome is the ability of the human mind to simultaneously track only three to four variables effectively (Halford et al., 2005). ICU clinicians are frequently presented with a far greater volume of information. Clinicians are thus forced to rely on simplifications of the large amount of measured information, such as mean pressures instead of pressure waveforms, to allow for easy and rapid interpretation of this information. Thus, improved methods for the simplification, abstraction and synthesis of clinical information from these waveforms to ensure the most relevant pieces of clinical information are extracted and presented to clinicians in an easy to interpret fashion has the potential to
bring significant benefits to patient diagnosis and titration of treatment.
As a distributive shock condition, sepsis primarily effects the peripheral areas of the systemic circulation. Fortunately, pressure catheters are frequently situated in the systemic circulation in the ICU, popularly in the aorta, femoral artery or vena cava (Gershengorn et al., 2014b; Gershengorn et al., 2014a; Harvey et al., 2005). While the situation of catheters in the periphery itself is impossible due to the small diameter of peripheral blood vessels, the pressure wave passing from artery to vein via the periphery should be modulated by, and thus contain information on the condition of, these peripheral blood vessels. This paper explores a means of extracting information about the condition of the systemic circulation by comparing associated arterial and venous pressure waveforms without fully modelling the circulatory system, an approach that could offer significant insight for relatively little effort. There are several popular, existing methods for the comparison of input and output waveforms, such as arterial and venous pressures. Among the most common are transfer functions, frequently generated using fast Fourier transforms (Welch, 1967) or empirical mode decomposition (Huang et al., 1998). While both approaches have proven effective at information extraction, neither is able to effectively incorporate the extensive a-priori knowledge available about the circulatory system, or directly account for the effects on either waveform by active circulatory components such as the heart. In addition, transfer functions output a full spectra for each heartbeat analysed, which is not necessarily easier to rapidly interpret in a clinical environment than the catheter waveform itself. An
Copyright © 2018 IFAC 140
ideal method output would be more similar to the lumped waveform approximations currently favoured in clinical practice, such as mean arterial pressure (MAP) and mean venous pressure (MVP) (Hall, 2010).
Thus, this paper explores a novel method for providing simple, lumped values that are easy to rapidly interpret, but retain more of the underlying physiological information from the catheter pressure waveform. The method focuses on the relative changes in pulse wave amplitude and steady state values between analogous areas of the femoral artery and vena cava pressure waveforms. Comparison between method outputs and established clinical metrics is performed across an experimental data set including the progression of sepsis, a diverse, important and difficult to diagnose condition (Poeze et al., 2004; Dellinger et al., 2013).
2. METHODS
There are significant differences between the Femoral Pressure (Pfe) and Central Venous Pressure (Pvc) waveforms,
both in terms of magnitude and shape. As previously discussed, the capillary beds of the peripheral systemic circulation lie between the femoral artery and vena cava, and the small vessel diameter results in a significant decrease in blood flow and pressure (Hall, 2010). Thus, the pressure pulse in Pfe is converted into flow in the capillaries, and then back
into a reduced magnitude pulse in Pvc. This reduced magnitude
pressure pulse in Pvc is also heavily influenced by downstream
right heart behaviour, an influence which must be mitigated when interpreting Pvc as a result of upstream Pfe. This task can
be accomplished by specifically using the region between the ‘V’ peak and ‘Y’ trough of Pvc, as shown in Fig. 1, for a linear
least squares comparison with the analogous region of Pfe. The
‘A’ and ‘C’ peaks, also shown in Fig. 1, are the result of downstream right heart behaviour (Hall, 2010), and thus ignored.
While the pressure pulse is not transferred directly through the periphery from Pfe to Pvc, mean pressure is in an attenuated
form. However, due to the reduced blood flow in the periphery, the ith beat of P
fe (Pfe,i) and ith beat of Pvc (Pvc,i) do not
correspond to one another. Thus, Pfe,i must instead be
compared to a Pvc,i+j, where j represents the number of
heartbeats’ time the pressure wave takes to pass through the systemic circulation. The value of j can be determined on a subject specific basis by solving the optimisation problem:
𝑗𝑗 = argmin𝑗𝑗‖[max(𝑃𝑃𝑣𝑣𝑣𝑣,𝑖𝑖+𝑗𝑗̇ )]− [max(𝑃𝑃̇𝑓𝑓𝑓𝑓,𝑖𝑖)]‖2 (1) This optimisation problem seeks to find j, such that directional peak-to-peak variation in Pfe and Pvc is in best agreement. The
logic behind Eq. 1 being, if one is interpreting Pvc as an output
from Pfe, then it stands to reason that relative, inter-beat
fluctuations due to other, lower frequency influences, such as breathing, should be preserved between the two waveforms. While j is unconstrained when solving in Eq. 1, it is consistently found to be j = 3 or 4 across the experimental data set assessed, supporting the physiological validity of this approach. This value for j should remain constant for a given,
continuously monitored subject, as each pressure pulse passed into the periphery must, in turn, exit it.
Fig. 1. Linear least squares alignment of scaled Pfe and Pvc.
Regions used for the linear least squares fit are bolded. The Pvc
peaks ‘A’, ‘C’ and ‘V’, and troughs ‘X’ and ‘Y’ are labelled for a single beat.
2.1 The Novel Method: Comparing Pfe with Pvc
For every fourth heartbeat, i, the comparison between Pfe and Pvc is performed via:
1. Take the set of four heartbeats of femoral pressure Pfe,i to Pfe,i+3, and the associated set of four heartbeats of vena
cava pressure Pvc,i+j to Pvc,i+j+3. j represents the subject
specific number of heartbeats’ time a pressure wave takes to pass through the systemic circulation, as determined in Eq. 1.
2. Determine the phase lag, additional to the number of heartbeats’ phase lag expressed by j, by comparing the peak and trough timing of Pfe and Pvc:
𝛿𝛿𝑓𝑓𝑓𝑓→𝑣𝑣𝑣𝑣 = mean ([ 𝑡𝑡max(𝑃𝑃𝑣𝑣𝑣𝑣,𝑖𝑖+𝑗𝑗) − 𝑡𝑡max(𝑃𝑃𝑓𝑓𝑓𝑓,𝑖𝑖) ⋮ ⋮ 𝑡𝑡max(𝑃𝑃𝑣𝑣𝑣𝑣,𝑖𝑖+𝑗𝑗+3) − 𝑡𝑡max(𝑃𝑃𝑓𝑓𝑓𝑓,𝑖𝑖+3) 𝑡𝑡min(𝑃𝑃𝑣𝑣𝑣𝑣,𝑖𝑖+𝑗𝑗) − 𝑡𝑡min(𝑃𝑃𝑓𝑓𝑓𝑓,𝑖𝑖) ⋮ ⋮ 𝑡𝑡min(𝑃𝑃𝑣𝑣𝑣𝑣,𝑖𝑖+𝑗𝑗+3) − 𝑡𝑡min(𝑃𝑃𝑓𝑓𝑓𝑓,𝑖𝑖+3)]) (2)
where tmax(Pvc) is the timing of the Pvc ‘V’ peak, and tmin(Pvc)
the timing of the Pvc ‘Y’ trough. δfe→vc represents the
amount of time, additional to j heartbeats, by which Pvc
lags Pfe.
3. Align the peaks and troughs of Pfe and Pvc by shifting Pfe
to the right by j heartbeats, in addition to δfe→vc. This
modified Pfe is referred to henceforth as 𝑃𝑃̂𝑓𝑓𝑓𝑓.
4. Perform linear least squares on the analogous regions of of 𝑃𝑃̂𝑓𝑓𝑓𝑓 and Pvc, highlighted in Fig. 1, to find:
142 Shaun M. Davidson et al. / IFAC PapersOnLine 51-27 (2018) 140–145 [ (𝑃𝑃̂𝑓𝑓𝑓𝑓(𝑡𝑡𝑚𝑚𝑚𝑚𝑚𝑚(𝑃𝑃𝑣𝑣𝑣𝑣,𝑖𝑖+𝑗𝑗)⋮ ) 𝑃𝑃̂𝑓𝑓𝑓𝑓(𝑡𝑡𝑚𝑚𝑖𝑖𝑚𝑚(𝑃𝑃𝑣𝑣𝑣𝑣,𝑖𝑖+𝑗𝑗)) ) 1⋮ 1 ⋮ ⋮ (𝑃𝑃̂𝑓𝑓𝑓𝑓(𝑡𝑡𝑚𝑚𝑚𝑚𝑚𝑚(𝑃𝑃⋮𝑣𝑣𝑣𝑣,𝑖𝑖+𝑗𝑗+3)) 𝑃𝑃̂𝑓𝑓𝑓𝑓(𝑡𝑡𝑚𝑚𝑖𝑖𝑚𝑚(𝑃𝑃𝑣𝑣𝑣𝑣,𝑖𝑖+𝑗𝑗+3)) ) 1⋮ 1] × [𝐴𝐴𝛥𝛥𝑓𝑓𝑓𝑓→𝑣𝑣𝑣𝑣 𝑓𝑓𝑓𝑓→𝑣𝑣𝑣𝑣] = [ (𝑃𝑃𝑣𝑣𝑣𝑣(𝑡𝑡𝑚𝑚𝑚𝑚𝑚𝑚(𝑃𝑃𝑣𝑣𝑣𝑣,𝑖𝑖+𝑗𝑗)⋮ ) 𝑃𝑃𝑣𝑣𝑣𝑣(𝑡𝑡𝑚𝑚𝑖𝑖𝑚𝑚(𝑃𝑃𝑣𝑣𝑣𝑣,𝑖𝑖+𝑗𝑗)) ) ⋮ (𝑃𝑃𝑣𝑣𝑣𝑣(𝑡𝑡𝑚𝑚𝑚𝑚𝑚𝑚(𝑃𝑃⋮𝑣𝑣𝑣𝑣,𝑖𝑖+𝑗𝑗+3)) 𝑃𝑃𝑣𝑣𝑣𝑣(𝑡𝑡𝑚𝑚𝑖𝑖𝑚𝑚(𝑃𝑃𝑣𝑣𝑣𝑣,𝑖𝑖+𝑗𝑗+3)) ) ] (3)
Afe→vc represents the relative pressure-pulse amplitude of Pfe and Pvc, and Δfe→vc the associated identification offset.
These terms allow Pvc to be constructed as a scaled Pfe
waveform, independent of downstream right heart influences, as shown in Fig. 1.
5. As Afe→vc scales the entire Pfe waveform, thus trading off
with Δfe→vc, Δfe→vc does not provide an independent
estimate of the pressure drop between the two waveforms. Instead, Ofe→vc, the pressure drop between the original Pfe
waveform and the Pvc waveform reconstructed using Pfe,
which is independent of downstream influence from the right heart, is calculated using:
𝑂𝑂𝑓𝑓𝑓𝑓→𝑣𝑣𝑣𝑣= mean ([ 𝑃𝑃̂𝑓𝑓𝑓𝑓(𝑡𝑡start(𝑃𝑃̂𝑓𝑓𝑓𝑓,𝑖𝑖)) 1 ⋮ ⋮ 𝑃𝑃̂𝑓𝑓𝑓𝑓(𝑡𝑡end(𝑃𝑃̂𝑓𝑓𝑓𝑓,𝑖𝑖+3)) 1 ] × [𝐴𝐴𝛥𝛥𝑓𝑓𝑓𝑓→𝑣𝑣𝑣𝑣 𝑓𝑓𝑓𝑓→𝑣𝑣𝑣𝑣] − [ 𝑃𝑃̂𝑓𝑓𝑓𝑓(𝑡𝑡start(𝑃𝑃̂𝑓𝑓𝑓𝑓,𝑖𝑖)) ⋮ 𝑃𝑃̂𝑓𝑓𝑓𝑓(𝑡𝑡end(𝑃𝑃̂𝑓𝑓𝑓𝑓,𝑖𝑖+3)) ]) (4)
The simplified, waveform derived parameters of interest are the relative amplitude, Afe→vc, and direct pressure offset, Ofe→vc. 2.2 Experimental Data
The experimental protocol presented here was approved by the Institutional Animal Care and Use Ethics Committee of the University of Liège, Belgium (Reference Number 14-1726). A cohort of five male, Piétrain pigs were sedated, anesthetised and mechanically ventilated (GE Engstrom CareStation). Measurement of aortic (Pao), femoral (Pfe) and central venous
(Pvc) pressures was performed via pressure catheter
(Transonic, NY, USA) at a sampling rate of 250 Hz. The experimental protocol included:
Endotoxin infusion model of sepsis (lipopolysaccharide from E. Coli, 0.5 mg/kg, infused over 30 mins). Sepsis leads to an inflammatory response and capillary leakage, in turn resulting in hypovolemia, tissue hypoxia, and cardiac failure (Nguyen et al., 2006). As such, sepsis would be expected to cause significant changes in the systemic circulation, and thus the Pfe and Pvc waveforms.
A number of lung recruitment manoeuvres, performed both before and after the endotoxin infusion. Recruitment manoeuvres drive changes in preload, and are often associated with decreased mean blood pressure and cardiac output (Jardin et al., 1981).
Several fluid infusions (500 mL saline over 30 minutes), performed both before and after the endotoxin infusion. These fluid infusions served as simulations of fluid resuscitation therapy, a key hemodynamic resuscitation technique, associated with an increase in circulatory volume (Boyd et al., 2011; Vincent and Gerlach, 2004; Schierhout and Roberts, 1998; Stewart et al., 2009; Kastrup et al., 2007).
Once sepsis driven circulatory failure was sufficiently advanced, data was discarded due to the significant degradation of arterial and venous pressure waveforms. Due to varied responses to the endotoxin infusion, this cut off point varied, and not all pigs completed the entire clinical protocol. Every data set contains at least 5,000 heartbeats.
2.3 Analyses
The clinical metric most closely analogous to the metrics derived from the method presented in this paper is ΔMP = MAP – MVP, in this paper calculated using mean Pao for MAP
and mean Pvc for MVP. ΔMP is a surrogate for systemic
resistance (Hall, 2010), similar to the derived Ofe→vc presented.
The diagnostic sensitivity and specificity of the clinical and novel metrics was assessed using Receiver Operator Characteristic (ROC) curves (Wright, 2005). The following process, illustrated in Fig. 2, was used to generate these ROC curves:
1. Generate a baseline median value for each metric using the first 30 minutes of data recorded.
2. Divide the remaining data into 10 minute samples with rolling, 1 minute start points. Take the median value of each metric for each sample. Omit the 10 minutes of data directly following endotoxin infusion, as this data cannot easily be classified as ‘healthy’ or ‘sepsis’.
3. Classify all samples prior to the beginning of endotoxin infusion as ‘healthy’, and all samples after 10 minutes post endotoxin infusion as ‘sepsis’.
4. Generate the ROC curve using a range of thresholds relative to the subject and metric specific baseline median value.
Fig. 2. The various sample regions used to develop the ROC curves. ‘Baseline’ represents the 30 minute baseline, S1, S2,… 10 minute ‘healthy’ samples, and S56, S57,… 10 minute ‘sepsis’ samples. ‘Endo’ represents an endotoxin infusion, ‘RM’ a recruitment manoeuvre, and ‘Fill’ a fluid infusion. IFAC BMS 2018
São Paulo, Brazil, September 3-5, 2018
[ (𝑃𝑃̂𝑓𝑓𝑓𝑓(𝑡𝑡𝑚𝑚𝑚𝑚𝑚𝑚(𝑃𝑃𝑣𝑣𝑣𝑣,𝑖𝑖+𝑗𝑗)⋮ ) 𝑃𝑃̂𝑓𝑓𝑓𝑓(𝑡𝑡𝑚𝑚𝑖𝑖𝑚𝑚(𝑃𝑃𝑣𝑣𝑣𝑣,𝑖𝑖+𝑗𝑗)) ) 1⋮ 1 ⋮ ⋮ (𝑃𝑃̂𝑓𝑓𝑓𝑓(𝑡𝑡𝑚𝑚𝑚𝑚𝑚𝑚(𝑃𝑃⋮𝑣𝑣𝑣𝑣,𝑖𝑖+𝑗𝑗+3)) 𝑃𝑃̂𝑓𝑓𝑓𝑓(𝑡𝑡𝑚𝑚𝑖𝑖𝑚𝑚(𝑃𝑃𝑣𝑣𝑣𝑣,𝑖𝑖+𝑗𝑗+3)) ) 1⋮ 1] × [𝐴𝐴𝛥𝛥𝑓𝑓𝑓𝑓→𝑣𝑣𝑣𝑣 𝑓𝑓𝑓𝑓→𝑣𝑣𝑣𝑣] = [ (𝑃𝑃𝑣𝑣𝑣𝑣(𝑡𝑡𝑚𝑚𝑚𝑚𝑚𝑚(𝑃𝑃𝑣𝑣𝑣𝑣,𝑖𝑖+𝑗𝑗)⋮ ) 𝑃𝑃𝑣𝑣𝑣𝑣(𝑡𝑡𝑚𝑚𝑖𝑖𝑚𝑚(𝑃𝑃𝑣𝑣𝑣𝑣,𝑖𝑖+𝑗𝑗)) ) ⋮ (𝑃𝑃𝑣𝑣𝑣𝑣(𝑡𝑡𝑚𝑚𝑚𝑚𝑚𝑚(𝑃𝑃⋮𝑣𝑣𝑣𝑣,𝑖𝑖+𝑗𝑗+3)) 𝑃𝑃𝑣𝑣𝑣𝑣(𝑡𝑡𝑚𝑚𝑖𝑖𝑚𝑚(𝑃𝑃𝑣𝑣𝑣𝑣,𝑖𝑖+𝑗𝑗+3)) ) ] (3)
Afe→vc represents the relative pressure-pulse amplitude of Pfe and Pvc, and Δfe→vc the associated identification offset.
These terms allow Pvc to be constructed as a scaled Pfe
waveform, independent of downstream right heart influences, as shown in Fig. 1.
5. As Afe→vc scales the entire Pfe waveform, thus trading off
with Δfe→vc, Δfe→vc does not provide an independent
estimate of the pressure drop between the two waveforms. Instead, Ofe→vc, the pressure drop between the original Pfe
waveform and the Pvc waveform reconstructed using Pfe,
which is independent of downstream influence from the right heart, is calculated using:
𝑂𝑂𝑓𝑓𝑓𝑓→𝑣𝑣𝑣𝑣= mean ([ 𝑃𝑃̂𝑓𝑓𝑓𝑓(𝑡𝑡start(𝑃𝑃̂𝑓𝑓𝑓𝑓,𝑖𝑖)) 1 ⋮ ⋮ 𝑃𝑃̂𝑓𝑓𝑓𝑓(𝑡𝑡end(𝑃𝑃̂𝑓𝑓𝑓𝑓,𝑖𝑖+3)) 1 ] × [𝐴𝐴𝛥𝛥𝑓𝑓𝑓𝑓→𝑣𝑣𝑣𝑣 𝑓𝑓𝑓𝑓→𝑣𝑣𝑣𝑣] − [ 𝑃𝑃̂𝑓𝑓𝑓𝑓(𝑡𝑡start(𝑃𝑃̂𝑓𝑓𝑓𝑓,𝑖𝑖)) ⋮ 𝑃𝑃̂𝑓𝑓𝑓𝑓(𝑡𝑡end(𝑃𝑃̂𝑓𝑓𝑓𝑓,𝑖𝑖+3)) ]) (4)
The simplified, waveform derived parameters of interest are the relative amplitude, Afe→vc, and direct pressure offset, Ofe→vc. 2.2 Experimental Data
The experimental protocol presented here was approved by the Institutional Animal Care and Use Ethics Committee of the University of Liège, Belgium (Reference Number 14-1726). A cohort of five male, Piétrain pigs were sedated, anesthetised and mechanically ventilated (GE Engstrom CareStation). Measurement of aortic (Pao), femoral (Pfe) and central venous
(Pvc) pressures was performed via pressure catheter
(Transonic, NY, USA) at a sampling rate of 250 Hz. The experimental protocol included:
Endotoxin infusion model of sepsis (lipopolysaccharide from E. Coli, 0.5 mg/kg, infused over 30 mins). Sepsis leads to an inflammatory response and capillary leakage, in turn resulting in hypovolemia, tissue hypoxia, and cardiac failure (Nguyen et al., 2006). As such, sepsis would be expected to cause significant changes in the systemic circulation, and thus the Pfe and Pvc waveforms.
A number of lung recruitment manoeuvres, performed both before and after the endotoxin infusion. Recruitment manoeuvres drive changes in preload, and are often associated with decreased mean blood pressure and cardiac output (Jardin et al., 1981).
Several fluid infusions (500 mL saline over 30 minutes), performed both before and after the endotoxin infusion. These fluid infusions served as simulations of fluid resuscitation therapy, a key hemodynamic resuscitation technique, associated with an increase in circulatory volume (Boyd et al., 2011; Vincent and Gerlach, 2004; Schierhout and Roberts, 1998; Stewart et al., 2009; Kastrup et al., 2007).
Once sepsis driven circulatory failure was sufficiently advanced, data was discarded due to the significant degradation of arterial and venous pressure waveforms. Due to varied responses to the endotoxin infusion, this cut off point varied, and not all pigs completed the entire clinical protocol. Every data set contains at least 5,000 heartbeats.
2.3 Analyses
The clinical metric most closely analogous to the metrics derived from the method presented in this paper is ΔMP = MAP – MVP, in this paper calculated using mean Pao for MAP
and mean Pvc for MVP. ΔMP is a surrogate for systemic
resistance (Hall, 2010), similar to the derived Ofe→vc presented.
The diagnostic sensitivity and specificity of the clinical and novel metrics was assessed using Receiver Operator Characteristic (ROC) curves (Wright, 2005). The following process, illustrated in Fig. 2, was used to generate these ROC curves:
1. Generate a baseline median value for each metric using the first 30 minutes of data recorded.
2. Divide the remaining data into 10 minute samples with rolling, 1 minute start points. Take the median value of each metric for each sample. Omit the 10 minutes of data directly following endotoxin infusion, as this data cannot easily be classified as ‘healthy’ or ‘sepsis’.
3. Classify all samples prior to the beginning of endotoxin infusion as ‘healthy’, and all samples after 10 minutes post endotoxin infusion as ‘sepsis’.
4. Generate the ROC curve using a range of thresholds relative to the subject and metric specific baseline median value.
Fig. 2. The various sample regions used to develop the ROC curves. ‘Baseline’ represents the 30 minute baseline, S1, S2,… 10 minute ‘healthy’ samples, and S56, S57,… 10 minute ‘sepsis’ samples. ‘Endo’ represents an endotoxin infusion, ‘RM’ a recruitment manoeuvre, and ‘Fill’ a fluid infusion.
The comparison between the method derived metrics and clinical metrics using these ROC curves involved three major components:
1. Direct evaluation of the ROC curve results, and especially the proximity to the ideal sensitivity and specificity of 1.0 achievable across the full range of diagnostic thresholds trialled for each metric.
2. Evaluation of aggregate ROC performance for each metric, the traditional approach to which involves the summation of areas under the curve, providing an indication of potential metric performance across all diagnostic thresholds. However, in this study the focus is on evaluating the potential diagnostic capability of each metric when the same a-priori threshold is employed across all subjects, as this is likely how the method would be clinically implemented. This is achieved by evaluating the proximity for a given metric to a sensitivity and specificity of 1.0 across all diagnostic thresholds, k, which, for a given pig, i, can be expressed:
𝜀𝜀𝑖𝑖(𝑘𝑘) = ‖[(1 − 𝑠𝑠𝑠𝑠𝑠𝑠𝑠𝑠𝑠𝑠𝑠𝑠𝑠𝑠𝑠𝑠𝑠𝑠𝑠𝑠𝑠𝑠(𝑘𝑘))(1 − 𝑠𝑠𝑠𝑠𝑠𝑠𝑠𝑠𝑠𝑠𝑠𝑠𝑠𝑠𝑠𝑠𝑠𝑠𝑠𝑠𝑠𝑠(𝑘𝑘))]‖ 2
(5) Taking the mean of εi across all pigs, i, provides a measure
of the overall proximity to a sensitivity and specificity of 1.0 achievable for a given metric using an a-priori threshold, as would be the case clinically.
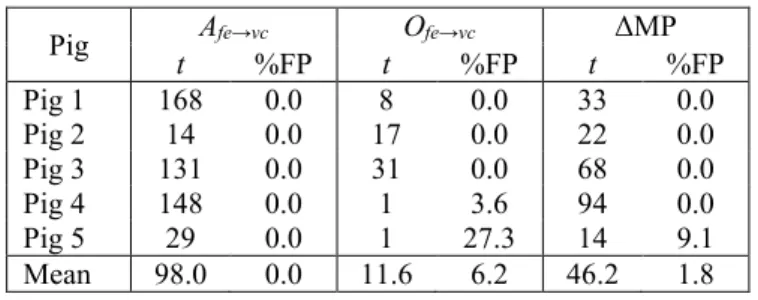
3. An evaluation of the rapidity with which each metric could detect sepsis after endotoxin infusion occurred, when using the optimum a-priori threshold determined in the previous evaluation. As sepsis is a fast acting condition, rapid diagnosis can have a significant effect on patient outcomes (Dellinger et al., 2013). Hence, a shorter time to detection, all else equal, is desirable.
3. RESULTS
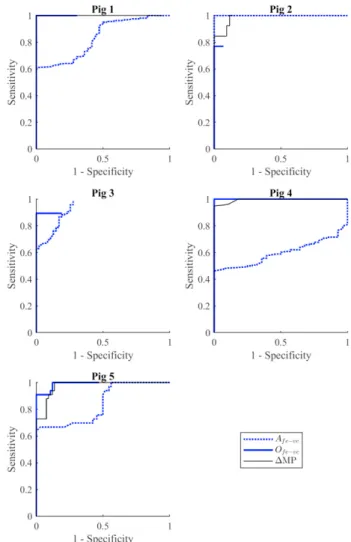
The ROC plots comparing the clinical and novel metrics for each pig are presented in Fig. 3. Metric performance appears to vary notably between pigs, and each metric achieves a sensitivity and specificity of 1.0 for at least one pig. Some ROC curves appear to end prematurely due to the use of the baseline median reading, as opposed to a reading of zero, as a diagnostic comparator. In general, both Ofe→vc and ΔMP
demonstrate strong, consistent performance, with Afe→vc
performing relatively poorly. However, a quantitative comparison of the overall performance of these metrics is difficult to establish from the ROC plots themselves.
Fig. 4 provides such a quantitative comparison. This figure shows the proximity to a sensitivity and specificity of 1.0 achievable when the same a-priori threshold, across a range of 1% - 400% of the subject-specific baseline median reading for a given metric, is used across all pigs. Fig. 4 clearly demonstrates the strong performance of Ofe→vc and ΔMP, and
relatively poor, inconsistent performance of Afe→vc.
Fig. 3. ROC curves across all 5 pigs for the clinical metric ΔMP, and novel metrics Afe→vc and Ofe→vc.
Fig. 4. Proximity to a sensitivity and specificity of 1.0 (lower is better) when an a-priori threshold, relative to the baseline median sample, is used across all pigs.
Finally, Table 1 shows the rapidity with which each metric was able to detect sepsis after the endotoxin infusion using the optimal a-priori threshold from Fig. 4, along with the