RESEARCH ARTICLE
Available online at www.sciencedirect.com
ScienceDirect
Spatiotemporal variation of drought characteristics in the
Huang-Huai-Hai Plain, China under the climate change scenario
LI Xiang-xiang
1, 2, JU Hui
1, Sarah Garré
3, YAN Chang-rong
1, William D. Batchelor
4, LIU Qin
1, 31 Key Laboratory of Dryland Agriculture, Ministry of Agriculture/Institute of Environment and Sustainable Development in Agriculture, Chinese Academy of Agricultural Sciences, Beijing 100081, P.R.China
2 Agro-meteorological Center of Jiangxi Province, Nanchang 330096, P.R.China
3 Department of Biosystems Engineering, University of Liege, Gembloux Agro-BioTech, Gembloux 5030, Belgium 4 Biosystems Engineering Department, Auburn University, AL 36849, USA
Abstract
Understanding the potential drought characteristics under climate change is essential to reduce vulnerability and establish adaptation strategies, especially in the Huang-Huai-Hai Plain (3H Plain), which is the grain production base in China. In this paper, we investigated the variations in drought characteristics (drought event frequency, duration, severity, and intensity) for the past 50 years (1961–2010) and under future scenarios (2010–2099), based on the observed meteorological data and the RCP 8.5 scenario, respectively. First, we compared the applicability of three climatic drought indices: the standardized precipitation index (SPI), the standardized precipitation evapotranspiration index based on the Penman-Monteith equation (SPEI-PM) and the Thornthwaite equation (SPEI-TH) to trace the recorded agricultural drought areas. Then, we analyzed the drought characteristics using “run theory” for both historical observations and future RCP 8.5 scenario based on proper index. Correlation analyses between drought indices and agricultural drought areas showed that SPEI-PM performed better than SPI and SPEI-TH in the 3H Plain. Based on the results of SPEI-PM, the past 50 years have experienced reduced drought of shorter duration, and of weaker severity and intensity. However, under the future RCP 8.5 scenario, drought is expected to rise in frequency, duration, severity, and intensity from 2010–2099, although drought components during the 2010–2039 are predicted to be milder compared with the historical conditions. This study highlights that the estimations for atmospheric evaporative demand would bring in differences in the prediction of long-term drought trends by different drought indices. The results of this study can help inform researchers and local policy makers to establish drought management strategies.
Keyword: climate change, drought index, drought characteristics, Huang-Huai-Hai Plain
1. Introduction
Drought is one of the most damaging and widespread cli-mate extremes that negatively affect the agricultural produc-tion, water resources, ecosystem funcproduc-tion, and human lives around the world (Wilhite et al. 2007; Dai 2011b). Due to the interaction of monsoon climate with the complex topography in East Asia, China has suffered from long-lasting and severe Received 5 september, 2016 Accepted 28 November, 2016
LI Xiang-xiang, E-mail: lixiangxiang0901@163.com; Correspondence LIU Qin, Tel/Fax: +86-10-82109773, E-mail: liuqin02@caas.cn © 2017, CAAS. All rights reserved. Published by Elsevier Ltd. doi: 10.1016/S2095-3119(16)61545-9
droughts during the second half of twentieth century, which has caused significant socio-economic and eco-environment damages to the country (Yong et al. 2013; Yang et al. 2015; Zhang H L et al. 2015). With the increasing temperature and changing distribution of precipitation, the drought risk is expected to increase further (Sillmann et al. 2013; Wang and Chen 2014) and subsequently make crop production more uncertain. Thus, understanding the potential drought characteristics under climate change is of prime importance for reducing vulnerability and establishing drought adapta-tion strategies (Chen et al. 2014; Wilhite et al. 2014).
Several techniques have been developed to quantitatively analyze drought characteristics (Heim 2002). Some of these are the physically based indices, such as Palmer drought severity index (PDSI) and its derivative, and statistically based indices, such as standardized precipitation index (SPI) and the standardized precipitation evapotranspiration index (SPEI) (Vicente-Serrano et al. 2011). These indices have been widely used in detecting long-term drought trends under climate change at several locations around the world. The general recognition is that drought has been intensifying around the world due to global warming in the past decades (Allen et al. 2010; Dai 2013). However, it has been difficult to understand how droughts have changed in China, because the findings based on various potential evapotranspiration (PET) equations varied among studies (Sheffield et al. 2012; Trenberth et al. 2014; Xu et al. 2015). For example, significant drying trends were found in northern and southwestern China during the past decades, when PET was estimated by temperature only (Yu M et al. 2014; Wang H et al. 2015). However, when it was calculated by the Penman-Monteith (PM) equation, whose algorithm takes more climatic variables into account, no evidence of an increase in drought severity was found across China (Wang W et al. 2015), and even more wetting areas than drying areas were observed in the North China Plain and Northeast China Plain (Xu et al. 2015). Subsequently, such differences have led to confusion among scientists, policy makers, and the public (Vicente-Serrano et al. 2012). Thus, the applicability of an index should be verified prior to using it in drought analysis to obtain results that are more realistic. Substantial divergence of applicability exists between phys-ically and statistphys-ically based drought indices, and difference exists even when using the same index with different PET estimation methods, depending on the system and location. Dai (2011a) reported that PDSI performed better than other indices because of its physically based water balance model, but Vicente-Serrano et al. (2011) described the advantages of statistically based indices, including SPI and SPEI, and provided a worldwide rating of the performance of PDSI, SPI, and SPEI on hydrological, agricultural, and ecological
systems (Vicente-Serrano et al. 2012). Similar comparative studies have been conducted at different locations for dif-ferent systems, such as river discharges (Zhai et al. 2010), tree-ring growth (Sun and Liu 2013), and crop production (Xu et al. 2013), resulting in site or system specific results.
The Huang-Huai-Hai Plain (3H Plain) is a major crop producing area in China that encompasses 19% of the total arable land in China. However, it has experienced serious droughts and water scarcity problems in recent years (Yong et al. 2013), which has been the limiting factor for agricultural production (Zhang H L et al. 2015). Furthermore, water limitation is likely to be accentuated by increased food demand, soil quality deterioration and over-exploitation of groundwater resources (Yang et al. 2015). Climate vari-ability, especially extreme climate events, such as drought, may cause fluctuation of crop yields (Lu and Fan 2013; Yu Q et al. 2014). Thus, understanding the potential variations of drought characteristics under climate change is essential for reducing vulnerability and establishing drought adaptation strategies for agriculture in 3H Plain. Most previous studies have primarily reported the seasonal and spatial variability of water deficiency (Yong et al. 2013; Huang et al. 2014) and the long term drought evolutions, including dry/wet trends, spatial distribution of drought frequency, drought affected areas, and drought duration for historical periods (Yu M et al. 2014; Wang H et al. 2015; Wang W et al. 2015; Xu et al. 2015). However, few studies have evaluated the performance of multi-indices on estimating drought impact and assessed drought risk for future climate scenarios.
The objectives of this research are: (1) to evaluate the applicability of drought indices (SPI and two versions of SPEI) in describing historical agricultural drought areas in the 3H Plain; (2) to investigate the variations of drought characteristics, including duration, severity, and intensi-tyfor 1961–2010 and (3) to evaluate of projected drought characteristics for 2010–2099 using the RCP 8.5 scenario. The results are expected to provide useful information on drought risk to decision makers and a wide range of stake-holders interested in the occurrence and consequences of recurrent droughts.
2. Materials and methods
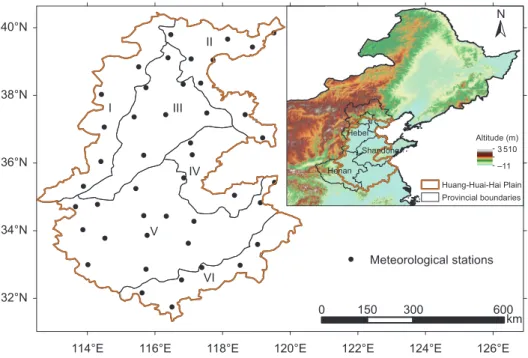
2.1. Study regionThe 3H Plain is located in northern China, extending over 31°14´–40°25´N and 112°33´–120°17´E, with 23.3 million ha of arable land (19% of the total arable land in China), providing about 70% of national wheat production and 30% of national maize production with a dominant winter wheat-summer maize double cropping system (Yang et al.
2015). The 3H Plain belongs to the extra tropical monsoon climatic region. The annual mean precipitation is 500–800 mm with more than 70% falling in July to September and the atmospheric evaporative demand is about 1 000 mm yr–1 (Zhang et al. 2011). For the wheat-maize rotation system, rainfall can only meet 65% of total agricultural water demand, and for winter wheat, only 25–40% of water demand is satisfied by rainfall (Mei et al. 2013). The irrigation water is primarily pumped from groundwater. However, the ground-water level has decreased from a depth of 10 m in the 1970s to 32 m in 2001, and has continued to decrease at the rate of 1 m per year (Zhang et al. 2005). Thus, drought in this region not only challenges food supplies, but also results in a series of environmental problems. The 3H Plain can be divided into six sub-regions (see Li et al. 2015 for detail information) in terms of climate conditions and agricultural management practices (Fig. 1).
2.2. Data description
Climate data Historical meteorological data (the maximum & minimum temperature, wind speed, relative humidity, and daily sunshine duration) covering the period of 1961–2010 for 45 weather stations (Fig. 1) were obtained from the China Meteorological Administration (CMA). Future climate data were simulated using the RCP8.5 scenario of the Had-GEM2-ES climate model, which assumes that the green-house gas emission continues to increase at the present
rate. This dataset has been used for assessing potential effects of drought on winter wheat yield (Leng et al. 2015) and its vulnerability and adaptive capacity in the 3H Plain (Li et al. 2015).
Drought area data Several previous studies have used crop yield data to verify the regional performance of drought indices (Vicente-Serrano et al. 2012; Ming et al. 2015; Po-topova et al. 2015; Zhang J et al. 2015). However, in order to evaluate yield variability due to climate fluctuations alone, yield data should be detrended to remove the effect of agri-cultural technology improvements, such as better fertilizer application, new crop varieties, and better tillage practices (Yu Q et al. 2014; Potopova et al. 2015). Similarly, it is difficult to determine how much yield is affected by drought. Thus, in this study, we used drought area data to verify the performance of SPI, SPEI-TH, and SPEI-PM.
The drought area data, including the drought-induced areas (DIA), drought-affected areas (DAA), and lost harvest areas (LHA) were obtained from the disaster database of Department of Plantation, Ministry of Agriculture, China. The DIA, DAA, and LHA represent the arable areas with yield losses caused by drought at 10, 30, and 70%, respectively. Thus, they actually reflect the cumulative effect of drought on harvest yield for the whole growing season of winter wheat and summer maize (the agricultural pattern is winter wheat and summer maize rotation system in the 3H Plain), and not the conventional ‘drought area’ that measures the cover range of a certain drought event. The disaster
data-● ● ● ● ● ● ● ● ● ● ● ● ● ● ● ● ● ● ● ● ●● ● ● ● ● ● ● ● ● ● ● ● ● ● ● ● ● ● ● ● ● ● ● ● V III I II VI IV 126°E 124°E 122°E 120°E 118°E 116°E 114°E 40°N 38°N 36°N 34°N 32°N Hebei Henan Shandong ● Meteorological stations km Huang-Huai-Hai Plain Provincial boundaries Altitude (m) 3 510 –11 0 150 300 600 N
Fig. 1 Location of the Huang-Huai-Hai Plain and the meteorological stations used in this study. Ⅰ, piedmont plain-irrigable land
zone; Ⅱ, coastal land-farming-fishing area; Ⅲ, low plain-hydropenia irrigable land and dry land; Ⅳ, hill-irrigable land and dry land; Ⅴ, basin-irrigable land and dry land; Ⅵ, hill-wet hot paddy-paddy field.
base embodies provincial scale disaster data since 1949. However, considering the data’s integrity and usability, data of DIA from 1971–2013, DAA from 1970–2012, LHA from 1982–2013 of Henan, Hebei, and Shandong provinces were considered.
2.3. Calculations of drought indices
The SPI is the number of standard deviations of the standardized normal distribution transformed from the precipitation (P) series (McKee et al. 1993), while the SPEI follows the same procedure but it is the difference of the precipitation (P) and the potential evapotranspiration (PET) series (Vicente-Serrano et al. 2010). To compute the indices, the probability density function of P series or P minus PET series for a desired scale was estimated, which was then transformed to a normal distribution. As a result, the value of SPI or SPEI can be constructed as a split line that separates the standard normal distribution. The main strength of SPI and SPEI is that it can be calculated for any timescale(Heim 2002), which represent the cumulative impact of drought for different time periods (Hayes et al. 2011). The SPI depends only on precipitation data, which makes it popular and easy to implement around the world. The SPEI takes into account the atmospheric evaporation demand (i.e., PET), which makes it suitable for drought analysis under climate change (Vicente-Serrano et al. 2012). In the original version of SPEI, the evapotranspiration was estimated by the Thornthwaite (TH) equation, which only considers temperature. However, the PM method is widely accepted as the most physical and accurate estimation of PET as it includes the effects of temperature, wind speed, relative humidity, and solar radiation (Chen et al. 2005; Sentelhas et al. 2010).
The SPI and two versions of SPEI (TH and SPEI-PM) were calculated utilizing the R package of SPEI, developed by Begueria et al. (2014). Since SPI and SPEI
are both standardized, their values should have the same statistical meaning, and therefore should be comparable. Thus, the same threshold as shown in Table 1 was used to classify the drought conditions.
2.4. Drought identification using ‘run theory’
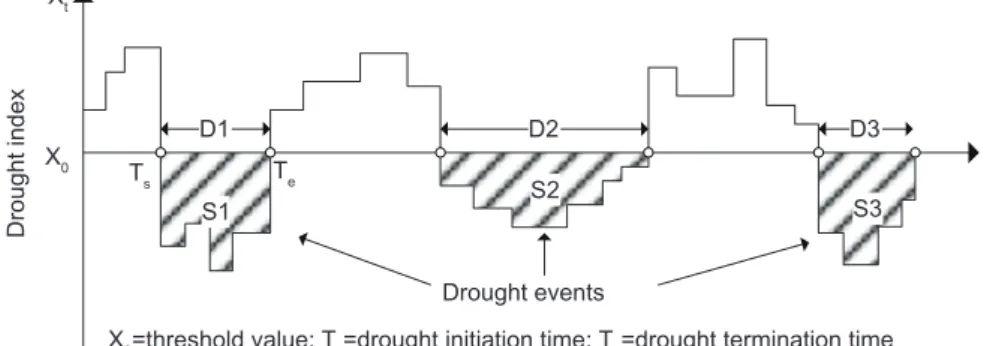
The ‘run theory’ (Fig. 2) proposed by Yevjevich (1967), which has been applied frequently to time series of anomalous hydrologic events, was used to identify drought components and investigate their statistical properties (Mishra and Desai 2005; Nam et al. 2015). A drought event is defined as a consecutive sequence of months (t) with drought indices values (Xt) less than a chosen threshold (X0). A drought event is characterized by the following components, which can be used for mathematical analysis of drought (Fig. 2).
Drought initiation time (Ts) is the onset month of a drought
event. Drought termination time (Te) represents the date
when the water shortage becomes sufficiently small so that the drought no longer persists. Drought duration (D) is the time period between the initiation and termination of a drought. Drought severity (S) is obtained by the cumulative deficiency of the drought parameter below the critical level. Drought intensity (I) is calculated as the ratio of the drought deficit volume and the drought duration.
Table 1 Drought classifications based on standardized
precipitation index (SPI) and standardized precipitation-evapotranspiration index (SPEI)
Drought classes Probability (%) Index value
Extreme wet 2.3 ≥2.0 Very wet 4.4 1.5–2.0 Moderate wet 9.2 1.0–1.5 Near normal 68.2 –1.0–1.0 Moderate dry 9.2 –1.5–(–1.0) Severe dry 4.4 –2.0–(–1.5) Extreme dry 2.3 ≤–2.0 S1 S2 S3 Drought events D1 D2 D3 Xt X0
X0=threshold value; Ts=drought initiation time; Te=drought termination time D=duration; S=severity (Sum of Deficit); I=Intensity=S/D
Ts Te
Drought index
3. Results
3.1. Selection of preferable drought index
As shown in Fig. 3, drought areas have declined since the 1970s. Particularly, the DIA of all the provinces has decreased significantly (P<0.001). However, the DAA of the three provinces shows insignificant decline, but is still at lower level after 2003. The LHA of Henan (Fig. 3-A3) and Shandong (Fig. 3-C3) decreased significantly (P<0.05), while it was not significant for the Hebei Province (Fig. 3-B3).
The Pearson correlation coefficients (r) between monthly drought index series at 1–12 timescales and the agricultural drought areas in Hebei (HB), Henan (HN), and Shandong (SD) provinces, obtained from the Ministry of Agriculture for historical years, are summarized in Fig. 4. It shows that the absolute value of Pearson’s r increased from January to December with the increase in timescale. Thus, a 12-mon SPEI-PM at the end of December in the 3H Plain could capture the overall yearly dry conditions, which reduced the crop yield. Table 2 compares the Pearson’s r between SPI, SPEI-PM, and SPEI-TH in December at 12-mon scale. The SPEI-PM gave higher Pearson’s r values than the SPI and SPEI-TH, compared with the DIA, DAA, and LHA estimated by Ministry, China. For example, the median to high cor-relation between lost harvest areas (LHA) and SPEI-PM in
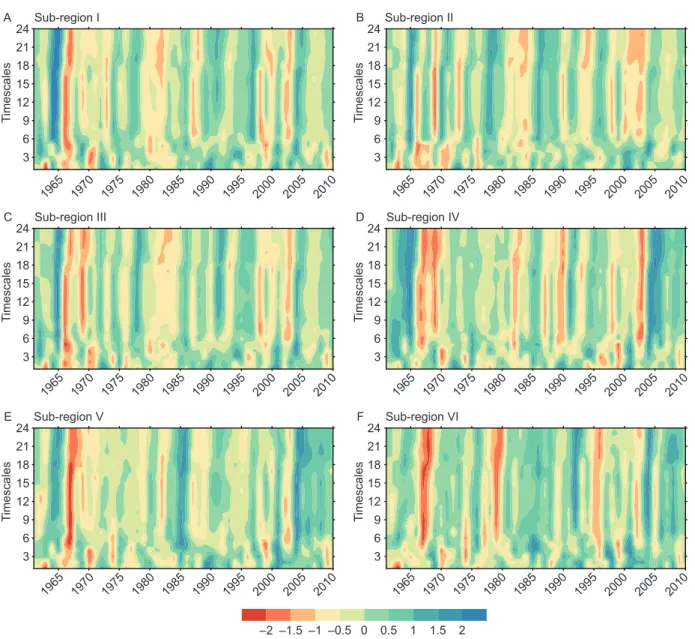
Hebei was –0.74, which was higher than that of SPI (–0.60) and SPEI-TH (–0.58). Thus, SPEI-PM was considered to be a proper index for drought analysis in the 3H Plain. 3.2. Drought characteristics over the past 50 years Historical drought evolution The drought/wet evolutions computed by SPEI-PM at 1–24-mon scales is depicted for the six sub-regions of 3H Plain during 1961–2010 (Fig. 5). The horizontal axis represents mon series from January 1961 to December 2010, while the ordinate is the timescales from 1–24. By utilizing the single diagram, the temporal trends of the severity and duration of the drought indices and the development of the drought/wet stress conditions from 1 to 24 timescales over the past 50 years can be easily identified. Furthermore, the characteristics of drought oc-currences in different regions can be compared. According to Fig. 5, the moderate (≤–1.0) drought appeared broken in 1965–1970, 1980–1985, and 2000–2005 for all sub-regions. However, the severe droughts (≤–1.5) occurred primarily before the 1970s. Furthermore, after the severe to extreme wet period at around 1965, moderate-to-severe dry condi-tions occurred in all regions from 1965 to1970.Particularly, sub-regions V and VI (Fig. 5-E and F) experienced extreme dry conditions during this period.
Temporal variation of historical drought characteristics
0 140 280 420 560 A1 0 80 160 240 320 A2 0 20 40 60 80 1970 1980 1990 2000 2010 1970 1980 1990 2000 2010 1970 1980 1990 2000 2010 1970 1980 1990 2000 2010 1970 1980 1990 2000 2010 1970 1980 1990 2000 2010 1970 1980 1990 2000 2010 1970 1980 1990 2000 2010 1970 1980 1990 2000 2010 A3 0 140 280 420 560 B1 0 140 280 420 560 C1 0 80 160 240 320 B2 0 80 160 240 320 C2 0 20 40 60 80 B3 0 20 40 60 80 C3 Year Dronght area (×10 4 ha )
Fig. 3 The series of drought area of Henan, Hebei and Shandong provinces. A, Henan Province; B, Hebei Province; C, Shandong
Province. 1, drought-induced areas (DIA); 2, drought-affected areas (DAA); 3, lost harvest areas (LHA). The dotted line is the linear trend line.
The changes in the number of total drought events were available for 45 meteorological stations at multiple times-cales under historical periods and they were divided into the 1960s, 1970s, 1980s, 1990s, and 2000s (Table 3). A drought event was counted according to the ‘run theory’ (Fig. 2).
The threshold values are shown in Table 1. Drought events were categorized into two types: above-moderate drought events (herein after AM event) whose threshold was≤–1.0 and above-severe drought events(hereinafter AS event) whose threshold was≤–1.5. The ratio of AS events to AM events was also calculated to indicate changes in drought severity. An AM event includes all kinds of drought while an AS event includes more severe drought. In AM events, no significant trends were detected from the 1960s to 2000s for all timescales (Table 3). AM events happened infrequently in the 1960s and 2000s. However, the AS/AM ratio in the 1960s was found to be the highest with a gradual decrease toward the 2000s for different timescales. In the case of SPEI-PM6, the ratio decreased from 72.8% in the 1960s, to 51.0% in the 1970s, to 37.8% in the 1980s, and then to 35.5% in the 2000s. Thus, total drought events showed no significant tendency over the historical period, but drought events with more severity decreased gradually from the 1960s to 2000s.
Table 2 Comparison of Pearson’s r between PM,
SPEI-TH, and SPI at 12-mon scale1)
Province Classification DIA DAA LHA
Hebei SPEI-PM –0.54 –0.73 –0.74 SPEI-TH –0.26 –0.65 –0.58 SPI –0.44 –0.73 –0.60 Henan SPEI-PM –0.48 –0.64 –0.58 SPEI-TH –0.29 –0.58 –0.45 SPI –0.44 –0.64 –0.56 Shandong SPEI-PM –0.75 –0.81 –0.78 SPEI-TH –0.57 –0.70 –0.71 SPI –0.68 –0.76 –0.74
1) DIA, drought-induced areas; DAA, drought-affected areas; LHA, lost harvest areas.
Jan 0 -0.1 -0.3 -0.3 -0.4 -0.1 0 0 -0.1 -0.1 -0.1 -0.1Jan 0.2 0.2 0 -0.1 -0.3 -0.2 -0.2 -0.1 -0.1 -0.1 0 0Jan 0.2 0.2 0 -0.1 -0.3 -0.2 -0.2 -0.1 -0.1 -0.1 0 0 Feb -0.2 -0.1 -0.2 -0.3 -0.4 -0.4 -0.1 0 0 -0.1 -0.1 -0.1Feb -0.1 0 0.1 -0.1 -0.2 -0.3 -0.3 -0.2 -0.1 -0.1 -0.1 -0.1Feb -0.1 0 0.1 -0.1 -0.2 -0.3 -0.3 -0.2 -0.1 -0.1 -0.1 -0.1 Mar-0.1 -0.1 -0.1 -0.2 -0.3 -0.4 -0.5 -0.2 0 0 -0.1 -0.1Mar -0.1 -0.1 0 0 -0.1 -0.2 -0.4 -0.3 -0.2 -0.1 -0.1 -0.1Mar -0.1 -0.1 0 0 -0.1 -0.2 -0.4 -0.3 -0.2 -0.1 -0.1 -0.1 Apr -0.2 -0.2 -0.2 -0.2 -0.2 -0.3 -0.4 -0.5 -0.2 -0.1 -0.1 -0.1Apr 0 0 -0.1 0 0 0 -0.1 -0.3 -0.3 -0.2 -0.1 -0.1Apr 0 0 -0.1 0 0 0 -0.1 -0.3 -0.3 -0.2 -0.1 -0.1 May-0.4 -0.4 -0.4 -0.4 -0.4 -0.4 -0.5 -0.5 -0.5 -0.4 -0.2 -0.2May-0.3 -0.2 -0.2 -0.2 -0.2 -0.1 -0.2 -0.2 -0.3 -0.4 -0.3 -0.2May-0.3 -0.2 -0.2 -0.2 -0.2 -0.1 -0.2 -0.2 -0.3 -0.4 -0.3 -0.2 Jun -0.4 -0.6 -0.5 -0.5 -0.5 -0.5 -0.5 -0.6 -0.6 -0.6 -0.5 -0.3Jun -0.5 -0.5 -0.4 -0.4 -0.4 -0.4 -0.4 -0.4 -0.4 -0.5 -0.5 -0.4Jun -0.5 -0.5 -0.4 -0.4 -0.4 -0.4 -0.4 -0.4 -0.4 -0.5 -0.5 -0.4 Jul -0.3 -0.4 -0.5 -0.5 -0.5 -0.5 -0.5 -0.6 -0.6 -0.6 -0.6 -0.5Jul -0.7 -0.7 -0.8 -0.7 -0.7 -0.7 -0.7 -0.7 -0.7 -0.7 -0.7 -0.7Jul -0.7 -0.7 -0.8 -0.7 -0.7 -0.7 -0.7 -0.7 -0.7 -0.7 -0.7 -0.7 Aug-0.2 -0.3 -0.4 -0.5 -0.5 -0.5 -0.5 -0.5 -0.5 -0.5 -0.6 -0.6Aug -0.4 -0.7 -0.7 -0.8 -0.8 -0.8 -0.8 -0.7 -0.7 -0.7 -0.8 -0.8Aug -0.4 -0.7 -0.7 -0.8 -0.8 -0.8 -0.8 -0.7 -0.7 -0.7 -0.8 -0.8 Sep -0.3 -0.3 -0.3 -0.4 -0.5 -0.5 -0.5 -0.5 -0.5 -0.6 -0.6 -0.6Sep -0.3 -0.5 -0.7 -0.8 -0.8 -0.8 -0.8 -0.8 -0.8 -0.7 -0.7 -0.8Sep -0.3 -0.5 -0.7 -0.8 -0.8 -0.8 -0.8 -0.8 -0.8 -0.7 -0.7 -0.8 Oct 0 -0.2 -0.2 -0.3 -0.4 -0.5 -0.5 -0.5 -0.5 -0.5 -0.5 -0.5Oct 0.1 -0.2 -0.4 -0.6 -0.7 -0.7 -0.7 -0.7 -0.7 -0.7 -0.7 -0.7Oct 0.1 -0.2 -0.4 -0.6 -0.7 -0.7 -0.7 -0.7 -0.7 -0.7 -0.7 -0.7 Nov 0.2 0.1 -0.2 -0.2 -0.3 -0.4 -0.5 -0.5 -0.5 -0.5 -0.5 -0.5Nov 0.3 0.2 -0.1 -0.3 -0.6 -0.7 -0.7 -0.7 -0.7 -0.7 -0.7 -0.7Nov 0.3 0.2 -0.1 -0.3 -0.6 -0.7 -0.7 -0.7 -0.7 -0.7 -0.7 -0.7 Dec 0 0.1 0.1 -0.2 -0.2 -0.3 -0.4 -0.5 -0.5 -0.5 -0.5 -0.5Dec 0 0.2 0.2 -0.1 -0.4 -0.6 -0.7 -0.7 -0.7 -0.7 -0.7 -0.7Dec 0 0.2 0.2 -0.1 -0.4 -0.6 -0.7 -0.7 -0.7 -0.7 -0.7 -0.7 1 2 3 4 5 6 7 8 9 10 11 12 1 2 3 4 5 6 7 8 9 10 11 12 1 2 3 4 5 6 7 8 9 10 11 12 Jan -0.1 -0.2 -0.3 0 -0.1 -0.1 -0.2 -0.2 -0.1 0 0 0Jan -0.2 -0.2 -0.1 0.1 -0.1 0 -0.1 -0.1 0 0.1 0.1 0.1Jan -0.1 -0.1 0 0.2 0.2 0.1 -0.1 0 0.1 0.1 0.2 0.2 Feb -0.2 -0.2 -0.3 -0.3 0 -0.1 -0.2 -0.2 -0.2 -0.1 -0.1 0Feb -0.2 -0.3 -0.3 -0.1 0 -0.1 -0.1 -0.2 -0.1 0 0 0.1Feb -0.2 -0.2 -0.2 -0.1 0.1 0.1 0.1 -0.1 0 0.1 0.1 0.1 Mar 0.1 0 0 -0.1 -0.2 0 -0.1 -0.2 -0.2 -0.2 -0.1 -0.1Mar 0.1 0 -0.1 -0.1 0 0.1 -0.1 -0.1 -0.2 -0.1 0 0Mar 0.1 -0.1 -0.1 -0.1 0 0.2 0.1 0.1 -0.1 0 0.1 0.1 Apr 0 0.1 0 0 -0.1 -0.1 0 -0.1 -0.2 -0.2 -0.2 -0.1Apr -0.2 -0.1 -0.2 -0.2 -0.2 -0.2 0 -0.2 -0.1 -0.2 -0.1 0Apr -0.2 -0.1 -0.2 -0.2 -0.2 -0.1 0.1 0.1 0 -0.1 -0.1 0.1 May-0.1 -0.1 0 0 -0.1 -0.1 -0.1 0 -0.1 -0.2 -0.3 -0.2May-0.2 -0.3 -0.2 -0.2 -0.2 -0.2 -0.2 -0.1 -0.2 -0.2 -0.3 -0.2May-0.1 -0.1 -0.1 -0.1 -0.1 -0.1 -0.1 0 0 0 -0.1 -0.1 Jun -0.4 -0.3 -0.3 -0.2 -0.2 -0.2 -0.2 -0.3 -0.2 -0.2 -0.3 -0.4Jun -0.2 -0.3 -0.3 -0.3 -0.3 -0.3 -0.3 -0.3 -0.2 -0.3 -0.3 -0.4Jun -0.4 -0.3 -0.3 -0.2 -0.2 -0.3 -0.2 -0.2 -0.1 -0.1 -0.1 -0.2 Jul -0.3 -0.5 -0.5 -0.5 -0.4 -0.4 -0.4 -0.4 -0.4 -0.4 -0.4 -0.5Jul -0.2 -0.4 -0.4 -0.5 -0.4 -0.4 -0.4 -0.4 -0.4 -0.4 -0.4 -0.4Jul -0.4 -0.5 -0.5 -0.5 -0.5 -0.5 -0.5 -0.5 -0.4 -0.4 -0.3 -0.3 Aug-0.4 -0.4 -0.6 -0.6 -0.5 -0.5 -0.5 -0.5 -0.5 -0.5 -0.5 -0.5Aug -0.5 -0.5 -0.5 -0.6 -0.6 -0.6 -0.6 -0.6 -0.6 -0.5 -0.5 -0.6Aug -0.5 -0.5 -0.6 -0.6 -0.6 -0.6 -0.6 -0.6 -0.6 -0.5 -0.5 -0.4 Sep -0.2 -0.4 -0.5 -0.6 -0.6 -0.6 -0.5 -0.5 -0.5 -0.6 -0.6 -0.5Sep -0.4 -0.6 -0.5 -0.6 -0.6 -0.7 -0.6 -0.7 -0.7 -0.7 -0.6 -0.6Sep -0.2 -0.4 -0.5 -0.6 -0.6 -0.6 -0.6 -0.6 -0.6 -0.6 -0.6 -0.5 Oct 0.2 -0.1 -0.3 -0.4 -0.5 -0.5 -0.5 -0.5 -0.5 -0.5 -0.5 -0.5Oct 0.1 -0.2 -0.5 -0.5 -0.6 -0.6 -0.6 -0.6 -0.6 -0.6 -0.6 -0.6Oct 0.2 0 -0.3 -0.4 -0.5 -0.5 -0.5 -0.5 -0.5 -0.5 -0.5 -0.5 Nov 0 0.1 -0.1 -0.3 -0.4 -0.5 -0.5 -0.5 -0.5 -0.5 -0.5 -0.5Nov 0 0 -0.2 -0.5 -0.5 -0.6 -0.6 -0.6 -0.6 -0.6 -0.6 -0.6Nov -0.2 0 -0.1 -0.3 -0.5 -0.5 -0.5 -0.6 -0.5 -0.6 -0.6 -0.6 Dec 0.2 0.1 0.2 0 -0.3 -0.4 -0.5 -0.5 -0.5 -0.5 -0.5 -0.5Dec 0.1 0 0.1 -0.2 -0.4 -0.5 -0.6 -0.6 -0.6 -0.6 -0.6 -0.6Dec 0.2 -0.1 0.1 -0.1 -0.3 -0.4 -0.5 -0.5 -0.5 -0.5 -0.6 -0.6 1 2 3 4 5 6 7 8 9 10 11 12 1 2 3 4 5 6 7 8 9 10 11 12 1 2 3 4 5 6 7 8 9 10 11 12 Jan 0 -0.2 -0.3 0 -0.2 -0.3 -0.2 -0.2 -0.2 -0.2 -0.2 -0.2Jan 0.1 0 -0.2 0 -0.2 -0.4 -0.3 -0.2 -0.3 -0.3 -0.3 -0.3Jan 0 -0.1 -0.2 -0.1 -0.2 -0.4 -0.3 -0.2 -0.3 -0.2 -0.2 -0.2 Feb -0.4 -0.2 -0.3 -0.4 -0.2 -0.2 -0.3 -0.2 -0.2 -0.2 -0.2 -0.2Feb -0.2 0 -0.1 -0.2 -0.1 -0.2 -0.4 -0.4 -0.3 -0.3 -0.3 -0.3Feb -0.3 -0.2 -0.3 -0.3 -0.2 -0.3 -0.5 -0.3 -0.2 -0.3 -0.3 -0.3 Mar-0.1 -0.3 -0.2 -0.4 -0.4 -0.2 -0.3 -0.3 -0.3 -0.2 -0.2 -0.2Mar -0.1 -0.2 -0.1 -0.2 -0.3 -0.1 -0.3 -0.5 -0.4 -0.3 -0.3 -0.3Mar -0.2 -0.4 -0.3 -0.3 -0.4 -0.3 -0.4 -0.5 -0.4 -0.3 -0.3 -0.3 Apr -0.3 -0.3 -0.4 -0.3 -0.4 -0.5 -0.3 -0.4 -0.4 -0.3 -0.2 -0.3Apr -0.4 -0.4 -0.4 -0.3 -0.4 -0.4 -0.3 -0.4 -0.5 -0.4 -0.3 -0.4Apr -0.4 -0.4 -0.5 -0.4 -0.4 -0.5 -0.4 -0.5 -0.6 -0.4 -0.3 -0.4 May-0.3 -0.4 -0.4 -0.5 -0.5 -0.5 -0.6 -0.5 -0.5 -0.5 -0.4 -0.3May-0.2 -0.4 -0.4 -0.4 -0.4 -0.4 -0.4 -0.4 -0.4 -0.6 -0.5 -0.4May 0 -0.2 -0.2 -0.3 -0.3 -0.3 -0.4 -0.3 -0.4 -0.6 -0.4 -0.3 Jun -0.4 -0.6 -0.6 -0.6 -0.6 -0.6 -0.6 -0.7 -0.7 -0.6 -0.6 -0.5Jun -0.3 -0.4 -0.5 -0.5 -0.5 -0.5 -0.5 -0.5 -0.5 -0.5 -0.7 -0.6Jun -0.5 -0.4 -0.5 -0.5 -0.5 -0.5 -0.5 -0.6 -0.6 -0.6 -0.7 -0.5 Jul -0.5 -0.6 -0.7 -0.7 -0.7 -0.7 -0.7 -0.7 -0.7 -0.7 -0.7 -0.6Jul -0.6 -0.6 -0.6 -0.7 -0.7 -0.7 -0.7 -0.7 -0.7 -0.6 -0.6 -0.7Jul -0.7 -0.7 -0.7 -0.7 -0.7 -0.7 -0.7 -0.7 -0.7 -0.7 -0.7 -0.8 Aug-0.4 -0.6 -0.7 -0.8 -0.8 -0.8 -0.8 -0.8 -0.8 -0.8 -0.8 -0.7Aug -0.6 -0.8 -0.8 -0.8 -0.8 -0.8 -0.8 -0.8 -0.8 -0.8 -0.8 -0.8Aug -0.6 -0.8 -0.8 -0.8 -0.8 -0.8 -0.8 -0.8 -0.8 -0.8 -0.8 -0.8 Sep -0.3 -0.5 -0.7 -0.7 -0.8 -0.8 -0.8 -0.8 -0.8 -0.8 -0.8 -0.8Sep -0.3 -0.6 -0.8 -0.8 -0.8 -0.8 -0.8 -0.8 -0.8 -0.8 -0.8 -0.8Sep -0.2 -0.5 -0.8 -0.8 -0.8 -0.8 -0.8 -0.8 -0.8 -0.8 -0.8 -0.8 Oct 0.1 -0.1 -0.4 -0.6 -0.7 -0.7 -0.7 -0.7 -0.7 -0.7 -0.8 -0.8Oct -0.1 -0.3 -0.6 -0.8 -0.8 -0.8 -0.8 -0.8 -0.8 -0.8 -0.8 -0.8Oct 0 -0.2 -0.5 -0.8 -0.8 -0.8 -0.8 -0.8 -0.8 -0.8 -0.8 -0.8 Nov-0.1 0 -0.2 -0.4 -0.6 -0.7 -0.7 -0.7 -0.8 -0.8 -0.7 -0.8Nov -0.1 -0.1 -0.3 -0.6 -0.8 -0.8 -0.8 -0.8 -0.8 -0.8 -0.8 -0.8Nov -0.1 -0.1 -0.2 -0.5 -0.8 -0.8 -0.8 -0.8 -0.8 -0.8 -0.8 -0.8 Dec 0 -0.1 0.1 -0.2 -0.4 -0.6 -0.7 -0.7 -0.7 -0.8 -0.7 -0.7Dec 0 0 -0.1 -0.3 -0.6 -0.8 -0.8 -0.8 -0.8 -0.8 -0.8 -0.8Dec 0.1 0 0 -0.2 -0.5 -0.8 -0.8 -0.8 -0.8 -0.8 -0.8 -0.8 1 2 3 4 5 6 7 8 9 10 11 12 1 2 3 4 5 6 7 8 9 10 11 12 1 2 3 4 5 6 7 8 9 10 11 12
0.3 0.2 0.1 0 -0.1 -0.2 -0.3 -0.4 -0.5 -0.6 -0.7 -0.8
SPEI-PM time-scales
SPEI-PM time-scales SPEI-PM time-scales SPEI-PM time-scales
SPEI-PM time-scales SPEI-PM time-scales SPEI-PM time-scales
SPEI-PM time-scales SPEI-PM time-scales
Hebei
Henan
Shandong
Drought-induced areas Drought-affected areas Lost harve stareas
Fig. 4 Pearson correlation coefficients between the monthly SPEI-PM series and the drought-induced areas, drought-affected
Drought event changes might not represent the chang-es of other drought characteristics due to the association between drought duration, severity, and intensity. The average drought duration or severity was calculated as the average duration or severity for all drought events (SPEI-PM<–1.0). The average drought duration for al-most all timescales decreased with fluctuations from the 1960s to the 2000s (Fig. 6-A). Compared with the 1960s, the average drought duration in the 2000s decreased by 16.7% for the 1-mon timescale, 25.7% for the 3-mon timescale, 37.0% for the 6-mon timescale, 37.2% for the 12-mon timescale, and 33.5% for the 24-mon timescale. Drought severity also decreased from the 1960s to 2000s (Fig. 6-B). Compared with the 1960s, average drought
severity in the 2000s decreased by 38.8% for the 1-mon timescale, 44.5% for the 3-mon timescale, 64.8% for the 6-mon timescale, 66.2% for the 12-mon timescale, and 54.9% for the 24-mon timescale.
The average drought intensity for all drought events for each decade shows decreased drought intensity from the 1960s to 2000s (Table 4). For all timescales, drought intensity in the 1960s was the strongest during the past 50 years, while the weakest occurred during the 1980s. Compared with the 1960s, the drought intensity in the most recent 10 years was reduced by 23.4% for the 1-mon times-cale, 17.8% for the 3-mon timestimes-cale, 37.5% for the 6-mon timescale, 49.1% for the 12-mon timescale, and 32.5% for the 24-mon timescale.
A Sub-region I Sub-region II 3 6 9 12 15 18 21 24 Timescales B 3 6 9 12 15 18 21 24 Timescales C Sub-region III 3 6 9 12 15 18 21 24 Timescales D 3 6 9 12 15 18 21 24 Timescales E Sub-region V Sub-region IV Sub-region VI 3 6 9 12 15 18 21 24 Timescales F 3 6 9 12 15 18 21 24 Timescales –2 –1.5 –1 –0.5 0 0.5 1 1.5 2 1965 1970 1975 1980 1985 1990 1995 2000 2005 2010 1965 1970 1975 1980 1985 1990 1995 2000 2005 2010 1965 1970 1975 1980 1985 1990 1995 2000 2005 2010 1965 1970 1975 1980 1985 1990 1995 2000 2005 2010 1965 1970 1975 1980 1985 1990 1995 2000 2005 2010 1965 1970 1975 1980 1985 1990 1995 2000 2005 2010
Fig. 5 Spatiotemporal evolution of the SPEI-PM series indicating the development of drought from 1 to 24 month scales at 6
sub-regions during1961–2010. Ⅰ, piedmont plain-irrigable land zone; Ⅱ, coastal land-farming-fishing area; Ⅲ, low plain-hydropenia irrigable land and dry land; Ⅳ, hill-irrigable land and dry land; Ⅴ, basin-irrigable land and dry land; Ⅵ, hill-wet hot paddy-paddy field.
3.3. Drought prediction for 2010–2099 under RCP 8.5 scenario
Drought evolution under future climate change The
drought evolution map of multi-scale SPEI-PM is shown in Fig. 7 for six sub-regions during 2010–2099. Visual com-parison of drought maps within each sub-region showed a tendency toward more serious drought conditions through
2100. In the 2025s (2010–2040), particularly in the second half of 2020–2030, all regions were mainly characterized by longer wet events. The severe dry event (SPEI-PM<–1.5) during this period can only be found between 2030–2040 with a short dry event for sub-region I to IV (Fig. 7-A–D).
In the 2055s (i.e., 2040–2070),longer drought event is
pre-dicted to occur frequently, particularly during 2050–2060. In the 2085s (i.e., 2070–2100), drought event is expected to occur persistently with higher frequency and longer dura-tion during 2070–2080 for region IV to VI (Fig. 7-D-F) and the end of 2080–2090 for all regions. The main wet years were projected in the middle of 2070–2080 for sub-regions I to III (Fig. 7-A–C) and the last 10 years for sub-regions I to V (Fig. 7-A–E).
Temporal variation of future drought characteristics
Changes in the drought events were compared between the three 30-yr periods centered on 2025, 2055, and 2085 under the RCP8.5 scenario and the recent (1981–2010) historical period (Table 5). Both the AM and AS events were predicted to be lower in the 2025s than in the historical period (1981–2010), indicating a lower drought frequency in the first 30 years in the future. Taking SPEI-PM3 as an example, the drought event in the 2025s was projected to be 30.3% (AM event) and 55.0% (AS event) lower compared with the historical standard. However, the frequency of
Table 3 Temporal variations in the number of drought events1)
Classification 1960s 1970s 1980s 1990s 2000s 1-mon AM event 610 741 628 717 560 AS event 344 (56.4) 298 (40.2) 159 (25.3) 270 (37.7) 194 (34.6) 3-mon AM event 380 456 425 407 361 AS event 227 (59.7) 202 (44.3) 148 (34.8) 189 (46.4) 168 (46.5) 6-mon AM event 224 296 328 315 262 AS event 163 (72.8) 151 (51.0) 124 (37.8) 165 (52.4) 93 (35.5) 12-mon AM event 122 142 188 187 148 AS event 97 (79.5) 65 (45.8) 71 (37.8) 102 (54.5) 67 (45.3) 24-mon AM event 77 108 151 101 111 AS event 63 (81.8) 48 (44.4) 73 (48.3) 50 (49.5) 59 (53.2)
1) The threshold for identifying an AM and AS event was ≤–1.0 and ≤–1.5, respectively. Numbers in parentheses are the ratio of AS events to AM events in percentage.
0 3 6 9 12 Drought duration A 0 2 4 6 8 Drought severity B 24-mon 12-mon 6-mon 3-mon 1-mon 1960s 1970s 1980s 1990s 2000s 1960s 1970s 1980s 1990s 2000s
Fig. 6 Temporal changes in average drought duration (A) and
severity (B) for all drought events during 1961–2010.
Table 4 Temporal changes in average drought intensity for all
drought events in 1961–2010 Timescales 1960s 1970s 1980s 1990s 2000s 1-mon 0.47 0.43 0.34 0.41 0.36 3-mon 0.45 0.36 0.3 0.35 0.37 6-mon 0.48 0.37 0.28 0.36 0.3 12-mon 0.53 0.29 0.23 0.28 0.27 24-mon 0.4 0.26 0.22 0.27 0.27
drought events was predicted to continuously increase in the 2055s and 2085s for all time scales and surpasses that of the 1981–2010 periods. In the case of the SPEI-PM6, compared with the historical period (1981–2010), the results indicated an increase in moderate dry events in the 2055s and 2085s at therate of 8.4 and 12.2%, respectively. The ratio of AS events to AM events also showed an
increas-ing trend in the RCP8.5 scenario. For example, the ratio increased from 50.1% in 1981–2010 to 72% in the 2085s for the 24-mon timescale, indicating 72% of the drought events in the 2085s are expected to be intense than the severe drought.
Evolution of the duration and severity for all drought events under historical (1981–2010) and future RCP 8.5 A Sub-region I 6 12 18 24 Timescales B Sub-region II 6 12 18 24 Timescales C Sub-region III 6 12 18 24 Timescales D Sub-region IV 6 12 18 24 Timescales E Sub-region V 6 12 18 24 Timescales F Sub-region VI 6 12 18 24 Timescales –2 –1.5 –1 –0.5 0 0.5 1 1.5 2 2010 2020 2030 2040 2050 2060 2070 2080 2090 2010 2020 2030 2040 2050 2060 2070 2080 2090 2010 2020 2030 2040 2050 2060 2070 2080 2090 2010 2020 2030 2040 2050 2060 2070 2080 2090 2010 2020 2030 2040 2050 2060 2070 2080 2090 2010 2020 2030 2040 2050 2060 2070 2080 2090
Fig. 7 Spatiotemporal evolution of the SPEI-PM series indicating the development of drought from 1 to 24 month-scales at 6
sub-regions under theRCP 8.5 scenario.
Table 5 Drought events changes for future weather scenarios using the RCP 8.5 scenario1)
Classification 1981–2010 2025s RCP 8.5 scenario2055s 2085s SPEI-PM1 AM event 1905 1321 2170 2242 AS event 623 (32.7) 360 (27.3) 941 (43.4) 1183 (52.8) SPEI-PM3 AM event 1193 832 1371 1430 AS event 505 (42.3) 227 (27.3) 645 (47.0) 825 (57.7) SPEI-PM6 AM event 905 605 981 1015 AS event 382 (42.2) 136 (22.5) 483 (49.2) 596 (58.7) SPEI-PM12 AM event 523 317 477 530 AS event 240 (45.9) 72 (22.7) 251 (52.6) 338 (63.8) SPEI-PM24 AM event 363 217 340 464 AS event 182 (50.1) 47 (21.7) 198 (58.2) 334 (72.0)
1) AM events represent all dry events while AS events are for severe dry events. Numbers in parentheses are the ratio of AS events to AM events in percentage.
scenario (2010–2099) are shown in Fig. 8. Compared with the historical period, the drought duration and severity are predicted to be shorter and weaker in the 2025s, which is similar to past drought events. However, drought duration and severity shows an increasing trend from 2025s to 2085s for all time scales (Fig. 8). Compared with the 2025s, the highest increasing rate for drought duration and drought severity in the 2085s is 62.2% (12-timescale) and 188.1% (24-timescale), respectively.
As shown in Table 6, drought is projected to become more severe in the 2085s. Compared with the 2025s, the intensity was found to be 43.3% (1-mon), 61.5% (3-mon), 62.5% (6-mon), 86.3% (12-(6-mon), and 100% (24-mon) higher in the 2085s. Similarly, the average drought intensity during the 2025s was projected to be lower than the historical period. Based on these results, drought risk is predicted to intensify in the 2055s and 2085s, and will be severe in the 2055s and 2085s compared with the historical standards.
4. Discussion
4.1. Trend variations between different drought indices
This work has shown that drought characteristics, including duration, intensity and severity have become moderate over the past 50 years in the 3H Plain based on the verified
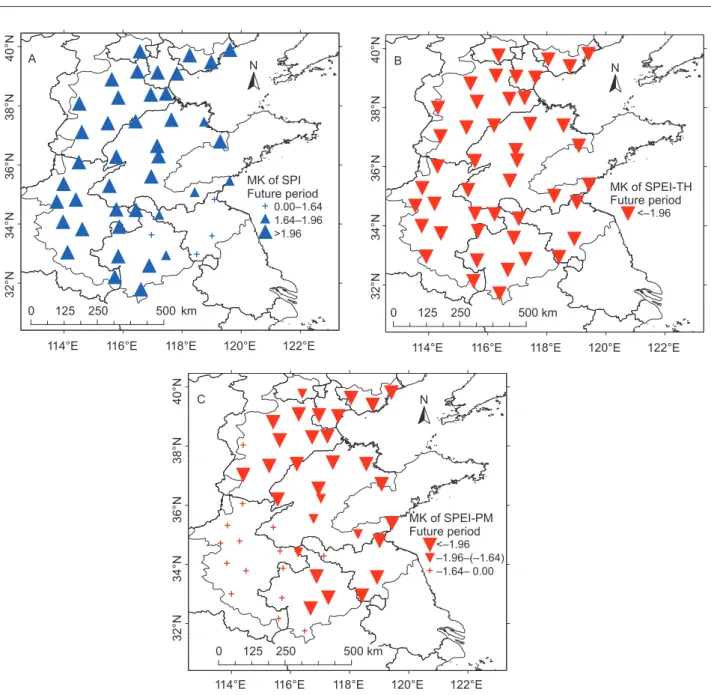
SPEI-PM index. These results are inconsistent with the previous studies, where northern China was shown to have experienced a warm-drying trend (Yu M et al. 2014; Wang H et al. 2015). This inconsistency is likely due to the use of different indices in previous studies and especially due to the variation in estimating potential evapotranspiration (PET) for different indices. For example, PDSI_TH has detected global drying trends in the past decades (Dai 2013; Nam et al. 2015). However, some studies have evaluated the use of PM equation to calculate drought indices and concluded that drought has changed little globally (Sheffield et al. 2012) and in China in the past decades (Wang W et al. 2015). To understand the variations between different drought indices in the 3H Plain, the Mann-Kendall trend test using the signif-icant level of α=0.1 and α=0.05 was performed on annual mean SPI, SPEI-TH, and SPEI-PM of 3-mon scale for the historical period (Fig. 9) and the future RCP8.5 scenario (Fig. 10). Stations marked with red inverted triangles in both Figs. 9 and 10 are significantly drying areas, and stations marked with blue triangles are significantly wetting areas.
In general, the drought trend detected by SPI was driven by precipitation (McKee et al. 1993), while SPEI depends on both precipitation and PET (Vicente-Serrano et al. 2010). For the historical period, precipitation decreased
insignificantly by 1.01 mm yr–1 (Table 7). PET-TH gave an
increase in PET at 1.32 mm yr–1, which further increased
water shortages. However, PET-PM decreased by 2.11 mm yr–1, which made up for decreasing precipitation. Thus, SPI and SPEI-TH showed a drying trend over the 3H Plain (Fig. 9-A and B), while the SPEI-PM showed slightly wetter conditions (Fig. 9-C). While precipitationis expected to increase by 1.88 mm yr–1 in the future period, the amplifi-cation of PET by both TH and PM equations counteracted this positive increase in precipitation (Table 7). Thus, SPI predicted wetter conditions in the future period (Fig. 10-A). However, SPEI-TH and SPEI-PM predicted that almost all meteorological stations would experience significant drying trends (Fig. 10-B and C), except for the southwest regions where SPEI-PM showed an insignificant trend. Thus, for 3H Plain, drought indices with different potential evapotranspiration algorithms would introduce differences 0 3 6 9 12 Obs 2025s 2055s 2085s Obs 2025s 2055s 2085s D rough t du ra tio n A 0 2 4 6 D rought seve rit y B 24-mon 12-mon 6-mon 3-mon 1-mon
Fig. 8 Temporal changes in average drought duration (A) and
severity (B) for all drought events under RCP 8.5 scenario. Obs, the period of 1981–2010.
Table 6 Temporal changes in average drought intensity for
all drought events in the 2025s, 2055s, and 2085s under RCP 8.5 scenario Timescales 1981–2010 2025sRCP 8.5 scenario2055s 2085s 1-mon 0.37 0.32 0.42 0.46 3-mon 0.34 0.26 0.39 0.42 6-mon 0.31 0.24 0.33 0.39 12-mon 0.26 0.22 0.27 0.41 24-mon 0.25 0.17 0.24 0.34
in predicted drought trends. Drought hazard assessment should understand these differences and the index being chosen for drought studies should be explained and verified to justify the selected index.
4.2. Applicability of drought index
In this study, the applicability of SPI, SPEI-TH, and SPEI-PM was verified based on observed data of agricultural drought areas in the 3H Plain. We found that SPEI-PM has higher correlation level with historical drought area data. However, it does not mean that SPEI-PM has the same applicability in other locations or systems. Remarkably, the best drought index for detecting impact changes as a function of the
an-alyzed system and the performance of the drought indices varied spatially (Vicente-Serrano et al. 2012). For example, the SPI is found to be well correlated with runoff anomaly in China (Zhai et al. 2010), while SPEI is better for hydrological application in western Canada (Gurrapu et al. 2014).
For agricultural drought assessment, studies comparing the performance of several drought indices would be pref-erable to determine the best drought index for identifying a certain drought type and its impacts on agricultural systems. Nevertheless, the variable that could better reflect the drought impact for the analyzed system is of considerable importance. In this study, the observed drought area data were used to evaluate the applicability of drought index for agricultural application. Several previous studies
(Vicen-▲ ▲ ▲ 122°E 120°E 118°E 116°E 114°E 40 °N 38 °N 36 °N 34 °N 32 °N 0 125 250 500 km MK of SPI Historical period▲ –1.96–(–1.64) –1.64–0.00 0.00–1.64 A ▲ ▲ ▲
▲
▲▲
▲
▲
▲
▲
▲
▲
▲
▲
▲
▲
▲▲
▲
▲
▲
▲
122°E 120°E 118°E 116°E 114°E 40 °N 38 °N 36 °N 34 °N 32 °N 0 125 250 500 km MK of SPEI-TH Historical period▲
<–1.96 ▲ –1.96–(–1.64) –1.64–0.00 0.00–1.64 B 122°E 120°E 118°E 116°E 114°E 40 °N 38 °N 36 °N 34 °N 32 °N 0 125 250 500 km MK of SPEI-PM Historical period –1.64–0.00 0.00–1.64 1.64–1.96 >1.96 C + + + + + + + + + + + + + + + +▲
▲
▲
▲
▲▲
▲
▲ ▲ + + + + + + + + + + + + + + + + + + + + + + + + + + + + + + ▲▲
+ + + + + + + + + + + + + + + + + + + + + + + + + + + + + + + + + + + + + + + + + + + + + + + + + + + + + + + + + + + + + N N Nte-Serrano et al. 2012; Potopova et al. 2015; Labudová et al. 2016) have used detrended yield (or climatic yield) by applying the first-difference or a linear regression model to eliminate the effects of technology change influence from actual crop yield, in order to assess the applicability of drought index. However, the reality of these studies were based on the hypothesis that yield fluctuations are mostly attributed to water stress, and agricultural technology is changed linearly (Yu et al. 2012).
Additionally, the comparison between SPEI-PM and SPEI-TH indicated that the how potential evapotranspiration is estimated would make differences in drought applicability 122°E 120°E 118°E 116°E 114°E 40 °N 38 °N 36 °N 34 °N 32 °N 0 125 250 500km MK of SPI Future period 0.00–1.64 1.64–1.96 >1.96 A 122°E 120°E 118°E 116°E 114°E 40°N 38°N 36°N 34°N 32°N 0 125 250 500 km MK of SPEI-TH Future period <–1.96 B 122°E 120°E 118°E 116°E 114°E 40°N 38°N 36°N 34°N 32°N 0 125 250 500 km MK of SPEI-PM Future period <–1.96 –1.96–(–1.64) –1.64– 0.00 C + + + + + + + + + + + + + + + +
▲
▲
▲
▲
▲
▲
▲
▲
▲
▲
▲
▲
▲
▲
▲
▲
▲
▲
▲
▲
▲
▲
▲
▲
▲
▲
▲
▲
▲
▲
▲
▲
▲
▲
▲
▲
▲ ▲ ▲ ▲ ▲ + + + + + ▲▲
▲
▲
▲
▲
▲
▲
▲
▲
▲
▲
▲
▲
▲
▲
▲
▲
▲
▲
▲
▲
▲ ▲
▲
▲
▲
▲
▲
▲
▲
▲
▲
▲
▲
▲
▲
▲
▲
▲
▲
▲
▲
▲
▲
▲
▲
▲
▲ ▲ ▲ ▲ ▲▲
▲
▲
▲
▲
▲
▲
▲
▲
▲
▲
▲
▲
▲
▲
▲
▲
▲
▲
▲
▲
▲
▲
▲▲
▲
▲ N N NFig. 10 Trend variations of annual SPI-3 (A), SPEI-TH3 (B), and SPEI-PM3 (C) in the 3H Plain under future climate change
(2010–2099).
Table 7 Annual trend of precipitation and potential
evapotranspiration (PET_PM and PET_TH) and four major climatic variables
Items Historical period (1961–2010) RCP8.5 scenario (2010–2099) Precipitation (mm yr–1) –1.01 1.88* PET_TH (mm yr–1) 1.32** 6.84** PET_PM (mm yr–1) –2.11** 3.58** Daily temperature (°C 10 yr–1) 0.24** 0.77** Relative humidity (% yr–1) –0.05* –0.05* Wind speed (m s–1 yr–1) –0.01** –0.00**
Net solar radiation (MJ m–2 yr–1) –12.12** 5.19** * and ** represent significant level at P<0.05 and P<0.01, respectively.
and long-term drought trend. This difference has been found in other places of China (Wang W et al. 2015; Xu et al. 2015; Zhang J et al. 2015) and around the world (Sheffield et al. 2012; Begueria et al. 2014). The TH and PM are widely used in drought index algorithm. The TH model used for computing PET in drought assessment is popularly used due to its simplicity and less data requirements (only tempera-ture), such as in original SPEI and PDSI indices. Chen et al. (2005) concluded that the TH method overestimates PET in southeast China where PET is low, and underestimates in the northern and northwest parts where PET is high when compared to pan data, and it does not follow the temporal variation well. Instead, PM equation is the most reliable estimation and is recommended by the FAO to calculate crop water requirements (Allen et al. 2005). Thus, looking at the better applicability of SPEI-PM and estimation results, we recommend using PM equation to calculate drought index in 3H Plain.
5. Conclusion
The drought characteristics was investigated using “run theory” for both historical and future climate change under RCP 8.5 scenario in the 3H Plain based on the preferable drought index, i.e., PM, selected among SPI and SPEI-TH. The results can be summarized as follows:
(1) In Huang-Huai-Hai Plain (3H Plain), SPEI based on FAO-56 PM formula, i.e., SPEI-PM, is more suitable for ag-ricultural drought impact analysis as it has higher correlation coefficients with historical drought area data than SPI and traditional SPEI.
(2) Based on calculations using the SPEI-PM, although total drought events showed no significant tendency over the historical period, the decreasing potential evapotranspiration reduced the drought duration, severity, and intensity from the 1960s to the 2000s.
(3) Compared with the historical period, drought char-acteristics, including the frequency, duration, severity, and intensityt end to be lower in the first thirty years in the future RCP 8.5 scenario. However, it is predicted to be intensified in the 2055s and the 2085s, and will become very serious by historic standards after the 2055s.
Acknowledgements
This research was supported by the National Basic Re-search Program of China (973 Program, 2012CB955904), the National Key Technologies R&D Program of China during the 12th Five-Years Plan period (2012BAD09B01), and the National Science Foundation for Young Scientists of China (41401510). We thank the University of Liège-Gem-bloux Agro-Bio Tech and more specifically the research
platform AgricultureIslife for the funding of the scientific stay in Belgium that made this paper possible. We gratefully acknowledge the anonymous reviewers for their valuable comments on the manuscript.
References
Allen C D, Macalady A K, Chenchouni H, Bachelet D, McDowell N, Vennetier M, Kitzberger T, Rigling A, Breshears D D, Hogg E H, Gonzalez P, Fensham R, Zhang Z, Castro J, Demidova N, Lim J H, Allard G, Running S W, Semerci A, Cobb N. 2010. A global overview of drought and heat-induced tree mortality reveals emerging climate change risks for forests. Forest Ecology and Management, 259,
660–684.
Allen R G, Pereira L S, Smith M, Raes D, Wright J L. 2005. FAO-56 dual crop coefficient method for estimating evaporation from soil and application extensions. Journal of Irrigation
and Drainage Engineering (ASCE), 131, 2–13.
Begueria S, Vicente-Serrano S M, Reig F, Latorre B. 2014. Standardized precipitation evapotranspiration index (SPEI) revisited: Parameter fitting, evapotranspiration models, tools, datasets and drought monitoring. International Journal
of Climatology, 34, 3001–3023.
Chen D L, Gao G, Xu C Y, Guo J, Ren G Y. 2005. Comparison of the Thornthwaite method and pan data with the standard Penman-Monteith estimates of reference evapotranspiration in China. Climate Research, 28, 123–132.
Chen H, Wang J, Huang J. 2014. Policy support, social capital, and farmers’ adaptation to drought in China. Global
Environmental Change, 24, 193–202.
Dai A. 2011a. Characteristics and trends in various forms of the Palmer Drought Severity Index during 1900–2008. Journal
of Geophysical Research (Atmospheres), 116, D12115.
Dai A. 2011b. Drought under global warming: A review.
Interdisciplinary Reviews (Climate Change), 2, 45–65.
Dai A. 2013. Increasing drought under global warming in observations and models. Nature Climate Change, 3,
171–171.
Gurrapu S, Chipanshi A, Sauchyn D, Howard A. 2014. Comparison of the SPI and SPEI on predicting drought conditions and streamflow in the Canadian prairies. In: Proceedings of the 28th Conference on Hydrology. American Meteorological Society, Atlanta, USA. p.2-6. Hayes M, Svoboda M, Wall N, Widhalm M. 2011. The lincoln
declaration on drought indices. Bulletin of the American
Meteorological Society, 92, 485–488.
Heim R R. 2002. A review of twentieth-century drought indices used in the United States. Bulletin of the American
Meteorological Society, 83, 1149–1165.
Huang Y, Wang J, Jiang D, Zhou K, Ding X, Fu J. 2014. Surface water deficiency zoning of China based on surface water deficit index (SWDI). Water Resources, 41, 372–378.
Labudová L, Labuda M, Takáč J. 2016. Comparison of SPI and SPEI applicability for drought impact assessment on crop
production in the Danubian Lowland and the East Slovakian Lowland. Theoretical and Applied Climatology, doi: 10.1007/ s00704-016-1870-2
Leng G, Tang Q, Rayburg S. 2015. Climate change impacts on meteorological, agricultural and hydrological droughts in China. Global and Planetary Change, 126, 23–34.
Li Y, Huang H, Ju H, Lin E, Xiong W, Han X, Wang H, Peng Z, Wang Y, Xu J, Cao Y, Hu W. 2015. Assessing vulnerability and adaptive capacity to potential drought for winter-wheat under the RCP 8.5 scenario in the Huang-Huai-Hai Plain.
Agriculture, Ecosystems & Environment, 209, 125–131.
Lu C, Fan L. 2013. Winter wheat yield potentials and yield gaps in the North China Plain. Field Crops Research, 143,
98–105.
McKee T B, Doesken N J, Kleist J. 1993. The relationship of drought frequency and duration to time scales. In: American Meteorological Society, Boston, USA. pp. 179-183. Mei X, Kang S, Yu Q, Huang Y, Zhong X, Gong D, Huo Z,
Liu E. 2013. Pathways to synchronously improving crop productivity and field water use efficiency in the North China Plain. Scientia Agricultura Sinica, 46, 1149–1157.
Ming B, Guo Y Q, Tao H B, Liu G Z, Li S K, Wang P. 2015. SPEIPM-based research on drought impact on maize yield in North China Plain. Journal of Integrative Agriculture, 14,
660–669.
Mishra A K, Desai V R. 2005. Drought forecasting using stochastic models. Stochastic Environmental Research and
Risk Assessment, 19, 326–339.
Nam W H, Hayes M J, Svoboda M D, Tadesse T, Wilhite D A. 2015. Drought hazard assessment in the context of climate change for South Korea. Agricultural Water Management,
160, 106–117.
Potopova V, Stepanek P, Mozny M, Tuerkott L, Soukup J. 2015. Performance of the standardised precipitation evapotranspiration index at various lags for agricultural drought risk assessment in the Czech Republic. Agricultural
and Forest Meteorology, 202, 26–38.
Sentelhas P C, Gillespie T J, Santos E A. 2010. Evaluation of FAO Penman-Monteith and alternative methods for estimating reference evapotranspiration with missing data in Southern Ontario, Canada. Agricultural Water Management,
97, 635–644.
Sheffield J, Wood E F, Roderick M L. 2012. Little change in global drought over the past 60 years. Nature, 491,
435–438.
Sillmann J, Kharin V V, Zwiers F W, Zhang X, Bronaugh D. 2013. Climate extremes indices in the CMIP5 multimodel ensemble: Part 2. Future climate projections. Journal of
Geophysical Research (Atmospheres), 118, 2473–2493.
Sun J, Liu Y. 2013. Responses of tree-ring growth and crop yield to drought indices in the Shanxi province, North China.
International Journal of Biometeorology, 58, 1521–1530.
Trenberth K E, Dai A, van der Schrier G, Jones P D, Barichivich J, Briffa K R, Sheffield J. 2014. Global warming and changes in drought. Nature Climate Change, 4, 17–22.
Vicente-Serrano S M, Begueria S, Lopez-Moreno J I. 2010. A
multiscalar drought index sensitive to global warming: The standardized precipitation evapotranspiration index. Journal
of Climate, 23, 1696–1718.
Vicente-Serrano S M, Begueria S, Lopez-Moreno J I. 2011. Comment on “Characteristics and trends in various forms of the Palmer Drought Severity Index (PDSI) during 1900–2008” by Aiguo Dai. Journal of Geophysical Research (Atmospheres), 116, D19112.
Vicente-Serrano S M, Beguería S, Lorenzo-Lacruz J, Camarero J J, López-Moreno J I, Azorin-Molina C, Revuelto J, Morán-Tejeda E, Sanchez-Lorenzo A. 2012. Performance of drought indices for ecological, agricultural, and hydrological applications. Earth Interactions, 16, 1–27.
Wang H, Chen A, Wang Q, He B. 2015. Drought dynamics and impacts on vegetation in China from 1982 to 2011.
Ecological Engineering, 75, 303–307.
Wang L, Chen W. 2014. A CMIP5 multimodel projection of future temperature, precipitation, and climatological drought in China. International Journal of Climatology, 34, 2059–2078.
Wang W, Zhu Y, Xu R, Liu J. 2015. Drought severity change in China during 1961–2012 indicated by SPI and SPEI.
Natural Hazards, 75, 2437–2451.
Wilhite D A, Sivakumar M V K, Pulwarty R. 2014. Managing drought risk in a changing climate: The role of national drought policy. Weather and Climate Extremes, 3, 4–13.
Wilhite D A, Svoboda M D, Hayes M J. 2007. Understanding the complex impacts of drought: A key to enhancing drought mitigation and preparedness. Water Resources
Management, 21, 763–774.
Xu K, Yang D, Yang H, Li Z, Qin Y, Shen Y. 2015. Spatio-temporal variation of drought in China during 1961–2012: A climatic perspective. Journal of Hydrology, 526, 253–264.
Xu L, Wang H, Duan Q, Ma J. 2013. The temporal and spatial distribution of droughts during summer corn growth in Yunnan Province based on SPEI. Resources Science, 35,
1024–1034.
Yang J, Mei X, Huo Z, Yan C, Ju H, Zhao F, Liu Q. 2015. Water consumption in summer maize and winter wheat cropping system based on SEBAL model in Huang-Huai-Hai Plain, China. Journal of Integrative Agriculture, 14, 2065–2076.
Yevjevich V. 1967. An Objective Approach to Definitions
and Investigations of Continental Hydrologic Droughts. Hydrology Paper 23. Colorado State University, Fort Collins,
CO. p. 18.
Yong B, Ren L, Hong Y, Gourley J J, Chen X, Dong J, Wang W, Shen Y, Hardy J. 2013. Spatial-temporal changes of water resources in a typical semiarid basin of North China over the Past 50 years and assessment of possible natural and socioeconomic causes. Journal of Hydrometeorology,
14, 1009–1034.
Yu M, Li Q, Hayes M J, Svoboda M D, Heim R R. 2014. Are droughts becoming more frequent or severe in China based on the Standardized Precipitation Evapotranspiration Index: 1951–2010? International Journal of Climatology,
34, 545–558.
Nielsen D C. 2014. Year patterns of climate impact on wheat yields. International Journal of Climatology, 34, 518–528.
Yu Y, Huang Y, Zhang W. 2012. Changes in rice yields in China since 1980 associated with cultivar improvement, climate and crop management. Field Crops Research, 136, 65–75.
Zhai J, Su B, Krysanova V, Vetter T, Gao C, Jiang T. 2010. Spatial variation and trends in PDSI and SPI indices and their relation to streamflow in 10 large regions of China.
Journal of Climate, 23, 649–663.
Zhang H L, Zhao X, Yin X G, Liu S L, Xue J F, Wang M, Pu C, Lal R, Chen F. 2015. Challenges and adaptations of farming to climate change in the North China Plain. Climatic
Change, 129, 213–224.
Zhang J, Sun F, Xu J, Chen Y, Sang Y, Liu C. 2015. Dependence of trends in and sensitivity of drought over China (1961–2013) on potential evaporation model.
Geophysical Research Letters, 43, 206–213.
Zhang X, Chen S, Sun H, Shao L, Wang Y. 2011. Changes in evapotranspiration over irrigated winter wheat and maize in North China Plain over three decades. Agricultural Water
Management, 98, 1097–1104.
Zhang X Y, Chen S Y, Liu M Y, Pei D, Sun H Y. 2005. Improved water use efficiency associated with cultivars and agronomic management in the North China Plain. Agronomy Journal,
97, 783–790.