Science Arts & Métiers (SAM)
is an open access repository that collects the work of Arts et Métiers Institute of Technology researchers and makes it freely available over the web where possible.
This is an author-deposited version published in: https://sam.ensam.eu Handle ID: .http://hdl.handle.net/10985/9754
To cite this version :
Yann ROUCHAUSSE, Patrice PEYRE, Denis DEFAUCHY, Gilles REGNIER - Experimental and numerical analysis of the selective laser sintering (SLS) of PA12 and PEKK semi-crystalline polymers - Journal Of Materials Processing Technology - Vol. 225, p.326-336 - 2015
Any correspondence concerning this service should be sent to the repository Administrator : archiveouverte@ensam.eu
Experimental and numerical analysis of the selective laser sintering (SLS)
of PA12 and PEKK semi-crystalline polymers
Patrice Peyre, Yann Rouchausse, Denis Defauchy, Gilles Régnier PIMM, UMR 8006 CNRS - Arts et Métiers ParisTech – CNAM
151 Bd de l'Hôpital, 75013 Paris, France
* patrice.peyre@ensam.eu, tel : 33(1) 71 93 65 44 Keywords: laser, sintering, polymers, simulation, powder
Abstract
A dual experimental-numerical approach was carried out to estimate thermal cycles and resulting fusion depths obtained during the selective laser sintering (SLS) of two polymers: PA12 and PEKK. The validation of thermal cycles was obtained by considering fusion depths on single layers for different experimental conditions and temperature measurements with IR thermal camera. It was shown that a simple Beer-Lambert’s heat deposit equation incorporating an extinction coefficient determined experimentally, and an efficiency ratio including both laser absorptivity and light diffusion in the powder bed, was sufficient for determining accurately fusion depths, and heat cycles for the two polymers. This allowed determining optimum process conditions for manufacturing additive layers on a specifically-designed SLS set-up.
Nomenclature
A Absorptivity
Cp Specific heat (J/kg/K)
D50 Average powder grain diameter (µm)
flc2hs Heaviside step function
f PWHM Laser frequency (Hz)
h heat convection loss coefficient (W/m²/K)
k Thermal conductivity (W/m/K)
K Adjustable coefficient (< 1) integrating reflectivity and diffusion losses
P0 Mean laser power (W)
Ppeak Peak laser power (W)
Pmax Maximum mean power (W)
Q surface heat flux (W/m²)
Qv Volume heat flux density (W/m3)
rlaser Laser Beam Radius at 1/e² (m)
Tms Melting start temperature (K)
Tcs Crystallization start temperature (K)
T0 Initial temperature of the powder bed (K)
Text temperature of the chamber (K) = temperature of powder layer during deposition Tlaser Laser period (s) = 1/f
Vspread Layer spreading speed (m/s)
V Laser Scanning speed (m/s)
xscale Coefficient of the Heaviside step function (m) Hm Latent heat of melting (J/kg)
Extinction coefficient of Beer Lambert's equation (m-1)
h Layer thickness (m)
Porosity ratio
Emissivity
Density (kg/m3)
Stefan-Boltzmann coefficient (= 5.67.10-8 W/m²/K4)
Laser pulse duration (s)
1.
Introduction
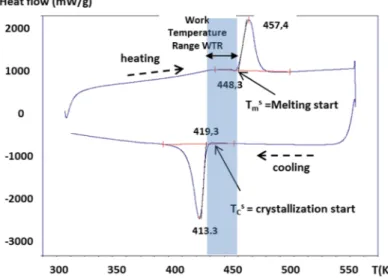
The selective laser sintering (SLS) or selective laser melting (SLM) technique has now become a viable technique for producing parts of short series of complex shapes, not only on metals but also on polymers as shown by Kruth et al. (2007), Pham et al. (2008) or Goodridge et al. (2008). Many industrial machines already exist that allow fabricating solid thermoplastic polymer components, either on rather low fusion temperatures polymers like PA6 and PA12 polyamides (Pham et al., 2008) and (Dupin, 2012), or earlier on amorphous polymers (Childs et al., 1999). Other works have focused on more technical polymers such as PEEK Schmidt et al. (2007) or PEKK (Dumoulin, 2013). When applied to semi-crystalline polymer materials, the SLS technique requires a high temperature maintain at T0 level, which needs to be comprised between the crystallization temperature start Tcs and the melting temperature start Tms. Too low temperatures (below Tcs) promote thermal shrinkage during crystallization and layer deformation, which is unacceptable for additive manufacturing. In turn, a small work temperature range WTR (T = Tms- Tcs) can be a very limiting factor for a given polymer, because a precise control of the temperature becomes a critical point (Figure 1). Usually, crystallization rates should also be maintained at a low level during the whole process, and especially during the spreading stages, in order to limit extensive distortion that prevents stable layer addition. Other critical aspects of the SLS process come from the thermo-physical properties of polymers, especially their high viscosity (nearly 106 times the viscosity of metals) that limits polymer flow, and resulting densification rates. However, as reminded by (Kruth et al., 2007), the reason why specific kinds of polymers such as polyamides PA sinter well compared with other polymers is not fully clear yet. Usually, low viscosities generally combined with low molecular weights are beneficial factors for consolidating powder beds during a SLS process. Although the SLS process has many industrial applications, the physical processes involved during the laser- polymer powder layer interaction are not well described because industrial set-ups do not allow easily physical instrumentations. Consequently, there is a real need for understanding the basic phenomena involved in the SLS process, considering more simple and opened set-ups than industrial machines. This includes the determination of laser - polymer layer coupling (absorptivity, extinction coefficients), of temperature profiles T = f(t) on molten layers, and of densification kinetics.
Previous publications have proposed macroscopic thermal numerical models for the SLM or SLS process like the 3D model of SLS by Dong et al. (2009), the 3D SLM model of Hussein et al. (2013), or more microscopic models considering powder densification at a local scale like the recent work by (Defauchy, 2013). However, most of these numerical works, and especially those carried out at a macro-scale or meso-scale on commercial codes did not systematically validate their results with experimental data, and most of all did not characterize laser – powder bed interaction. Recently, Franco et al. (2012) have addressed laser - polymer powder interaction on single sintered lines, with the objective of analyzing experimentally the laser energy consumption through the determination of geometrical features of fusion lines. However, they did not consider a combined numerical and experimental approach.
In this context our work, carried out in the frame of a French national research project (FUI Fadiplast) was focused on three objectives: (1) to develop a small SLS prototype with dedicated diagnostics to carry
out instrumented SLS tests, (2) to investigate laser - powder bed interaction, (3) to carry out numerical simulations to validate laser-material coupling and address the influence of process parameters (laser power P, scan speed V, additive layer thickness h) on the thermal cycles experienced by surface layers. Two polymers have been chosen for this work: a PA12 polyamide, and a more technical PEKK (polyetherketoneketone) with different thermo-physical properties (Table 1).
Figure 1 : DSC profile of a semi-crystalline polymer (from (Defauchy, 2013)) – On PA12, the rather large WTR (≈ 29 K) favors the SLS process
2. Materials, experimental and numerical conditions
2.1. The polymers
Two semi-crystalline polymers have been investigated: a polyamide (PA12) and a PEKK, which differ mainly by their melting and crystallization temperatures (Table 1), resulting in smaller WTR for PEKK (≈ 29 K) than for PA12 (≈ 17 K). Moreover, the PEKK is expected to be usable at much higher temperatures (up to 570 K) than the PA12 (320 K). Powder grain diameters were in-between 30 and 70 µm for the PA12 polyamide and in-between 10 and 90 µm for the PEKK (average value D50=50 µm for both), with a more spherical shape for the PA12 powders than for the PEKK.
Tg (K) Tms (K) cs WTR (K) (kg/m3) m (J/kg) Cp (J/kg.K) (Pa.s) k0* (W/m.K) PA12 325 448 419 29 1030 245000 1090 1100 0.23 PEKK 423 600 583 17 1300 43000 1340 1500 0.25
Table 1 : thermo-physical properties of dense thermoplastic polymers (Dong, 2009), (Dupin, 2012), (Defauchy, 2013) Temperature data have been determined by DSC experiments detailed in (Defauchy, 2013). * Viscosity values have been identified by rheology tests carried out just above Tm
2.2. The experimental SLS set-up
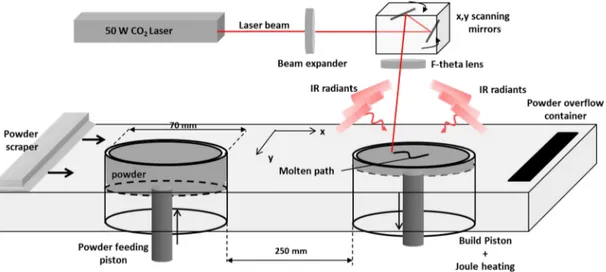
A specific SLS system was fully designed and manufactured in order to investigate basic phenomena involved during the selective laser sintering of polymers. This system is composed (Figure 3) of:
(1) two plateaus (a manufacturing plateau, and a powder feeding plateau), with a stainless steel knife as layering device, allowing to spread layer thickness of less than h=0.1 mm height with a +/-0.005 mm accuracy;
(2) Two heating systems: a resistive-heating (Joule's effect) positioned below the two plateaus, and a radiant system composed of 6 high power infra-red (IR) radiant lights operating in the 0.7 - 2 µm wavelength range, and located on top of the building plateau. This heating system is different from those available in industrial machines, but allows nearly identical thermal rise and fall;
(3) A laser system composed of a 50 W CO2 laser (ULR40, Continental) working in pulse width modulation mode (PWM: see § 3.3.1) at 5 kHz frequency at =10.6 µm, a beam expander, a scanning head, and a 300 mm focal f-theta lens;
(4) Different diagnostics: a pyrometer operating in the 8-14 µm wavelength range, to record the temperature of the powder layer on a 5 mm diameter area, a SC4000 FLIR thermal camera with a 320 x 240 pixels sensor, working in the 2-4 µm wavelength range, and a fast camera (Pixel Link) with a 200 Hz maximum frequency rate.
A SLS experiment can be summarized as follows: (1) a powder layer (30-80 µm thickness) is spread on the building plateau at average spreading temperatures of 373 K (for PA12) and 373 to 473 K (for PEKK), (2) After a few tens of seconds of IR heating, the powder layer surface reaches its optimum processing temperature T0 (controlled by the pyrometer) comprised within the WTR, and the CO2 laser irradiates and melts a given powder thickness, (3) another layer is spread.
During all the multi-layer SLS process, the temperature of the building plateau is controlled by a PID in order to be maintained within the WTR. The experimental system and its laser marking software allow building rather simple shapes, with rather long time durations (a few minutes) between subsequent layers. However, it allows positioning dedicated instrumentation around laser-powder interaction.
Figure 2 : Experimental SLS set-up (1- 50 W CO2 laser, 2- Galvanic head, 3- processing chamber, 4- CCD camera, 5-
Figure 3 : Simplified scheme of the SLS device
2.3. Numerical conditions
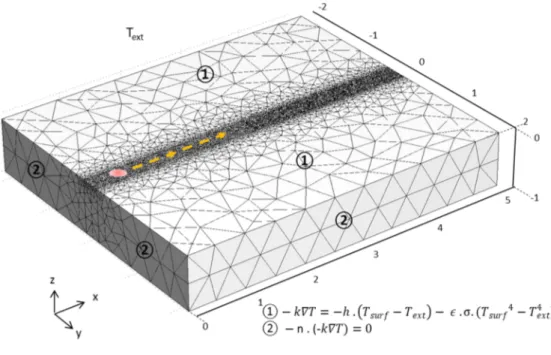
3D Numerical calculations of laser-heating were carried out on a laptop computer equipped with a four-core processor of 1.6 GHz frequency and 1600 MHz random access memory, using COMSOL MultiphysicsTM 4.2 software, and more specifically its thermal module. The meshed volume considered for the thermal simulation was a 5 mm x 4 mm x 1 mm (Fig. 4). Linear hexaedral elements were considered, with a mesh refinement in the laser path.
The heat equation was numerically solved in transient conditions (eq.1), with heat losses considered in terms of natural convection and radiative losses. In the equation of heat capacity (eq.2), the energy of solid-liquid change Hm is distributed, through a Gaussian law (Bonaccina et al. 1973), between the fusion start Tms and fusion finish Tmf temperatures (T= Tmf -Tms). Last, the laser heat deposit Qv has been considered as a volume input, following a Beer's lambert attenuation law (see § 3.1.2).
v * p . k. T Q t T . C . (eq. 1)Where k is the thermal conductivity assumed to be constant with temperature, Qv the heat source (W.m -3
), and ∗ the modified heat capacity integrating solid-liquid phase transformation as follows:
)² T T ( )² T T ( exp . )² T T ( . H ) T ( C C ms mf ms ms mf m p * p (eq. 2)
Where Tm is the temperature at the melting point (K), Tms and Tmf (K) the temperatures of fusion start and finish respectively, ΔHm the enthalpy heat of fusion, Cp (T) = considered as a constant value.
The thermal conductivity k of the powder bed was simply taken into account by considering a porosity ratio as follows (Dong, 2009):
In our case, the tapped powder porosity ratio was estimated to be around 70 % (= 0.70) for PA12 and 75 % (= 0.75) for PEKK for our spreading conditions. This was evaluated considering the change of volume after melting-solidification, and the resulting displacement of the free surface.
Boundary and initial conditions were considered as follows:
1) Initial conditions were applied as a uniform temperature distribution throughout the powder layer prior to laser melting:
T (x, y, z, 0) = T0 (eq. 4)
With T0 = initial temperature of the powder bed.
2) As boundary conditions, convective and radiative heat losses were also considered on external surfaces as follows:
-n. (k.T) = - h . (Ts– Text) - . (T4 - Text 4) (eq. 5)
With Tsis the temperature of the powder bed surface, n= normal direction, Text the initial ambient temperature (373 K for PA12, and 473 K for PEKK), h the natural convection coefficient at powder bed surface = 15 W.m-2.K-2,
the surface emissivity assumed to be equal to 0.8 for both powders considering pyrometer data, the Stefan-Boltzmann Coefficient (5.67.10-8 W.m-2.K-2).
3) a continuous flux boundary condition normal to the surface (−n. (k . ∇T) = 0) was used in the lateral and bottom part of the geometrical model to ensure a thermal continuity to the model. As no surface deformation (volume shrinkage) was considered in this model, the calculation of fusion zones was only carried out considering the first molten layer. It has also to be noticed that thermo-physical properties were kept unchanged after melting (no variation of Cp, k, ) were considered after fusion).
3. Results
3.1. Experimental analysis of the laser beam / powder coupling
3.1.1. Experimental determination of laser power spatial distribution
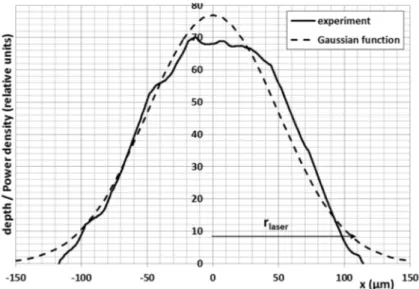
During the SLS process, and the CO2 laser irradiation of a powder bed, the spatial distribution of laser beam power is of rather high importance, because it directly influences local temperatures experienced by powder grains. For instance, considering similar laser power, non-uniform laser distributions, which are usual for CO2 lasers generate much higher thermal cycles T=f(t) at the center of laser spots, than at the near edges. In order to estimate the beam profile distribution, a simple but efficient way uses a static CO2 laser irradiation carried out on a polymer, resulting in a local fusion, and associated surface deformation. Using a high power (27.5 W) static laser impact on a dense polymer, we could measure the shape of the resulting fused crater with a 2D profilometer (Veeco Dektak 150). This allowed us estimating an analytical function for the focused beam profile (Figure 5). The spatial distribution is shown to be near Gaussian in shape (with a laser radius rlaser experimentally determined and equal to 120 µm), and the analytical function providing the best fitting with experimental measurement becomes:
0 0 2 2 ² ² . . .exp laser laser x y P Q K n n r r eq. 6With Q0= surface heat flux (W/m²), n = 4, rlaser (m) = laser radius at 1/e² = 120 µm, P0 (W) = average laser power, K = adjustable coefficient < 1 integrating reflectivity R and Mie diffusion D factors (K= (1-R).(1-D)) of the laser through the powder layer.
Figure 5 : Static CO2 laser impact at P0=27.5 W laser power on a thick polymer foil. Identification of the laser radius
and comparison of the experimentally determined fused profile (2D profilometer) with an analytical quasi-Gaussian distribution
3.1.2. Laser Power transmission measurements
Once laser beam distribution was characterized, it became important to investigate laser transmission through the powder layers to be able to estimate a reliable analytical heat input for numerical calculations.
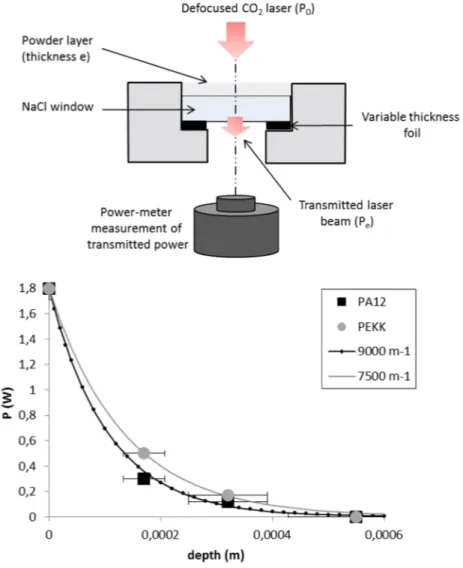
For this purpose, a specific device was developed, allowing measurement of the transmission of various powder layer thicknesses, in order to determine the power versus depth attenuation law. The experimental set-up is shown in Figure 6a. The tapped powder layers, with various thickness obtained using thin foils in the lateral part of the set-up, were spread on a 5 mm–thick NaCl window, allowing a 95 % transmission of the CO2 laser beam. Assuming that no transmission difference exists between ambient and pre-heated powder bed, such measurements provided us with useful data for numerical calculations. Results (Figure
6b) indicate a fast in-depth attenuation of the transmitted laser beam. This attenuation (and in-turn the laser absorption or diffusion in the powder layer) is shown to follow a Beer-Lambert's equation (eq.7), which is even more pronounced for the PA12 than for the PEKK. This results in a higher extinction coefficient for PA12 (9000 m-1) than for PEKK (7500 m-1). To our knowledge, such extinction coefficients, determined directly on tapped powder layers, had almost never been measured before, except in (Tolochko et al., 2000).
Q(z) = Q . exp (−αz) (eq. 7)
Where is the extinction coefficient and Q0 (x,y) the surface heat deposit (W/m²)
Figure 6 : experimental measurement of the laser / tapped power transmission- (a) experimental set-up (a defocused laser beam is transmitted through a power bed layer, below which a power measurement is carried out), (b) results obtained on PA12 and PEKK powders for a 1.8 W incident power
3.2. Experimental determination of fusion depths
SLS tests have been carried out on single layers in order to determine the evolution of molten depths with experimental parameters. Scanning speeds V in the 0.1 m/s to 1 m/s range were considered, together with laser power P0 in-between 1.7 W and 7 W. Similar conditions were used on PA12 and PEKK powder layers.
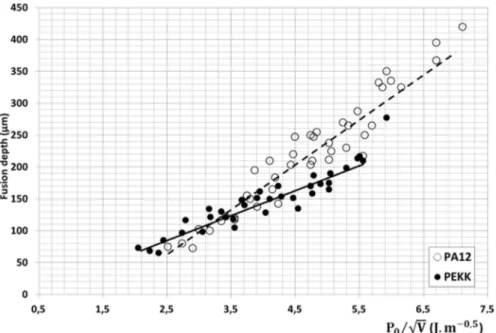
Prior to laser-melting tests, powder layers (5 mm thick to limit thermal gradients) were pre-heated up to a T0 temperature (440 K on PA12, and 600 K on PEKK) by using thermal resistances and IR radiant light sources (0.75-2 µm). The surface temperature was controlled by an IR pyrometer, and regulated by a PID system, that allows limiting local thermal variations to less than +/-2 K. With such conditions, the thermal gradient on the building plateau was near 10 K between the edges and the center of the powder bed. For each condition, optical microscopy was used to estimate fusion depths h (Figure 7), without considering non-melted agglomerated particles. The variation of molten depths was shown to follow a linear dependence versus P0 /V0.5 on the two powders investigated so far (Figure 8).
Figure 7 : Determination of fusion depths for a single pass melting of (a) PA12 powder bed (P0=2.5 W, V= 0.3 m/s,
T0=440 K), (b) PEKK powder bed (P0=3 W, V=0.3 m/s, T0=600 K)
Figure 8 : Variation of experimental molten depth with the laser process parameter P0 /V0.5 (Preheating temperatures
T0 PA12= 440 K and T0 PEKK = 600 K) .
We have addressed the numerical description of SLS considering several aspects:
- The analysis of the PWM regime in order to check the ability of a continuous heat deposit to reproduce a pulsed laser irradiation;
- The FE calculation of fusion depths and thermal cycles induced by SLS; - The influence of layer deposition on thermal stability of the powder bed.
3.3.1. Numerical analysis of the pulse width modulation (PWM) regime
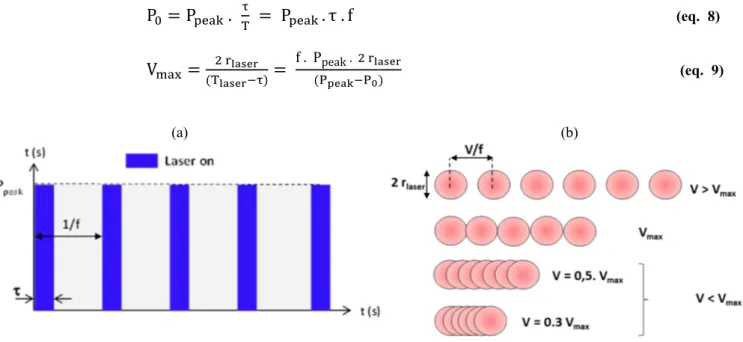
Most of the CO2 lasers used for SLS applications operate in pulsed mode, with a pulse width modulation (PWM) mode. The PWM adjusts the output power P0 by multiplying a constant output peak power value Ppeak by a duty cycle value dc = . f (with = laser pulse duration, f = pulse frequency) (eq.8).
Therefore, the PWM is an important point to address because the homogeneity of laser-powder interaction becomes strongly dependent on the frequency f of laser pulses. For instance, the CO2 laser used for our experiments operates at f = 5 kHz maximum frequency (period Tlaser = 0.2 ms) and delivers a peak power of Ppeak = 50 W. Thus, a 20 % dc is required to obtain a P0 = 10 W value, starting from a 50 W peak power (Figure 9a). Moreover, due to the pulse regime, a scan speed threshold Vmax for ensuring a minimum overlap between laser pulses (Figure 9b) was calculated by (eq.9). With our laser, considering an average power P0 = 5 W and a laser radius rlaser= 125 µm, we found Vmax = 1.56 m/s. Above Vmax, laser impacts do not intersect.
P = P . = P . τ . f (eq. 8) V = ( )= f . Ppeak . ( ) (eq. 9) (a) (b)
Figure 9 : (a) Basics of the pulse width modulation (PWM) regime: the laser operates at f frequency and pulse duration, (b) Optimization of the scanning speed in PWM regime: for scanning speeds above 0.5 Vmax, a discontinuous
SLS is obtained
FE simulations of the SLS process reported in the literature (Dong, 2009) usually consider a continuous laser irradiation, even if lasers operate in a PWM regime.
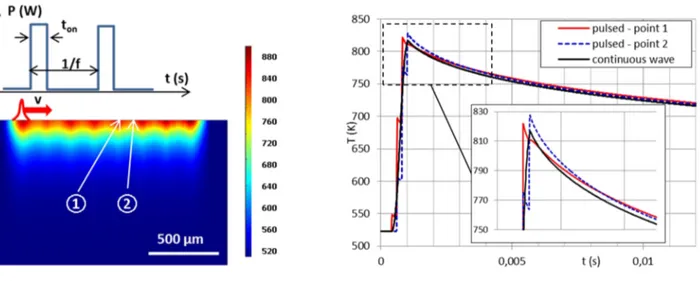
To further investigate this aspect, and determine the range of applicability of the cw assumption, we have carried out 2D simulations to calculate thermal cycles T=f(t) induced by either a pulsed laser mode (Ppeak, laser, f) or the corresponding cw regime (P0 = Ppeak . . f). The pulsed regime was simulated by considering rectangular laser pulses of laser duration. Numerical results (Figure 10) confirm that for V << Vmax, the temperature profile, and especially the maximum temperature is nearly the same (maximum variation = +/- 10 K) between the real pulsed mode and the equivalent cw regime, whatever the position
considered. Considering laser radii rlaser equal to 125 µm and frequencies equal to 5 kHz, a fully continuous laser melting was only obtained for V < 0.5 Vmax corresponding to an inter-spot distance near rlaser (Figure 9b). Above this value (= 0.78 m/s with our laser), more pronounced thermal variations occur (up to T=50 K), the surface melting becomes heterogeneous, and a cw irradiation cannot be considered anymore for the simulations. Consequently, our experimental conditions have been restricted to scanning speeds below V=0.78 m/s.
Figure 10 : Thermal simulation of the CO2 laser heating in PWM mode - Comparison with the equivalent cw heating
(PEKK powder, T0= 520 K, P0=5 W, Ppeak = 50 W, f= 5 kHz, V = 0.5 m/s)
It has to be mentioned that most of the industrial CO2 lasers can reach up to 20-25 kHz, which widely increases the scanning speed range available in SLS (up to 4-5 m/s). With such simulations, the time maintain above T0 (= 520 K in Fig. 10) is approximately 0.1 s, which is far from enough providing a full densification of polymers. Indeed, the time for densification of polymers td can be estimated by (eq.10) where = dynamic viscosity (Pa.s), d50 = average grain size (m), = surface tension (= 0.003 N.m-1 on the two polymers). This makes td = 18 s on PA12 and td = 25 s for PEKK. Such large densification times justify afterwards why SLS machines operate at a temperature level above the crystallization temperature, and maintain this temperature a long time after the laser switch-off.
t =
. (eq. 10)3.3.2. Numerical calculation of single fusion lines
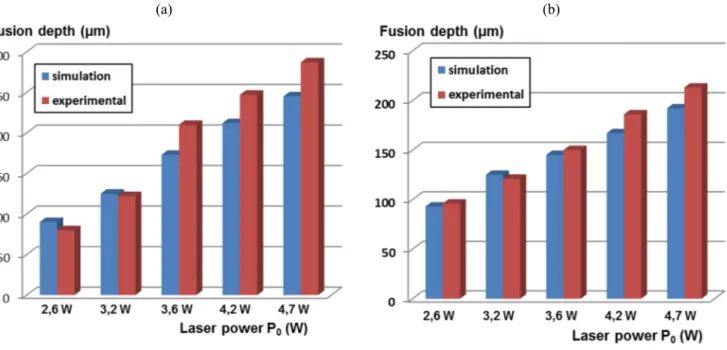
Numerical calculations of fusion depths were carried out for the two polymer powders. As extinction coefficient (m-1) and spatial distribution P=f(x,y) have been experimentally determined (section 3.1), the only adjustable factor is the K value (eq. 7), which corrects heat input by considering reflectivity and Mie diffusion losses through the powder bed.
Our numerical model was shown to reproduce correctly fusion depths on PEKK layers with the use of a K=0.4 factor (Figure 11), which indicates afterwards that approximately 60 % of the incident power is lost by reflection or diffusion processes, whereas only 40 % contributes to the polymer melting.
However, on PA12 fusion lines, the experimental value (9000 m-1) was shown to underestimate the real variation of fusion depths. For this reason, alpha was slightly decreased down to 7500 m-1, which is coincidently the same value than for PEKK, in order to provide a better fitting with experiments.
Consequently, and coincidently, similar K and alpha coefficients were identified on PA12 or PEKK polymer layers.
(a) (b)
Figure 11 : Comparison of experimental and simulated molten depths with laser power for a constant scanning speed V = 0.6 m/s, and K=0.4: (a) PA12 (simulation with 7500 m-1), (b) PEKK (simulation with =7500 m-1)
This allowed us calculating the numerical determination of maximum temperatures carried out during the SLS process (Figure 12). For instance, for a 0.6 m/s scanning speed (Figure 12), maximum calculated temperatures, averaged on a 0.1 mm diameter around the laser, are shown to vary between 690 K and 875 K with increasing laser powers. The comparison of simulated thermal profiles with experimental data was not very useful (cf Figure 13), mainly because of the lack of spatial resolution of our thermal camera sensor (1 pixel = 180 µm x 180 µm), which tends to average thermal measurements in the laser-powder bed interaction zone, and reduce maximum determined temperatures. For instance, in Figure 13, simulations indicate a 740 K maximum temperature whereas the thermal measurement indicated maximum temperatures near 635 K. A change of emissivity of PEKK above Tm (usually decreases), which would decrease the apparent temperature is also possible. Globally, the cooling part of the curve was correctly reproduced but simulations could not be validated by thermal measurements.
On a given powder bed, numerical simulations indicate a quasi-linear variation of surface temperatures with P0 (Figure 14). By comparing calculated temperatures, with the surface morphology and the color of the powder bed, we could determine temperature thresholds assumed to correspond to the thermal degradation (thermo-oxidation) of the polymer. Above 760 K, the first deterioration traces (black spots) are visible on the PEKK surface, and above 825 K, most of the polymer surface is degraded. Such modifications of the polymer surface are mostly due to the limited gas shielding used in our process (the O2 content was lowered to near 5 % due to Argon flow, but was somewhat superior to O2 levels in industrial machines).
Figure 12 : Influence of laser power P0 on the thermal cycles T=f(t) calculated at the surface of the powder bed (PEKK
powder, V=0.6 m/s, pre-heating up to 600 K). Maximum temperatures vary between 690 K and 875 K.
Figure 13 : Comparison of experimental and simulated thermal profile (PEKK powder, V=0.6 m/s, pre-heating up to 600 K, P0=2.6 W). A huge difference is shown between thermal camera measurements, and simulated profile which can
be ascribed to a modification of emissivity for the molten PEKK, and most of all, to the lack of resolution of camera sensor, that tends to average thermal values.
Figure 14 : Numerical determination of maximum temperatures, and identification of thermal damage thresholds on PEKK. Three zones are defined, corresponding to a non-degradation state below 760 K (zone 1) a partial degradation between 760 and 825 K (zone 2) and a full degradation above 825 K (zone 3).
3.3.3. Influence of layer deposition conditions on powder bed temperature
One of the main technical objectives is to maintain as stable as possible temperature levels during the SLS process in order to limit thermally induced deformations and stresses (dependent on thermal gradients G (K/m)) and to favor densification (eq.10). Such deformations are particularly important during crystallization i.e when the local temperature becomes lower than the crystallization temperature Tc. Excessive cooling rates are susceptible to occur during layer deposition, because of the lower temperature of the deposited powder bed, and the resulting sinking effects.
A specific numerical approach has been proposed to estimate optimum layer deposition conditions (thickness of deposited powder layer hpowder, temperature of the deposited powder Tpowder, deposition speed Vd) allowing maintaining the temperature of powder beds above Tc.
Basically, the numerical model uses a time-dependent Heaviside Step function flc2hs included in COMSOL MultiphysicsTM a time variation
(x, y, z, t) of thermal conductivity (eq.11) to simulate the layer deposition sequence, as already used by Peyre et al. (2008) for the DMD process. This function simulates a continuous transition from a k=0 W/m.K state (the air) at Text temperature (= the temperature of the chamber) to a k (T) state (the deposited powder bed). With such an approach, it becomes possible to estimate the local time-temperature cycle T=f (t) of the powder bed surface during layer deposition, and to evaluate the influence of various deposition parameters on fused powder thermal stability.
flc hs(x x V.t,x )
. ) T ( k ) z , x , t , T ( scale 1 2 0 (eq. 11)with flc2hs = Heaviside step function, xscale = transition interval, x0 = initial positions, V = scanning speed (m/s)
In Figure 15, we have reported the influence of powder layer thickness on surface temperature, considering a powder layer deposited at 373 K on a pre-fused powder bed with a 610 K stabilized temperature following laser surface melting (Figure 12). A rather low effect is shown on minimal temperatures (5 K), indicating that sinking effects are modified to a little extent by thicker powder layers.
For this specific configuration, the minimum temperature reached on the molten layer is 565 K, which level is expected to be below the crystallization start on PEKK.
Considering similar calculations, we could establish a processing map for powder deposition conditions (Figure 15b), allowing us selecting optimum process parameters. This map includes factors such as: the temperature of deposition (=Text), the temperature of the molten powder bed surface Tsurf before spreading and the powder layer thickness. As shown in Figure 15a, this last factor has almost no effect on thermal-microstructural transitions. Similarly, the spreading speed Vspread (considered between 0.5 mm/s and 10 mm/s) did not have significant influence on the processing map. Transitions were considered according to the crystallization peak of PEKK (crystallization start at 590K, crystallization peak at 580 K, crystallization ends at 570 K). Consequently, with the use of such a processing map, one can select optimum powder spreading conditions. For instance, for an external temperature Text (≈ powder layer temperature) of 480 K, the temperature of the molten powder bed before deposition should be superior to 605 K to fully avoid crystallization. On the other hand, considering a surface temperature before deposition of 590 K, a full crystallization will necessarily occur for Text < 440 K.
(a) (b)
Figure 15 : Numerical calculation of the layer deposition step on PEKK. (a) Influence of spread powder layer thickness (h=100 µm to 500 µm, Tpowder=370 K) on fused powder bed cooling rates (molten layer temperature= 610 K), (b)
numerical processing map: considering the temperatures of spread layers (-y) and molten layer (-x), we can define optimum process parameters relative to the crystallization temperatures: below 570 K, the PEKK is expected to be fully recrystallized, above 590 K, we can consider that no crystallization has occurred (Vspread= spreading speed = 0.001
m/s).
3.4. Selective Laser Sintering of additive polymer layers
Once a powder layer has been molten by the laser irradiation, the fused zone is expected to be maintained above the crystallization start temperature at least until the spreading of a new powder layer, in order to avoid thermal deformations during solidification and to favor densification, and resulting geometrical changes that limit the additive layer process. Even during the recoating of powder layers, cooling rates must be kept relatively low to avoid thermal shrinkage. This implies maintaining a minimum temperature in the whole processing chamber and in the spread powder, to limit excessive heat flow from the fused powder bed to the recoated powder during spreading.
Examples of multi-layers PA12 samples are shown in Figure 16, for various process conditions applied on 5 additive layers of simple squared geometries. For low P/V0.5 ratios, incomplete melting occurs (right sample from Figure 16), whereas excessive P/V0.5 values provide thermal distortions (left sample on Figure 16). Finally, optimum process conditions were found (0.2 m/s, 1.6 W). On such samples, the density, estimated by a double weighing technique (Dumoulin, 2012), was shown to be approximately 95 %, which is rather satisfactory. However, overheating effects at the edge of the samples were evidenced,
which have been attributed to a slowing down of the scanning head at the beginning and the end of each fusion lines. This caused a thermally induced curvature of the samples (Figure 17), despite a pyrometer control of the surface temperature of the powder bed, which was stabilized to T0=440 K during the process with the use of PID controller.
On PEKK powder beds, thermal distortions were even more pronounced on PEKK samples than on PA12 specimens, for similar P/V0.5 ratios (Figure 18, Figure 19). Some degradations were also confirmed for similar (P0, V) thresholds than those determined on single fusion lines (Figure 14). However, optimum porosity rates were shown to be near 15 % on PEKK, especially due to a lack of re-melting of interlayer zones. The reason why porosity rate could not be reduced was attributed to the geometrical deformation of the samples during the SLS process that necessitated using increased –z shifts values between each layer to avoid contact between the powder scraper and the fused sample. Such extended deformations were due to the combined effect of the limited work temperature range for PEKK that makes difficult avoiding crystallization, and of overheating effects near the samples edges due to non-constant scan speeds. For instance, on the PEKK sample shown in (Figure 19), the layer thickness h is 160 µm, but we could not use lower –z shift values to ensure re-melting of previous layers because of the lateral deformation of the specimen. In turn, a 180 µm z-shift was used, which was not sufficient to ensure full re-melting of interlayer zones.
Oncoming developments will focus on the galvanic head system and software with the objective of ensuring more stable scan speeds all along the fusion paths, for limiting overheating effects and associated thermal deformations.
Figure 16 : SLS Fabrication of squared PA12 samples obtained with various process conditions (T0=440 K, 5 layers)
Figure 17 : Cross section of a squared PA12 sample obtained with 5 additive layers, (T0=440 K, P=1.6 W, V= 0.2 m/s).
Fused layer thickness h is near 150 µm, and a –z shift of -120 µm of the building plateau has been used to carry out additive layers.
Figure 18 : SLS Fabrication of squared PEKK samples for different experimental conditions (T0=600 K, P=3.1 W scan
Figure 19 : Cross section of a squared PEKK sample obtained with 5 additive layers, (T0=600 K, P=3 W, V= 0.45 m/s).
Fused layer thickness h is near 160 µm. For a similar P/V0.5 ratio (3.5 J.m-0.5 s-0.5), thermal distortions are more pronounced than for PA12. A Z-shift of -180 µm was used to avoid contacts between the spreader and the deformed polymer
4. Concluding remarks
The use of combined experimental and numerical developments has been shown to provide useful information concerning laser-matter coupling, molten polymer characteristics and damage thresholds during the SLS process. For the two polymer powders investigated on a specifically designed SLS set-up, power measurements through incremental powder layers have allowed us determining the powder transmission law, which was used, multiplied by an absorption-diffusion factor K, as a volume heat source for numerical calculations. Such numerical calculations were shown to reproduce correctly experimental fusion depths with the use of a K=0.4 coefficient, which indicates that most of the incident laser light (60 %) is either reflected or diffused in the powder bed. Last, time-temperature profiles were numerically estimated on the PEKK powder, and allowed us obtaining temperature thresholds corresponding to a thermo-oxidative degradation of the polymer. In turn, this numerical approach allowed selecting adequate parameters for limiting degradation, and ensuring optimum fusion depths.
However, and even if the understanding and the optimization of SLS on a dedicated open apparatus seems to be an attractive way, the manufacturing of additive layers was shown to be problematic with our experimental set-up due to non-constant scan speed values along the fusion paths. This provoked local overheating and extensive deformations that impeded a full densification of the SLS parts.
References
C. Bonaccina, G. Comini, A. Fasano & M. Primicerio Numerical solution of phase-change problems, International Journal of Heat and Mass Transfer, 16 (1973), 1825 – 1832.
T.H.C Childs, M. Berzins, G.R. Ryder
,
“Selective laser sintering of an amorphous polymer: simulations and experiments”, Proceedings of the Institution of Mechanical engineers, Part B: Journal of Engineering Manufacture, 213(4) (1999), 333-349D. Defauchy, “Simulation du procédé de fabrication directe de pièces thermoplastiques par fusion laser de poudre”, PhD Doctorate Dissertation, Arts et Métiers Paris-Tech, 2013
L. Dong, A. Makradi, S. Ahzi, Y. Remond, “Three-dimensional transient finite element analysis of the selective laser sintering process”, Journal of Materials Processing Technology, 209(2), (2009), 700-706 E. Dumoulin, “Fabrication additive de pièces en polymères thermoplastiques hautes performances et en Polyamide 12 par le procédé de frittage sélectif par laser”, PhD Doctorate Dissertation, Mines Paris-Tech, 2014
S. Dupin, “Etude fondamentale de la transformation du polyamide 12 par frittage laser: mécanismes physico-chimiques et relations microstructures-propriétés”, PhD Doctorate Dissertation, INSA de Lyon, 2012
A. Franco, L. Romoli, “Characterization of laser energy consumption in sintering of polymer-based powders”, Journal of Materials Processing Technology, 212, (2012), 917-926
R.D. Goodridge, C.J. Tuck, R.J.M. Hague, “Laser Sintering of polyamides and other polymers”, Progress in Materials Science, 57 (2012), 229-267
A. Hussein, L. Hiao, C. Yan, R. Everson, “Finite element simulation of the temperature and stress fields in single layers built without support in selective laser melting”, Materials and Design, 52 (2013), 638-647
J.P. Kruth, G. Levy, F. Klocke, T.H.C. Childs, “Consolidation phenomena in laser and powder-bed based layered manufacturing”, Annals of the CIRP, 56(2) (2007), 730-759
P. Peyre, R. Neveu, P. Aubry, R. Fabbro & A. Longuet, “Analytical and numerical modelling of the direct metal deposition laser process”, J.Phys D: Applied Physics, 41 (2008)
D T Pham, K D Dotchev, W A Y Yusoff, “Deterioration of polyamide powder properties in the laser sintering process”, Mechanical Engineering Science, 222 (2008), 2163-2176
M. Schmidt, D. Pohle, T. Rechtenwald, “Selective Laser Sintering of PEEK”, Annals of the CIRP, 56(1) (2007), 205-208
N. K. Tolochko et al. “Absorptance of powder materials suitable for laser sintering”, Rapid Prototyping Journal, 6.3, (2000), 155-161."
Acknowledgements: Authors would like to thank the whole FADIPLAST consortium for helpful discussions, and the French Ministries of Economy, Industry and employment (Direction of Competitiveness and Services) for financial support. They would like also to thank the following ENSAM students: Boris Valkov, François Sauvage, Cyrielle Louis, Benoit Leleux and Guillaume Gentil, for their active participation in the experimental work.