TMS-Light Metals 2019
Elevated-temperature low-cycle fatigue behaviors of Al-Si 356 and 319 foundry alloys S. Chen, K. Liu, and X.-G. Chen
Department of Applied Sciences, University of Québec at Chicoutimi 555, boulevard de l’Université, Chicoutimi, QC G7H 2B1, Canada
Abstract
Al-Si foundry alloys are widely used in aerospace and automobile industries, such as the engine blocks and cylinder heads. These engine components are often exposed to cyclic mechanical stress at high operation temperature (250-350 °C) and such dynamic loading frequently results in the occurrence of fatigue failure. Hence, a fully understanding of fatigue behaviors at elevated temperature of Al-Si foundry alloys is the critical concern for safety designs. In the present study, two typical Al-Si foundry alloys, namely 356-T7 and 319-T7, were investigated to discover their low cycle fatigue (LCF) behavior at 300 °C. The LCF tests were performed in the strain-controlled compression-tension mode with the strain ratio of Rε = -1 at various strain amplitudes of 0.1-0.6%. The cyclic strain-stress response, hysteresis loops and the Masing behavior were analyzed and compared between two alloys. Fatigue parameters were calculated from experimental data for fatigue life estimation and fatigue fracture surfaces were also analyzed at various strain amplitudes. Results showed that both alloys present nearly ideal Masing behavior with symmetric hysteresis loops. The cyclic softening occurs in both alloys but the softening rate varies with alloys, which is lower in 356-T7 than 319-T7. Moreover, 356-T7 behaved more ductile while 319-T7 exhibited higher strength during cyclic deformation. 356-T7 achieved higher low-cycle fatigue life than 319-T7. The different LCF behavior of these two alloys may be attributed to the presence of various precipitates due to the variation of Mg and Cu contents.
Keywords: Al-Si foundry alloys, elevated temperature, precipitates, low-cycle fatigue.
Introduction
The Al-7%Si foundry alloys are increasingly applied to diesel engine components due to their good castability, corrosion resistance and high strength-to weight ratio. However, higher performance under repeated cyclic loading at elevated temperature (250-350 °C) is increasingly required for these components. Therefore, how to improve the fatigue resistance at elevated temperature has drawn a great attention.
In general, it is believed that engine components are subjected to multiple fatigue type and the fatigue failure is usually caused by cracking in some critical area [1]. Fatigue properties were reported to be strongly depended on microstructural characteristics of the Al-Si foundry alloys. Based on Al-7%Si alloys, a varied amount of Mg and Cu were added, which contribute to form β-Mg2Si and θ-Al2Cu precipitates during aging process, to improve strength and fatigue life at room
room temperature, limited open literature on the elevated-temperature fatigue resistance in Al-Si foundry alloys is available. In the present work, the low-cycle fatigue (LCF) behavior at 300 °C was studied in two typical Al-Si foundry alloys, namely 356-T7 and 319-T7. The typical hysteresis loop as well as the cyclic response was compared between two alloys. Fatigue life was also estimated by fatigue parameters.
Experimental procedures
Two Al-Si foundry alloys, defined as 356-T7 and 319-T7, were prepared in the present work with commercially pure Al (99.7%), pure Mg (99.9%), Al-50%Si, Al-25%Mn, Al-50%Cu, Al-10%Sr and Al-5%Ti-1%B master alloys. The chemical compositions of experimental alloys are shown in Table 1 (all alloy composition in the present work is in wt. % unless indicated otherwise). After casting, T7 heat treatment was carried out by a 2-step solution treatment (500°C/4h+540°C/2h for 356-T7 and 495°C/4h+515°C/2h for 319-T7, respectively), followed by water quenching and artificial aging at 200 °C for 5 hours.
Table 1. Chemical composition of experimental alloys (wt. %)
Alloy Si Cu Mg Mn Fe Ti Sr Al
356-T7 7.27 0.60 0.34 0.206 0.109 0.21 0.0113 Bal.
319-T7 5.93 3.34 0.12 0.284 0.307 0.11 0.0106 Bal.
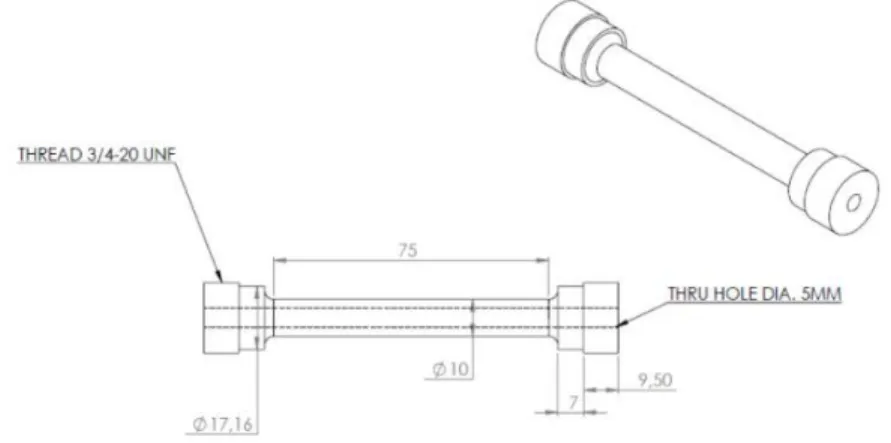
After heat treatment, cylindrical fatigue specimens were machined with a parallel gauge section 75 mm long and 10 mm in diameter with a 5 mm diameter inside hole, which is in accordance with the ASTM: E606 standard [4], as shown in Fig. 1. The LCF tests were conducted at 300 °C in a Gleeble 3800 thermal-mechanical physical simulation system under strain control. The strain ratio was set to Rε = -1 at triangular loading waveform with a strain rate of 1×10⁻³ s-1. The total strain
amplitudes of 0.1%, 0.2%, 0.4% and 0.6% were applied to both alloys. At least two samples for each condition were tested. The LCF test was considered to be finished at the cycle that the current stress amplitude drops to 40% of the maximum stress.
Fig. 1 Geometry and dimension of low-cycle fatigue test sample (unit in mm).
A scanning electron microscopy (SEM) was used to analyze the fracture surface. Thin foils for transmission electron microscopy (TEM) observation were prepared by twin-jet electrical polish method with a solution of 90 mL Nitric acid in
300 mL methanol at -25°C. A JEM-2100 TEM was operated at 200 kV to observe the precipitates and dispersoids. Results and discussion
ε-N curve and strain-stress response
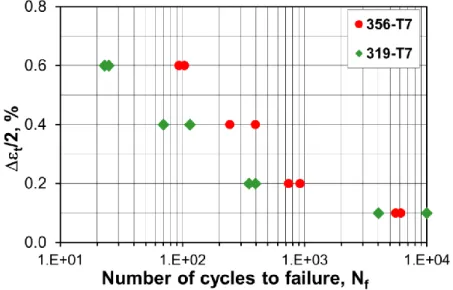
The fatigue life (the number of cycles to failure) vs the total strain amplitude (ε-N curve) of experimental alloys are demonstrated in Fig. 2. In all cases, the LCF life decreases by the increasing total strain amplitude. However, it can be observed that the LCF life of 356-T7 is longer than that of 319-T7, especially at high strain amplitude. As shown in Fig. 2. 356-T7 shows much longer LCF life at the strain amplitude of 0.4-0.6%, which is 4 times higher than 319-T7. The gap is narrowed at strain amplitude of 0.2% (2 times of 356-T7 than 319-T7) and eventually eliminated at strain amplitude of 0.1%.
Fig. 2 Values of total strain amplitudes vs. LCF life for 356-T7and 319-T7 alloys.
Fig. 3 shows the variations in cyclic stress amplitudes as a function of number of cycles at different strain amplitudes during LCF tests. Generally, the stress amplitude of 319-T7 are 10-15 MPa higher than 356-T7 alloy, indicating higher fatigue strength of 319-T7 alloy. In addition, the cyclic stress amplitude remains essential constant during the most fatigue lifetime at total strain amplitude of 0.1% while the continuous softening to failure occurs from the beginning of the fully reversed cyclic straining at strain amplitude ranges from 0.2% to 0.6% for both alloys.
The cyclic-softening response curve is considered to consist three stages: (I) fast initial softening; (II) progressive softening, which sustain for most of the fatigue cycle and (III) a rapid decrease in load capability [5]. The stage III is also described as the growth and coalescence of the microscopic cracks. On the strain-stress response curves in Fig. 3, the stage III is easily distinguished starting from the turning points, which are indicated by arrows in Fig. 3. Although 319-T7 has higher strength than 356-T7 under the most cycles, the earlier onset of the cracking that related to accumulating of microscopic cracks limits the total number of cycles of 319-T7 alloy.
Hysteresis loops
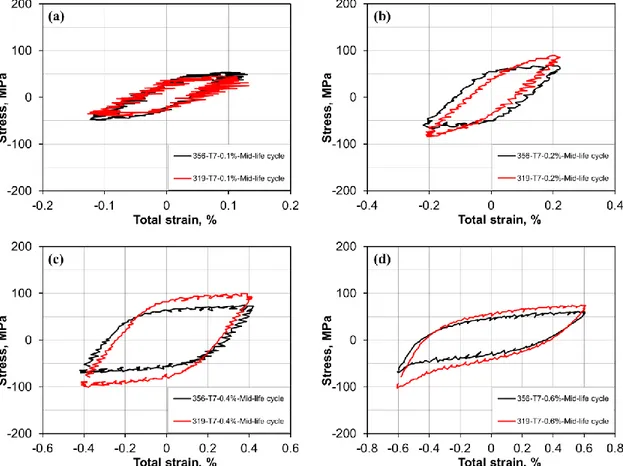
The typical hysteresis loops of mid-life cycle at different strain amplitudes of two alloys are shown in Fig. 4. The two alloys exhibit symmetrical hysteresis loops in all strain amplitudes, which is considered as the typical dislocation slip dominated deformation in face-centered cubic metals [6]. However, the maximum and minimum peak stresses of 356-T7 show an obvious reduction compared with the 319-T7 alloy. It is in agreement with the strain-stress response in Fig. 3 that 319-T7 has higher strength at strain amplitude from 0.2% to 0.6%. In addition, the wider shape of the loop reflects larger value of plastic strain deformation of 356-T7.
Fig. 4 Stress-strain hysteresis loops of mid-life cycle for 356-T7 and 319-T7 alloys at 300 °C, at strain amplitudes of (a) 0.1%, (b) 0.2%, (c) 0.4% and (d) 0.6%.
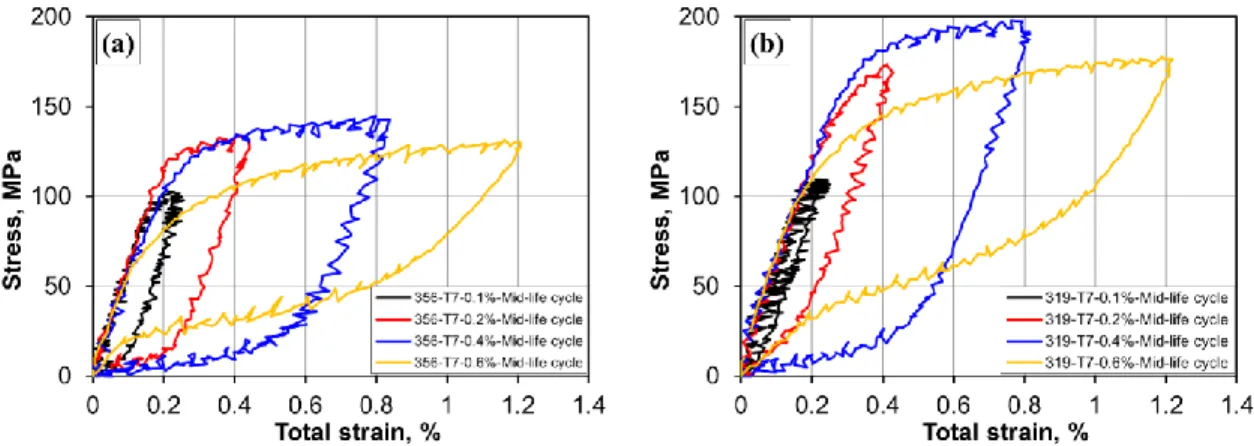
Fig. 5 presents the stable strain-stress hysteresis loops for both alloys at different strain amplitudes, plotted with the compressive tips transferred to a common origin. At lower range of strain amplitudes (0.1% to 0.4%), both alloys show
almost ideal Masing behavior and then start to exhibit non-Masing behavior at the high strain amplitude of 0.6%. This behavior is commonly referred to as near-Masing behavior [7, 8]. Nandy et al. [9] reported similar phenomenon in a LCF test of an over-aged AA6063 alloy. They suggested that the effectiveness of interactions between dislocations played a major role in cyclic deformation at lower strain amplitude, while the interactions between obstacles and dislocations exceeded those dislocation self-interactions as the strain amplitude increased.
Fig. 5 Stable strain-stress hysteresis loops plotted with matched lower tip for (a) 356-T7 and (b) 319-T7
Fatigue life and parameters
Fatigue damage due to cyclic straining can be expressed in terms of elastic and plastic components of the total strain amplitude, known as Basquin equation and Coffin-Manson relation, respectively, which are represented as [2]:
∆𝜀𝑡 2 = Δ𝜀𝑒 2 + Δε𝑝 2 = 𝜎𝑓′ 𝐸 (2𝑁𝑓) 𝑏+ 𝜀 𝑓′(2𝑁𝑓)𝑐 (1)
where Δεp/2 and Δεe/2 are plastic and elastic strain amplitudes; Nf is the number of cycle to failure that represents the fatigue
life; σf’ is the fatigue strength coefficient; b is the fatigue strength exponent; E is the Young’s Modulus which is measured in
advance before each test; εf’ is the fatigue ductility coefficient; c is the fatigue ductility exponent.
Meanwhile, a power law equation is usually used to describe the relationship between stress and strain amplitude, known as Ramberg-Osgood stress–strain relationship [10]:
∆𝜎𝑎 2 = 𝐾′ ( Δ𝜀𝑝 2 ) 𝑛′ (2)
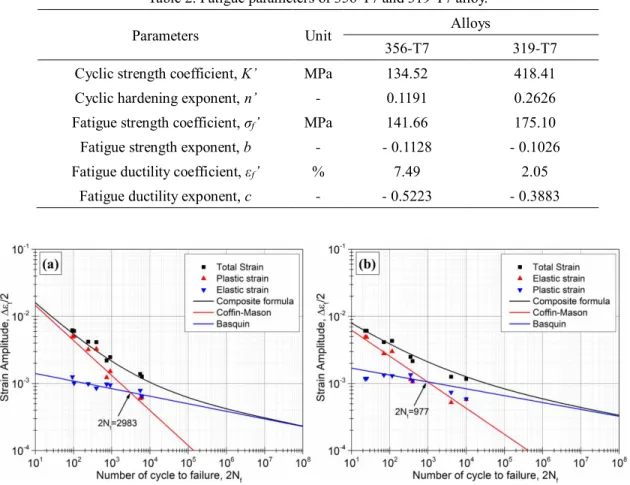
where K′ and n′ are the cyclic strength coefficient and cyclic strain hardening exponent, respectively. The fatigue parameters obtained from the calculation based on Eqs. 1 and 2 are given in Table. 2. The elastic strain, plastic strain and total strain against number of cycle have been plotted in log-log scale together with the curve of Basquin and Coffin-Mason equations and shown in Fig. 6.
As shown in Table 2, it is seen that both K’ and n’ values of 319-T7 alloy are much higher than 356-T7 alloy, which indicates higher cyclic hardening capacity in the cyclic deformation [11]. It corresponds to the hysteresis loops that 319-T7 has less plastic strain during the deformation (Fig. 4). Meanwhile, higher σf’ and b values of 319-T7 alloy correlate positively
to the exhibited high strength, which shows that it could have better fatigue resistance in the high-cycle regime. On the other hand, 356-T7 alloy has larger εf’ value, which represents higher ductility and better performance in low-cycle fatigue region.
Coffin-Mason equations, representing the cycle at which the cyclic elastic strain equals cyclic plastic strain. For 356-T7, 2Nt
equals to 2983 and the corresponding total strain amplitude is 0.07%, while it is 977 cycles at 0.11% for 319-T7. It is clear that plastic strain is predominant and the ductility will control the fatigue performance above the strain at 2Nt, while the
strength is more important to fatigue life below the strain at 2Nt. Thus, at strain amplitude of 0.2%, 0.4% and 0.6%, 356-T7
has better fatigue resistance due to its high ductility while the two alloys perform similar at 0.1%.
Table 2. Fatigue parameters of 356-T7 and 319-T7 alloy.
Parameters Unit Alloys
356-T7 319-T7
Cyclic strength coefficient, K’ MPa 134.52 418.41
Cyclic hardening exponent, n’ - 0.1191 0.2626
Fatigue strength coefficient, σf’ MPa 141.66 175.10
Fatigue strength exponent, b - - 0.1128 - 0.1026
Fatigue ductility coefficient, εf’ % 7.49 2.05
Fatigue ductility exponent, c - - 0.5223 - 0.3883
Fig. 6 Plots of Basquin and Coffin-Mason equations for (a) 356-T7 and (b) 319-T7.
Microstructure examination
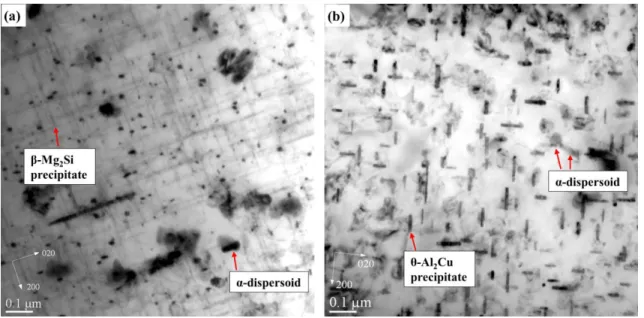
TEM examination of the fatigued specimens can reveal the microstructural characteristic related to the different LCF behavior of the alloys. As an example, bright-field TEM images of the specimens subjected to LCF at Δεt/2=0.6% are shown
in Fig. 7. M2Si and Al2Cu can be observed to be the principle precipitates in 356-T7 and 319-T7, respectively, and the minor
precipitate is α-dispersoids due to the presence of Mn in both alloys. However, a major difference in the density and size of M2Si and Al2Cu precipitates can be observed in two alloys. The presence of β-Mg2Si precipitates with smaller size and higher
number density (Fig. 7a) promotes cross-slip and homogenizes slip distribution in 356-T7 alloy, resulting in the homogeneous plastic deformation and high damage accumulating ability [12-14]. However, the Al2Cu in 319-T7 (Fig. 7b) is
Fig. 7 Bright-field TEM images of precipitates and dispersoids in (a) 356-T7 and (b) 319-T7 after LCF test at Δεt/2=0.6%.
The fatigue fracture surface features of the 356-T7 and 319-T7 alloys at total strain of 0.6% were examined by SEM. Fatigue striation spacing of 356-T7 (Fig. 8a) are observed to be smaller and more uniform than 319-T7 alloy (Fig. 8b). It is known that fatigue striations show stable fatigue crack propagation region and each fatigue striation could be assumed to represent a single loading cycle. The spacing of fatigue striations could reflect the fatigue crack propagation rate, which associated with the fatigue life. Therefore, it explains the observed lower decrease of cyclic stress that is related to slow crack propagation in 356-T7 as shown in Fig. 3. This can be attributed to the presence of finer and higher dense β-Mg2Si precipitate
in 356-T7, which results in the more uniform plastic deformation and then decreases the fatigue crack propagation rate.
Fig. 8 Fatigue striations in the propagation zone of the (a) 356-T7 and (b) 319-T7 alloy at Δεt/2=0.6%.
Conclusion
In the present work, LCF behavior at 300 °C was studied in Al-Si 356 and 319 foundry alloys under T7 conditions. Both alloys presented the cyclic softening and nearly ideal Masing behavior with symmetric hysteresis loops. However, the 356-T7
alloy behaved more ductile while the 319-T7 alloy exhibited higher strength during cyclic deformation. Higher plastic strain was obtained in 356-T7 alloy with longer LCF life. Smaller and more uniform fatigue striations were observed in 356-T7 alloy, which can be attributed to the presence of finer and higher number density of Mg2Si precipitates in 356-T7 alloy, which
can homogenize slip band distribution by cross-slip and make plastic deformation uniform.
Acknowledgements
The authors would like to acknowledge the Natural Sciences and Engineering Research Council of Canada (NSERC) and Rio Tinto Aluminum, through the NSERC Industrial Research Chair in Metallurgy of Aluminum Transformation at the University of Québec at Chicoutimi (UQAC) for providing financial support.
References
1. Riedler, M., et al. (2007) Lifetime simulation of thermo-mechanically loaded components. Meccanica, 42(1): 47-59. 2. Milella, P.P. (2012) Fatigue and corrosion in metals.: Springer Science & Business Media.
3. Feikus, F. (1998) Optimization of Al-Si cast alloys for cylinder head applications. American Foundrymen's Society, Inc, Transactions of the American Foundrymen's Society, 106: 225-231.
4. Standard test method for strain-controlled fatigue testing (2012). ASTM international, West Conshohocken (PA USA): Book of Standards.
5. Srivatsan, T. (2002) An investigation of the cyclic fatigue and fracture behavior of aluminum alloy 7055. Materials & design, 23(2): 141-151.
6. Suresh, S.(1998) Fatigue of materials. Cambridge university press.
7. Borrego, L., et al. (2004) Analysis of low cycle fatigue in AlMgSi aluminium alloys. Engineering Failure Analysis, 11(5): 715-725.
8. Christ, H.J. and H. Mughrabi (1996) Cyclic stress‐strain response and microstructure under variable amplitude loading. Fatigue & Fracture of Engineering Materials & Structures, 19(2‐3): 335-348.
9. Nandy, S., et al. (2017) Influence of ageing on the low cycle fatigue behaviour of an Al–Mg–Si alloy. Philosophical Magazine, 97(23): 1978-2003.
10. Ramberg, W. and W.R. Osgood (1943), Description of stress-strain curves by three parameters.
11. Fan, K., et al. (2013) Tensile and fatigue properties of gravity casting aluminum alloys for engine cylinder heads. Materials Science and Engineering: A, 586: 78-85.
12. Nam, S.W. and D.H. Lee (2000) The effect of Mn on the mechanical behavior of Al alloys. Metals and materials, 6(1): 13-16.
13. Kim, K. and S.W. Nam (1998) Effects of Mn-dispersoids on the fatigue mechanism in an Al–Zn–Mg alloy. Materials Science and Engineering: A, 244(2): 257-262.
14. Lee, D., J. Park, and S.W. Nam (1999) Enhancement of mechanical properties of Al–Mg–Si alloys by means of manganese dispersoids. Materials science and technology, 1999. 15(4): 450-455.