Science Arts & Métiers (SAM)
is an open access repository that collects the work of Arts et Métiers Institute of
Technology researchers and makes it freely available over the web where possible.
This is an author-deposited version published in:
https://sam.ensam.eu
Handle ID: .
http://hdl.handle.net/10985/17525
To cite this version :
Olivier ANDREAU, Etienne PESSARD, Imade KOUTIRI, Jean-Daniel PENOT, Corinne DUPUY,
Nicolas SAINTIER, Patrice PEYRE - A competition between the contour and hatching zones on
the high cycle fatigue behaviour of a 316L stainless steel: Analyzed using X-ray computed
tomography - Materials Science & Engineering A - Vol. 757, p.146–159 - 2019
Any correspondence concerning this service should be sent to the repository
Administrator :
archiveouverte@ensam.eu
A competition between the contour and hatching zones on the high cycle
fatigue behaviour of a 316L stainless steel: Analyzed using X-ray computed
tomography
Olivier Andreau
a,b,∗, Etienne Pessard
c,∗, Imade Koutiri
b, Jean-Daniel Penot
a, Corinne Dupuy
b,
Nicolas Saintier
d, Patrice Peyre
baCEA Saclay, Institut List, Bât. 565, 91191, Gif-Sur-Yvette Cedex, France
bArts et Métiers ParisTech, CER Paris, Laboratoire PIMM, UMR 8006 CNRS, ENSAM – CNAM, 151 Bd de l'hôpital, 75013, Paris, France cArts et Métiers ParisTech, CER Angers, Laboratoire LAMPA, 2 Bd du Ronceray, 49035, Angers Cedex 1, France
dArts et Métiers ParisTech, CER Bordeaux, Laboratoire I2M, Avenue d'Aquitaine, 33170, Gradignan, France
A R T I C L E I N F O
Keywords:
Powder bed fusion Laser
Austenitic stainless steel Fatigue
Defect Pore
A B S T R A C T
Metal powder bed fusion techniques can be used to build parts with complex internal and external geometries. Process parameters are optimized in order to obtain parts with low surface roughness and porosity, while maintaining a high productivity rate. The goal of this work is to quantify the sensitivity to internal and surface defects on the fatigue endurance of additively manufactured metallic parts. 316L Stainless Steel samples were fabricated through powder bed fusion using identical contour parameters, but three different hatching strategies were applied by varying the scanning speeds in the internal portions of the parts. Samples were subsequently mirror-polished to smooth the rough as-built surface. X-ray computed tomography analysis revealed several defect populations in samples from all three parametric sets due to lack of fusion in the bulk, with a nearly fully dense external “shell”. High cycle fatigue tests at R = 0.1 were then performed on the specimens and combined with the X-ray computed tomography scans, helping to identify the largest and the critical defect size at which crack initiation occurred. Most fatigue failures initiated within the external contour zone for small (< 100 μm) defects, even when larger (> 200 μm) lack of fusion defects were widely present below the surface. It was determined that the high porosity (1% in volume or above 5% in area at some fabricated layers) observed in the bulk of parts manufactured with high scanning speeds had little impact on the fatigue limit of the material.
1. Introduction
Additive Manufacturing (AM) has become an increasingly studied research topic, as the method shows promising prospects in various industrial sectors. Highly innovative complex parts can be manu-factured in order to combine several functions into a single part, as well as reducing weight via topologic optimization. Another advantage of additive manufacturing is the reduction of wasted material compared to conventional machining processes.
Among the metallic additive manufacturing techniques, powder bed fusion processes consist in superimposing layers of powder and melting them along a pattern with a high energy beam. The Selective Laser Melting (SLM) process consists in melting the powder using a laser and is the most common powder bed fusion process in industry since the pioneering work of Meiners et al. [1] two decades ago. The versatility of
the process has made it interesting for numerous industrial sectors, such as biomedical [2], automotive [3] or aerospace [4]. However, as this technology is involved in more and more cutting edge industrial pro-jects, the need for safety and proof of durability is increasing.
The complex predictability of fatigue failures in cyclically loaded metallic materials has made it one of the most studied topics in the field of durability of additive manufacturing metallic materials. Parts made using powder bed fusion can exhibit specific microstructures [5] and contain multiple defects, such as pores or lack-of-fusion [6]. Their ir-regular forms and pronounced sharpness can have a deleterious impact on the parts fatigue properties. Numerous studies have focused on proposing a better understanding of the mechanisms involved in the high cycle fatigue of additive manufacturing materials, as well as identifying key SLM parameters for promoting good part properties.
Surface finish has been long known to influence at the first order the
∗Corresponding authors.
E-mail addresses:andreau.olivier@gmail.com(O. Andreau),etienne.pessard@ensam.eu(E. Pessard).
https://doi.org/10.1016/j.msea.2019.04.101
fatigue properties of parts manufactured not only with traditional methods [7] but also using additive manufacturing techniques [8–10]. The occurrence of porosity or unmelted particles in powder bed fusion parts, especially at or near the surface, has also been shown to reduce fatigue strength [11,12]. Lastly, microstructure also plays a role on the fatigue properties, but to a lesser extent. The grain orientation versus the solicitation direction [13,14] and the grain morphology [15] can both impact the low cycle fatigue life and the fatigue crack growth behaviour. In the high cycle fatigue domain, the effect of the micro-structure seems to be less pronounced due to the presence of pores that control the fatigue strength [16].
Healing treatments, such as Hot Isostatic Pressing (HIP), that reduce porosity as well as modify the microstructure, can thus greatly affect the fatigue properties. As this method only closes internal pores, Greitemeier et al. [17] found no significant difference between the fa-tigue performance of HIPed and annealed as-built titanium parts fab-ricated with SLM or electron beam melting whereas a surface milling step significantly enhanced the fatigue limit.
Surface roughness, defects and microstructure can be directly related to the building parameters [18–22]. Such parameters usually differ from one zone to another one of the fabricated part. A distinction is often made between contour parameters that outline the limit between the built part and unmelted powder, and hatching parameters applied to densify the bulk volume. Contour parameters are usually optimized to minimize the surface roughness [18,19] while hatching parameters allow minimizing the internal porosity rate [20]. It is also well known that boundary zones, located in-between contour and hatching area are usually critical zones with a higher amount of pores [8,23].
The main challenge for laser powder bed fusion techniques is usually to combine satisfactory as-built surface finish and minimum internal porosity rate. The first criterion is addressed via the optimi-zation of the SLM process itself. The as-built surface roughness can be optimized via the laser contour parameters [18], the part position, or-ientation [19], and powder size distribution [24]. The internal porosity rate depends mostly on the laser hatching parameters, e.g.: power, speed, and scanning strategy, and has been a highly documented topic since the technology has arisen. Among other authors, Kruth et al. [25] investigated on the right process window in terms of power and scan-ning speed to obtain dense iron-based parts. More recently, the pro-ductivity was also considered as a major challenge and higher build rates/low porosity rates could be attained for higher power and scan-ning speeds, as indicated by Sun et al. on 316L [26]. Fabricating at higher speed also lowers the local temperatures and thermal gradients of part, which reduces the residual stresses and thus the need for sub-sequent thermal treatments.
In industry, post-fabrication machining is usually considered man-datory on additively manufactured metallic parts. However, it is time consuming [27], and increases the global cost of additively manufactured parts. Moreover, machining cannot be applied on complex lattice parts or for thin internal features such as thin channels [28]. Other post-proces-sing solutions have been investigated, such as chemical or electro-chemical polishing [29,30], shot peening [31], and sand blasting [32].
Despite the novelty and design freedom brought by the powder bed fusion process, it cannot yet be considered as a simple push-button technology. Post-processing is often performed, and can cost more than 50% of the manufacturing cost of a part [33]. One way to reduce the whole processing costs could be to either increase the production speed or reduce post processing steps like HIP.
However, some materials, such as 316L stainless steel, have already shown superior mechanical performances in as-built powder bed fusion parts than on post-processed parts [15,34]. Leuders et al. [15] observed a high defect tolerance of as-built 316L parts, which showed better fatigue performances in low cycle fatigue and low-level high cycle fa-tigue than after HIP or using conventional processes. The same as-built parts also showed higher yield strength and maximum strength, prop-erties that are attributed to fine substructures that are not present in
traditional or HIPed 316L [35]. On the contrary, the highly brittle be-haviour of as-built TiAl6V4 makes heat treatments or HIP often man-datory to reach a higher ductility in monotonic tensile tests or a higher fatigue limit in high cycle fatigue [15]. The high ductility combined to the high strength of the additively manufactured 316L parts is believed to be at the origin of its high defect tolerance. Some authors are even showing that this manufacturing process could help to break the strength-ductility trade-off [36,37]. It is thus of high interest to in-vestigate on the tolerance of this material towards defects in fatigue, as manufacturing at higher speeds could be of interest to enhance in-dustrial productivity.
The goal of the present work is to quantify the impact of the inner porosity rate on the fatigue behaviour of 316L stainless steel powder bed fusion parts. Different batches were manufactured using the same powder bed fusion parameters for the contour but different laser scan-ning speeds for the bulk, in order to obtain distinct pore distributions.
First, the internal pore distribution of different fatigue sample sets were estimated via metallographic methods and X-ray computed to-mography. Then, an attempt to correlate the pore population to the global fatigue performance under tensile loading was proposed for identical surface finishes. Lastly, the comparative influence of contour and hatching areas versus fatigue behaviour was addressed, in order to identify crack initiation and propagation mechanisms. Additionally, the porosity level above which the internal porosity dictates the fatigue performances was investigated, and the effectiveness of X-ray computed tomography to detect various critical pore-like defects was discussed. 2. Experimental setup
2.1. Material
The powder used to manufacture the samples was a 316L stainless steel, with the composition given in Table 1. The particle size dis-tribution measured was between 15 and 100 μm with a D50of 38 μm, similar to the powder batch used in a recent work [22].
2.2. Laser powder bed fusion building procedure
A SLM 125 HL machine with an argon shielding gas has been used to manufacture the samples. 3 sets of 10 samples were manufactured using the same parameters for the contour but different hatching parameters (Table 2). The contour parameters have been optimized to minimize the porosity density in the outer built part while minimizing the deposited energy to avoid fabrication defects such as elevated edges that impact the process stability [38].
For the bulk, the only parameter which was varied was the scanning speed, from 800 mm/s in sample set A (usual parameters for 316L), to 1100 mm/s for sample set C. The hatch was fixed at 140 μm, slightly above the usual hatch value (100–120 μm), in order to favour lack-of-fusion porosities, even for the most energetic parameter set (sample set A). Such parameters were derived from a wide process optimization study by Gunenthiram [39]. The layer thickness was 30 μm height and the scanning direction was rotated by 33° every layer.
Before the hatching step, a double contour was performed on the outer periphery of every sample using constant parameters of 100 W, 500 mm/s with a 90 μm diameter Gaussian beam.
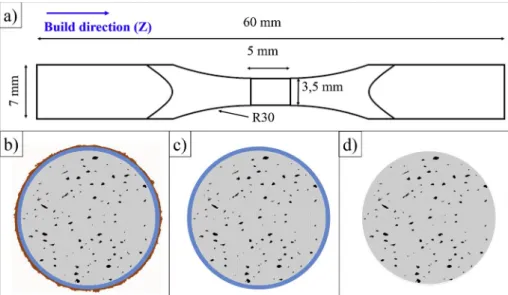
The fatigue samples (Fig. 1) were positioned randomly on the building platform and built vertically. They exhibit a 7 mm edge
Table 1
Chemical composition of the 316L stainless steel powder.
Element Fe C Si Mn P S Cr Ni Mo N wt% Bal. 0.01 0.65 1.19 0.023 0.005 17.17 10.99 2.47 0.1
squared base and a 3.5 mm diameter cylindrical gauge.
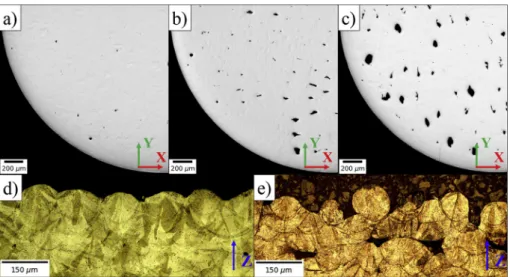
To study the effect of bulk quality and to avoid the deleterious effect of surface roughness, the fatigue samples were ground and polished using a turning machine to remove less than 100 μm in radius in order to get rid of the surface roughness (Fig. 1 b) c)). As the single bead width of one contour track obtained is above 100 μm [39], the outer surface of the polished samples is still comprised within a thin dense shell of contour. A mirror-like surface finish was obtained after 2000 grit paper, which resulted in a Ra < 0.1 μm. Fig. 2a)–c) show cross sections of samples after grinding and polishing, with various porosity amounts in the bulk but no visible open porosity.
In a second stage, the as-built samples A9, A10 and B8 to B10 were turned to remove the whole contour completely, in order to assess the impact of the open hatching porosity on the fatigue properties, as il-lustrated inFig. 1d). A total of 250 μm in radius was removed from those samples before polishing.
2.3. Characterization tools
2D porosity characterization was performed on several sample cross sections taken perpendicularly to the build direction. The images were acquired with a Zeiss Imager M2m optical microscope equipped with a 5 Megapixels Icc5 camera.
All the fatigue specimens were scanned in their central gauge by X-ray computed tomography. The source used was a Viscom XT9225 D with a maximal acceleration tension of 225 kV and maximum power of 320 W. The detector was a PerkinElmer XRD 0822 with a CsI scintil-lator. The process parameters are reported Table 3. The final voxel resolution was about 6.4 μm.
Computed tomography reconstruction, volume determination and pore detection where all performed using VGStudio Max 3.2. This software gives access to various output measurements on detected pores, such as the pore volume, area, distance to the surface, position, and projected area along the three principal directions, Z being the fabrication direction. The fracture morphologies and critical defects were observed on a Zeiss EVO MA10 Scanning Electronic Microscope
(SEM) in secondary electron mode.
2.4. Porosity characterization method
For each sample set, at least 60 optical images were taken at mag-nification 100, for a total analyzed area of more than 140 mm2. The hatching pore size distribution of each sample set was described using the Gumbel extreme value distribution, as previously shown in Refs. [12,40]. Using the cylindrical samples, the largest pore on each optical image was measured using automatic image processing with Python, and the square root of its area was used as an input to estimate the Gumbel distribution parameters. The Gumbel cumulative distribution function is given by Eq.(1)[41].
=
F x( ) exp exp (x )
(1) s root and λ and β the Gumbel location and scale parameters re-spectively.
A volumetric statistical analysis in 3D, similar to the 2D Gumbel analysis, was performed on the data provided by the computed tomo-graphy measurements. Each reconstructed cylindrical volume was subdivided in 30 voxels thick subvolumes. From all the pores with their barycentre comprised in each subvolume, the largest pore volume or projected area was extracted for statistical Gumbel analysis using a Python script. All the pores with volumes inferior to 25 voxels were filtered out of the datasets. The computed tomography projections covered 6.5 mm in height, which is more than the gauge length, for a total analyzed volume of approximately 27 mm3.
2.5. Fatigue protocol
The fatigue measurements were carried out on a dynamic drive Rumul testronic using a load cell of ± 10 kN adapted to the small sec-tion specimens used in this study. The samples were cycled vertically along the manufacturing direction at R = 0.1 stress ratio and a 65 Hz frequency. Fatigue tests were carried out using the step technique proposed by Maxwell and Nicholas [42]. The initial stress amplitude was chosen to be slightly less than the expected fatigue strength at 106 cycles. For each stress level, if the sample did not fail after 106cycles, the maximum load was increased by Δσmax= 20 MPa until failure oc-curred before reaching 106cycles. All the tests were started at stresses between 280 and 340 MPa and no sample self-heating was observed during the tests. The end of the test with final step and cycle number recording was determined when a 1 Hz drop in frequency was detected.
Table 2
Main hatching parametric sets for the three samples.
Sample Scanning Speed (mm/s) Power (W) Diameter (μm) Hatch (μm)
A 800 200 90 140
B 1000 200 90 140
C 1100 200 90 140
Fig. 1. a) Fatigue sample plan with as-built dimen-sions b) as-built gauge section drawing after fabri-cation, (c) gauge section after grinding and (d) gauge section after turning. Orange is the rough surface of the contour, the rest of the contour layer is in blue, and hatching pores are indicated in black. (For in-terpretation of the references to colour in this figure legend, the reader is referred to the Web version of this article.)
In order to analyse all the surfaces, the unbroken samples were then cycled further at the same stresses until total fracture occurred. 3. Results and discussion
3.1. Porosity measurements
As shown inFig. 2a)–c), the majority of the defects are lack-of-fu-sion with irregular shapes. Some of the rounder smaller defects, more noticeable in sample AFig. 2a), are assumed to have originated from residual gas in the powder or humidity. As expected, the biggest pores were obtained under the highest scanning speeds, for which the melt pool width and depth were slightly reduced, thus reducing the bead overlap. Additionally, excessive speeds can induce Rayleigh instability [43] that makes melt pools irregular in shape. Small variations in width or height at high scanning speeds will then cause the melt pools to spheroidize locally under the capillary pressure, and induce more lack-of-fusion defects than at lower speeds, as illustrated inFig. 2d) and e). The X-ray computed tomography scans of the fatigue samples prior testing show the same trend, with sample C having the highest amount of porosity, as seenFigs. 2and3. On the one hand, those defects are distributed randomly and homogeneously in the bulk volume. On the other hand, as observed on the micrographs Fig. 2a)–c), a near-zero porosity density is evidenced within the contour zones on the computed tomography scansFig. 3a)–c), regardless of the hatching conditions.
Romano et al. [40] described several ways to assess the porosity size distribution extracted from computed tomography data such as (1) using the cubic root of the volume of each defect or (2) using the square root of its projected area on a reference plane. However, the area ex-tracted from a pore in 3D will be larger than the area obtained with 2D
methods. First, one large interconnected pore can appear as a group of smaller pores in two dimensions, thus reducing the measured size of the largest pore in 2D. Additionally, the observed area of a defect in 2D along a plane is always inferior or equal to the projected area of the same whole 3D defect along the same plane. Using the square root of the projected area will often yield dimensions larger than the ones deduced from 2D observations. An example of this difference is illu-stratedFig. 4for the 3 main projection planes. The 3D pore population is characterized using the square root of the measured area on the XY plane (Fig. 5b) and c)) as an equivalent diameter. This approximation yields to the highest porosity diameter values and enables better dis-crimination between porosity rates in SLM.Fig. 4also confirms that lack-of-fusion defects are usually larger on the plane perpendicular to the building direction (XeY plane) than on other projection planes, as observed in Ref. [40].
The square root of the porosity area was used for 2D analysis from at least 60 1.7*1.4 mm2 micrographs. The 3D probabilistic analysis comprises more than all the sample gauge volumes. All the data have been fitted by a straight line with a reduced variable, obtained using a double log on Eq.(1):
=
F x x
log( log( ( ))) ( )
2 With x the area square root (2D) or volume cubic root (3D) and λ and β the Gumbel location and scale parameters respectively. The λs and β parameters have been found using the least square method.
On both 2D and 3D graphs, a linear distribution is observed between the reduced variable log( log( ))F and the pore size. The Gumbel distribution could therefore correctly describe the pore size distribution. The size distribution of the samples measured in 2D and 3D, along with their associated Gumbel fit in dotted lines are displayedFig. 5a) and b). The trend between the sets is in accordance with the optical observationsFig. 2a)–c). The largest defects in the set C correspond to the flattest curves (highest β) with the highest offset along the
area axis (highest ). This indicates a higher probability to en-counter large defects, along with a more scattered defect size dis-tribution, among the largest defects in the subsurfaces (Fig. 5 a)) or subvolumes (Fig. 5 b)) chosen. The size distribution probability of each sample measured in computed tomography is shownFig. 5c) and the areal and volumetric porosity extracted from 2D and 3D datasets are presented inFig. 5d). From the porosity measurements and observations from the literature for similarly porous 316L sam-ples fabricated with SLM [12], little to no variation between sets is expected in their yield strength or ultimate tensile strength.
Fig. 2. a), b), c) Optical micrographs in the building plane (X–Y) of respectively samples from set A, B and C. d), e) Optical micrographs taken along the building direction Z after etching of sample from sets A and C respectively.
Table 3
X-ray CT acquisition parameters.
Acquisition parameter Value
Tension (kV) 800 160 Current (μA) 30 Al Filter (mm) 2 Number of projections 900 Exposure time 1000 Gain (pF) 1
Detector pixel size 200
Detector dimensions (pixels) 1024
FOD (mm) 16
The dimensions and porosity rates extracted from 3D measurements are two to three times greater than those measured from 2D observa-tions. Despite some scatter in the size distribution, the samples sets A, B, and C remain clearly delimited with both methods. A break in the slope of the global distribution of set C in 3D can be observed at between 200 and 300 μm inFig. 5b). This comes from the combination of lack-of-fusion pores, especially in samples C4 and C6 (Fig. 5 c)), which exhibit the highest porosity amounts with the largest and highly interconnected pores. This double linear distribution thus shows both the likeliness for lack-of-fusion and the likeliness for large pore interconnection, which starts between 200 and 300 μm. A separate Gumbel fit for the pores > 300 μm in the set C has been plottedFig. 5b) whereas little lack-of-fusion pore interconnection is expected from sets A and B.
Those porosity measurements confirm that a statistical 2D image analysis is sufficient to identify different porous populations in different samples and that 2D or 3D porosity rate variation follow the same trends. However, the pore size measurements from 2D are not quanti-tative, especially for sets B and C, because of the lack of volumetric data, which are mandatory to separate individual tortuous pores from pore clusters. Moreover, the volume considered in one micrographic image is lower than the one considered in one computed tomography slice. This size effect makes the computed tomography method find larger defects, as there are statistically more chances to observe them. EBSD measurements were carried out post mortem on fatigue samples XY planes (Fig. 6) to analyse possible microstructural
differences that could impact fatigue properties. The average grain size measurements was shown to be 34 ± 22 μm, 29 ± 18 μm and 27 ± 15 μm for respectively sets A, B and C. In the rest of the study the grain size will be therefore considered equal for the three different batches. The contour microstructure is visible from the difference in grain morphology and measures more than 100 μm, in full accordance with the illustrations inFig. 1b) and c). The grains in the contour are smaller and oriented towards the center of the specimen, which is perpendicular to the laser scanning direction, as expected for high scanning speeds [44]. No specific grain alignment is observed in the hatching area, as the laser scanning direction is rotated at each fabri-cation layer.
3.2. High cycle fatigue resistance
In order to take into account the number of cycles in the final ap-plied stress, the fatigue limit at 106cycles was estimated using an ex-pression proposed by Nicholas [45]:
= N + N ( ) f n n f l n 1 1 3
Where fis the maximum fatigue strength, nthe stress at the last cycle, n 1the stress at the previous cycle, Nf the number of cycles at the final
stress n, andNlthe number of cycles at each step. Unless indicated, all
the samples survived at least one full step of 106cycles.
Fig. 3. Reconstructed CT with pore volumetric analysis of a) Sample A7, b) Sample B5, c) Sample C2. Cylinder diameter is 3.3 mm with a 6.5 mm height.
Fig. 4. a) 3D reconstructed pore with projection planes at barycentre, b) c) d) area projected along the three main planes at the barycentre of the defect, e) f) g) total area projected along the three main planes outside of the defect.
This method assumes that the damage induced by previous loading steps is negligible. This was verified as no drop in frequency on the vibrophore was observed in the stress levels prior to the final level.
As some samples broke outside the gauge at larger sections, the equivalent final maximum stress f in the fracture plane was
re-calculated for all the samples to include local stress concentration and real area using finite element simulation. The stress was especially corrected by a factor 1.6 and 1.4 for samples C2 and B7 respectively, while the factor remained between 0.99 and 1.1 for all other samples. The fatigue results and the defects measurements are displayed in
Table 4. Due to the large scatter of the fatigue strength some of the samples (7/30) failed near the end of the first step (at 7.105cycles and more). For these particular tests, the failure stress is directly used as an estimation of the fatigue limit.
The results of the fatigue tests (Fig. 7) show the recalculated final maximum stress compared to the porosity amount measured in com-puted tomography. Most of the fatigue limits at 106cycles fall between 300 and 400 MPa, which correlates well with the results of Zhang et al. [12] for 316L samples tested in the identical conditions and fabricated using good SLM parameters. While results from the literature show that the porosity rate can impact fatigue properties for SLM + post-ma-chining 316L samples with open porosities [46], no clear impact of the internal porosity rate (between 0.02% and 2.7% in volume) or defect
distribution was noticed on the samples tested with various hatching but similar contour conditions.
3.3. Fracture surfaces analysis
3.3.1. Contour pores induced crack initiation
For each sample, both fracture surfaces were analyzed with an SEM in order to measure the critical defect dimensions or the origin of failure. Among the 25 samples that still contained contour after the grinding and polishing operation, 22 of them showed that failure originated on a pore. Those critical pores were all located within the contour zone, which sug-gests a minimal impact of the hatching porosity located in subsurface and bulk, despite the high porosity rate in the samples from set B and C.
The SEM fracture surfaces (Fig. 8) show crack initiation sites located near the surface of the samples for the three different sets. Those cracks initiated at the edge of one specific open pore at the surface before becoming the main propagation cracks. Few multiple crack initiation sites have been observed and the position of the critical pores can be clearly identified by following the typical river patterns.
Those pores are located within the double contour and their area is between 40 and 110 μm, with an average circularity of 0.5 ± 0.2. They are shallow, have sharp angles and are flat on one side, while the other side is more tortuous with some unmelted particles as indicated in
Fig. 5. Statistical pore size distribution function derived from a) 2D observations on cross sections b) 3D computed tomography on all the specimens c) Reduced variable plot from computed tomography data for each specimen d) Porosity amount derived from analysis of optical images and volumetric data.
Fig. 8d)–i), which suggests lack-of-fusion porosities. The large number of pores evidenced in the bottom part ofFig. 8b) and c) are irregular lack-of-fusion pores that became round during the plastic final failure phase.
The origin of the lack-of-fusion pores in the double contour is unclear, but could be attributed to the combination of several phe-nomena. First, a lack of sufficient bead overlap between the starting and end point of one circular contour can occur. Additionally, an in-teraction between the laser and contaminants such as spatter or na-noparticles in specific laser trajectories could induce heterogeneities in the melt pool shape [22], and thus impact the horizontal or vertical
Fig. 6. a) Sample A Indice Pole Figure (IPF), b) Sample B IPF, c) Sample C IPF on the fabrication plane. d) Grain size histogram for the three samples. White arrows indicate the contour, grains are outlined in black for a 15° orientation difference. Dark zones inside the microstructure are lack-of-fusion pores.
Table 4
Fatigue results, critical defect dimensions, recalculated stress and layer porosity characteristics extracted from computed tomography.
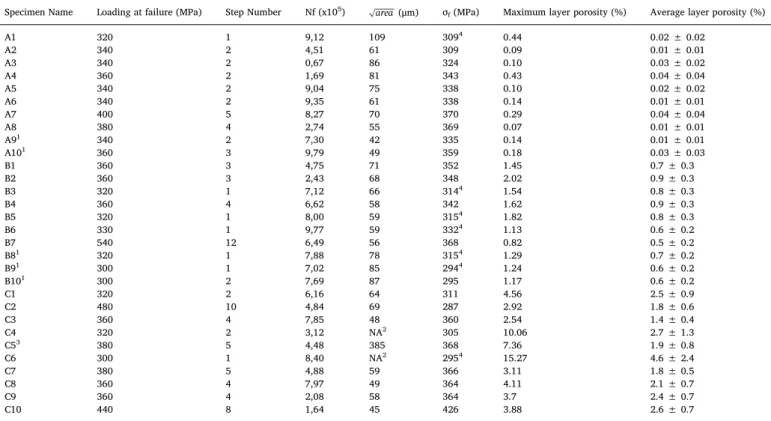
Specimen Name Loading at failure (MPa) Step Number Nf (x105) area(μm) σf(MPa) Maximum layer porosity (%) Average layer porosity (%)
A1 320 1 9,12 109 3094 0.44 0.02 ± 0.02 A2 340 2 4,51 61 309 0.09 0.01 ± 0.01 A3 340 2 0,67 86 324 0.10 0.03 ± 0.02 A4 360 2 1,69 81 343 0.43 0.04 ± 0.04 A5 340 2 9,04 75 338 0.10 0.02 ± 0.02 A6 340 2 9,35 61 338 0.14 0.01 ± 0.01 A7 400 5 8,27 70 370 0.29 0.04 ± 0.04 A8 380 4 2,74 55 369 0.07 0.01 ± 0.01 A91 340 2 7,30 42 335 0.14 0.01 ± 0.01 A101 360 3 9,79 49 359 0.18 0.03 ± 0.03 B1 360 3 4,75 71 352 1.45 0.7 ± 0.3 B2 360 3 2,43 68 348 2.02 0.9 ± 0.3 B3 320 1 7,12 66 3144 1.54 0.8 ± 0.3 B4 360 4 6,62 58 342 1.62 0.9 ± 0.3 B5 320 1 8,00 59 3154 1.82 0.8 ± 0.3 B6 330 1 9,77 59 3324 1.13 0.6 ± 0.2 B7 540 12 6,49 56 368 0.82 0.5 ± 0.2 B81 320 1 7,88 78 3154 1.29 0.7 ± 0.2 B91 300 1 7,02 85 2944 1.24 0.6 ± 0.2 B101 300 2 7,69 87 295 1.17 0.6 ± 0.2 C1 320 2 6,16 64 311 4.56 2.5 ± 0.9 C2 480 10 4,84 69 287 2.92 1.8 ± 0.6 C3 360 4 7,85 48 360 2.54 1.4 ± 0.4 C4 320 2 3,12 NA2 305 10.06 2.7 ± 1.3 C53 380 5 4,48 385 368 7.36 1.9 ± 0.8 C6 300 1 8,40 NA2 2954 15.27 4.6 ± 2.4 C7 380 5 4,88 59 366 3.11 1.8 ± 0.5 C8 360 4 7,97 49 364 4.11 2.1 ± 0.7 C9 360 4 2,08 58 364 3.7 2.4 ± 0.7 C10 440 8 1,64 45 426 3.88 2.6 ± 0.7
1: Turned to the hatching zone.
2: Layer delamination with no measurable critical pore. 3: Subsurface crack initiation.
4: Fracture detection on the first step: maximum stress endurance limit upper boundary.
melt pool overlap.
3.3.2. Crack initiation induced by near-surface hatching pores
Samples A9, A10, B8, B9 and B10 which had their contour removed all exhibited crack initiation on a hatching pore that became connected to the surface after the turning operation, as illustrated inFig. 9. In-terestingly, such hatching pores are less flat than the lack-of-fusion pores found in the contour. In set B, several hatching pores can become connected to the surface after turning, and the crack initiation occurs clearly on the largest one, as indicatedFig. 9 d) on sample B9. This result is in accordance with the thorough investigation on the compe-tition between potential critical defects carried out by Romano et al. [11] for an AlSI10Mg alloy.
3.3.3. Crack initiation induced by internal hatching pores
A subsurface crack initiation in the hatching zone was only observed in sample C5 (Fig. 10). The pores at the origin of the crack initiation are believed to be the ones indicated by the black arrows in Fig. 10b). Those two pores are likely to have interacted with one another, during the crack initiation, as defined by the neighbour proximity limit
indicated by Murakami and Beretta [47].
3.3.4. Layer delamination induced by internal hatching pores
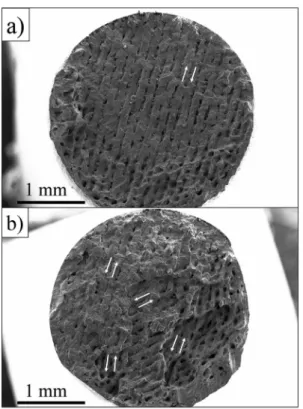
The samples C6 and C4 showed particularly low fatigue perfor-mances as their rupture occurred during the first and second loading step (300 and 320 MPa) respectively. As illustrated by Fig. 11, no specific initiation site was shown on a contour pore. The fracture surfaces show that a complete delamination occurred at one or several layers, all comprising a high amount of porosity. Large linear lack of fusion pores are clearly visible between the melt pools lines
Fig. 8. Fracture surfaces of a) Sample A7, b) Sample B2, c) Sample C7. d), e), f) Enlarged views of initiation sites in the black boxes in respectively a), b), and c). g), h), i) Mirror fractures surfaces of images d) e) f) respectively. Black arrows indicate unmelted or partially melted particles.
Fig. 9. Bottom fracture surfaces of samples a) A9, b) B9. c), d) enlarged views of the black boxes in a) and b). Critical pore is indicated by a black arrow.
Fig. 10. a) Bottom fracture surface of sample C5, b) Enlarged view of the black box
onFig. 11 a), indicated by white arrows. Several lines of lack-of-fusion with different orientations are visible onFig. 11b) between the melt pools created at different scanning angles, as fracture oc-curred at several heights.
3.4. Critical defect dimensions
The critical defect dimensions of the 22 samples where the crack initiated in the contour zone have been reported on a probabilistic plot (Fig. 12 a)). The area distribution of the three sets follows correctly the probabilistic distribution described by Gumbel cumulative dis-tribution function in Eq.(1). One can deduce that as the different sets have complementary critical defect dimension distribution, they can be considered in a single distribution. It is well confirmed on the Kitagawa diagram (Fig. 12 b)) that the global fatigue properties of samples from sets A, B, C are mostly driven by the critical defects dimensions, and not the porosity distribution in each sample. It was indeed shownFig. 7that porosity was not impacting the fatigue life at 106cycles. By combining the results from all the sample sets, despite their differences in internal porosity amounts, a global decrease in fatigue performances is observed with increasing critical near-surface pore size. The presence of internal subsurface pores appears far less detrimental on the fatigue perfor-mances, as mentioned by Beretta and Romano [48]. The only subsur-face crack initiation evidenced occurred on a pore cluster with a area value of more than 380 μm, with fatigue performances similar to the 50–90 μm range for surface pores (orange triangle inFig. 12 b)).
From the final loads at failure results displayed inTable 4, it must be emphasized that particularly high applied stresses (400 MPa–540 MPa) have been reached for specific samples in each set (A7, B7, and C2). Those samples sustained high stresses and broke outside the gauge length. One can attribute these results to the absence of critical defects in the contour shell along the gauge length despite the presence of large subsurface defects. The cracks in those samples initiated on the surface, similar to other samples where crack initiated in the gauge. This
observation shows that despite higher stresses in the gauge, the pore size and porosity level still had no impact on the fatigue limit.
3.5. Impact of the hatching pore population
Fig. 13compares area values on the XY plane of the 10 largest defects detected in computed tomography with the critical defect area identified in the post-mortem analysis. Comparison of the average de-fect sizes is summarizedTable 5. Interestingly, for set A of ground and polished specimens, the ratio between the critical defect size and the average internal defect size among the 10 largest defects detected in computed tomography is very close to 1. This ratio rises to 2.1 and 3.6 for sets B and C respectively, showing that despite very large internal pore distribution, the fatigue properties are still driven by the small surface pores. It has been well observed in high cycle fatigue that in-ternal defects are less harmful than surface defects. The inin-ternal defects are known to drive fatigue properties at lower stresses in very high cycle fatigue at 107cycles and above [49]. In high cycle fatigue, the different defect sensitivity between surface and core can be attributed to different origins: mechanical effect, environmental effect and mi-crostructural effect. Stress concentration is known to be higher at or close to the surface, and is at the origin of the stress intensity factor equations developed by Murakami [50] for internal and surface defects of any shape. The deleterious impact of air on the fatigue properties is mostly attributed to hydrogen embrittlement in steels [51]. Lower fa-tigue performances in air compared to vacuum have been observed in
Fig. 11. a) Bottom fracture surface of sample C4, b) Bottom fracture surface of sample C6. The white arrows indicate the melt pool scanning directions at one or several fractured layers.
Fig. 12. a) Critical defect size on the three sample sets with Gumbel cumulative distribution function fit, b) Kitagawa diagram of all the samples.
numerous alloys. As the manufacturing chamber of the SLM process mostly contains argon gas, internal pores are likely to contain inert gas, which does not promote environment-assisted crack initiation.
In the case of the samples A7, B7 and C2 that broke outside the gauge length, high internal defect dimensions were measured with computed tomography in the gauge. In order to emphasize the low sensitivity of 316L towards those subsurface defects, the stress intensity factor K among all the defects detected in the gauge has been calcu-lated according to Murakami's formula [52]:
=
K C area 4
With C = 0.65 for surface defects, C = 0.5 for internal defects and the stress range. A defect is considered at the surface if the empirical Murakami criterion [50] Eq.(5)is verified:
> a
h 0.8 5
With a the equivalent radius of the defect and h the distance be-tween its barycenter to the surface.
The highest stress intensity factor is compared to the stress intensity
factor measured for the critical defect observed post-mortemTable 6. Similar calculations were already performed by Romano et al. [11] for an AlSi10Mg alloy and showed a robust correlation between pre-diction with computed tomography and measured defects post mortem, several of which were embedded in the bulk. In the case of 316L, it appears that the sensitivity to internal or subsurface defects is much lower, as the crack initiation systematically occurred on a defect di-rectly connected to the surface. In the case of sample A7, the crack initiation indeed occurred on the defect with the highest stress intensity factor. However, in the case of samples B7 and C2, the stress intensity factor of the critical defect Kthis far lower than the stress intensity
factor of the internal defects detected in computed tomography, thus indicating a low sensitivity to internal defects. The same observations were made on a A357-T6 alloy containing internal defects [53,54]. Small surface defects systematically led to a fatal crack initiation and propagation despite the presence of much larger internal defects.
Table 4shows a noticeable drop in fatigue performances for the turned samples B8 to B10. On the contrary, the endurance limit of the turned samples A9 and A10 did not drop compared to the other non-turned sets. FromFig. 13, it can be observed that the critical defect dimensions after turning are not modified for set A, but increased for set B. The hatching defects dimensions that became connected to the sur-face in both sets correspond indeed to the respective defects population characterized in 2D and 3D. The area plots indicated a 20–120 μm range for set A and 80–170 μm range for set B. As a result, the hatching defects of set A that became connected to the surface have dimensions similar to the lack-of-fusion defects located in the double contour. As the hatching defects in the set B were larger, the defects connected to the surface after turning had higher dimensions than most of the other critical defects in the contour. This resulted in a lower fatigue
Fig. 13. Dimensions of the largest ten defects detected by computed tomography and of the critical defect measured post mortem. Table 5
Critical defect dimensions versus average size of the 10 largest defects detected in computed tomography for surface crack initiation specimens.
Average size of the 10 largest
defects (μm) Average critical defect size(μm) Ratio
Set A 77 75 1.0
Set B 133 63 2.1
endurance limit. These results are in accordance with observations made in the literature [11,12] where 316L and AlSi10Mg samples with the largest pore size distribution showed lower fatigue limits.
3.6. Correlation with computed tomography measurements 3.6.1. Identification of the contour pore
Some contour defects have been detected by computed tomography prior to fatigue tests. Although they could be considered as similar to the lack-of-fusion pores from the bulk, they had a low thickness (∼20 μm) along the building direction, and thus a reduced contrast with the bulk (Fig. 14b) and f)). As a result, detection and segmentation of such pores remained challenging in computed tomography. Additionally, since those pores are connected to the surface, they could modify the contour of the detected volume instead of being counted as pores.
3.6.2. Dimensions of the maximum tolerable subsurface defect
Subsurface crack initiation occurred on a cluster of pores that was observed before fatigue testing on the computed tomography measure-ments. The red pore inFig. 15 b)was measured to have the highest pro-jected area on the XY plane along with the highest volume. It likely in-teracted with the green pore that is comprised among the ten largest pores. As the exact origin of crack initiation cannot be established, and considering the vicinity of the two main pores, it is likely that they interacted together. The total area was measured at roughly 380 μm, thus showing a high threshold for subsurfacic crack initiation to occur.
3.6.3. Maximum tolerable porosity in a layer
Using VG Studio, it is possible along with the pore detection func-tion to assess the porosity of each reconstructed layer. At each com-puted tomography slice of thickness 1 voxel (6.4 μm), the directional variability feature counts the number of voxels with a grey level inferior to the local pore detection threshold and calculates its ratio with the area of the total volume, in a manner similar to the method described by Maskery et al. [55]. This method returns an areal porosity at each computed tomography slice. It must be noted that although computed tomography measurements should reflect optical 2D measurements done at the same positions in cross sections, two main differences
remain, in addition to the sample size effect. First, the resolution ob-tained is ten times larger than the resolution from 2D measurements. Second, the porosity extracted from computed tomography measure-ments remains a volumetric porosity, as it is computed for a 6.4 μm thickness. The area extracted for each pore at each slice is thus a pro-jection of the pore for 6.4 μm and is expected to yield larger results than
Table 6
Stress intensity factor comparison between the largest internal defect in the gauge and critical defects at the initiation site.
Sample Largest internal defect in the gauge measured with computed tomography Surface defect measured at the initiation site
area(μm) Distance from surface (μm) K(MPa.m1/2) area(μm) Kth(MPa.m1/2)
A7 101 1013 3.2 70 3.4
B7 136 249 5.0 56 2.9
C2 225 265 5.7 69 2.6
Fig. 14. a) b) c) d) Critical pore in sample B4 observed with and SEM, after computed tomography reconstruction, pore detection, and 3D rendering respectively. e) f) g) h) Critical pore in sample B5 observed with and SEM, after computed tomography reconstruction, pore detection, and 3D rendering respectively.
Fig. 15. a) Crack initiation area on Sample C5, b) 3D visualization of the projected area of the defects in the same zone in computed tomography at the same magnification.
an optical method. However, using this method, it is possible to assess the porosity variability inside each sample. Maximum, average and standard deviation of the layer porosity are displayedTable 4. The slice porosity has been plotted for the three experimental sets inFig. 16a)–c). The 3 samples in each set were chosen to illustrate low, average and high porosity distributions. All analyzed samples show highly variable layer porosity along the building direction, without clear physical ex-planation for the occurrence of local porosity peaks in the samples. In the set A, high porosity peaks can be observed on some samples such as A1. As the porosity rate remains low, the occasional and random pre-sence of a few pores can drastically modify the porosity rate. In the set B, some variation in porosity between samples have been evidenced but no correlation between the layer porosity and fatigue properties or failed layer was found. In the set C, some samples exhibited extremely porous layers, with porosity reaching more than 10%. In the case of sample C4, as failure occurred in the sample gauge, it was possible to retrieve the failed layer in computed tomography, which correlated perfectly with the position of the failed surface observed on the sample post-mortem. This layer also includes the pore with the largest di-mensions. Using the same technique, the maximum layer porosity of sample C5 was retrieved with a peak value at 7.4%, and the layer corresponded to the failed fracture surface Fig. 15. However, the sample C5 did not show reduced fatigue properties compared to the other sets.
The maximum computed tomography layer porosity measured for samples C4 and C6 were respectively 10.1 and 15.3%, and all the other samples from the same set where cracking initiated in the contour showed maximal layer porosity amounts between 2.5 and 4.5%. One can conclude that in the frame of this study, considering the material used and the contour quality obtained, the critical layer porosity density is between 7 and 10%. Below this value, the porosity density of the bulk has no effect in fatigue resistance and the fatigue behaviour is controlled by the contour
material or subsurface pores with large dimensions. No decrease in fatigue limit is expected. Above this value, anticipated cracking on internal por-osity can be expected and lead to lower fatigue limits.
Although the samples were placed randomly on the building plat-form, samples C4 and C6 were positioned on the farthest side of the shielding gas entry, at middle height of the building platform. This position is known to be more exposed to spatter and fusion debris during the SLM process. Those fabrication defects could be at the origin of the large and connected lack-of-fusion that induced a premature failure during the fatigue tests.
4. Summary
Three sets of 316L samples were manufactured using powder bed laser fusion, and 3 different internal porosity rates and size distributions were obtained by modifying the operating parameters. Differences in porosity distribution were found using 2D metallography and con-firmed using computed tomography on fatigue tested samples. Those samples were ground, polished and tested in fatigue at R = 0.1 with a step method. Despite the use of optimized parameters in the contour and degraded parameters in the bulk, small lack-of-fusion pores in the contour mostly prevailed over larger internal porosities to control the fatigue properties of the samples. Those defects were connected to the surface with a pronounced sharpness perpendicular to the loading di-rection. The samples turned in order to connect their lack-of-fusion hatching pores to the surface showed reduced fatigue properties in accordance with increasing pore size distribution. The main findings of this study are:
1) A maximal subsurface defect dimension has been estimated to be around 380 μm, which is 4–10 times larger than critical surface defects. Subsurface defects smaller than this value did not initiate
Fig. 16. a) b) c) Porosity ratio at each computed tomography layers for three samples in each sample set (A, B, C respectively). d) 2D visualization of the defects in sample C4 computed tomography at the position of the maximum porosity layer e) Bottom half of the fracture surface in sample C4.
cracking, and suggest a low sensitivity of the 316L to internal de-fects.
2) In materials fabricated with layer-by-layer methods in additive manufacturing, global porosity descriptors like pore size distribu-tion from statistical analysis, or volumetric porosity analysis are not always sufficient to predict the fatigue properties. New descriptors adapted to the fabrication method must be used, such as layer porosity analysis to consider the possible interaction between pores. 3) The fatigue life at 106cycles of the 316L samples tested was mostly dictated by small porosities at the surface despite the presence of large subsurface defects. The absence of those surface defects in the gauge length can lead to higher fatigue properties, up to a fatigue life at 106cycles at 500 MPa and higher.
4) High amounts of internal porosity were found to not impact the fatigue properties below 10% areal layer porosity. Above 10% porosity, premature cracking and reduced fatigue strength can be expected. This indicates that the 316L is highly defect tolerant and that a thin dense layer of contour can greatly improve the fatigue properties of the material.
In the frame of this study, it was shown than the 316L samples fabricated at conventional parameters or at 25% higher speed showed similar fatigue properties, despite the presence of large and numerous pores in the bulk, as the fatigue properties were mostly dictated by the contour in the first hundreds of microns from the surface. Although the presence of pores in additively manufactured parts and their influence on mechanical properties is a highly discussed topic in the literature, their harmfulness can be greatly impacted by their position and the density close to the surface of a sample. Productivity rates could be greatly increased by combining optimized fabrication parameters close to the surface of a part with faster parametrizations in the bulk. Acknowledgements
This work was financially supported by the CEA Digiteo, the PIMM laboratory, and the LAMPA laboratory in France.
References
[1] W. Meiners, C. Over, K. Wissenbach, R. Poprawe, Direct generation of metal parts and tools by selective laser powder remelting ( SLPR ), Proc. Solid Free. Fabr. Symp. (1999) 655–661.
[2] S. Singh, S. Ramakrishna, Biomedical applications of additive manufacturing: pre-sent and future, Curr. Opin. Biomed. Eng. 2 (2017) 105–115,https://doi.org/10. 1016/j.cobme.2017.05.006.
[3] D. Cooper, J. Thornby, N. Blundell, R. Henrys, M.A. Williams, G. Gibbons, Design and manufacture of high performance hollow engine valves by Additive Layer Manufacturing, Mater. Des. 69 (2015) 44–55,https://doi.org/10.1016/j.matdes. 2014.11.017.
[4] M. Brandt, S.J. Sun, M. Leary, S. Feih, J. Elambasseril, Q.C. Liu, High-value SLM aerospace components: from design to manufacture, Adv. Mater. Res. 633 (2013) 135–147https://dx.doi.org/10.4028/www.scientific.net/AMR.633.135. [5] A. Röttger, K. Geenen, M. Windmann, F. Binner, W. Theisen, Comparison of
mi-crostructure and mechanical properties of 316 L austenitic steel processed by se-lective laser melting with hot-isostatic pressed and cast material, Mater. Sci. Eng. 678 (2016) 365–376,https://doi.org/10.1016/j.msea.2016.10.012.
[6] K. Solberg, F. Berto, Notch-defect interaction in additively manufactured Inconel 718, Int. J. Fatigue 122 (2019) 35–45,https://doi.org/10.1016/j.ijfatigue.2018.12. 021.
[7] M.R. Bayoum, A.K. Abdellatif, Effect of surface finish on fatigue strength 51 (1995), pp. 861–870.
[8] I. Koutiri, E. Pessard, P. Peyre, O. Amlou, T. De Terris, Influence of SLM process parameters on the surface finish , porosity rate and fatigue behavior of as-built Inconel 625 parts, J. Mater. Process. Technol. 255 (2018) 536–546,https://doi.org/ 10.1016/j.jmatprotec.2017.12.043.
[9] A.B. Spierings, T.L. Starr, I. Ag, Fatigue performance of additive manufactured metallic parts 2 (2013), pp. 88–94,https://doi.org/10.1108/13552541311302932. [10] H. Yu, F. Li, Z. Wang, X. Zeng, Fatigue performances of selective laser melted
Ti-6Al-4V alloy : Influence of surface finishing, hot isostatic pressing and heat treat-ments 120 (2019), pp. 175–183,https://doi.org/10.1016/j.ijfatigue.2018.11.019. [11] S. Romano, A. Brückner-foit, A. Brandão, J. Gumpinger, T. Ghidini, S. Beretta,
Fatigue properties of AlSi10Mg obtained by additive manufacturing : defect-based modelling and prediction of fatigue strength, Eng. Fract. Mech. 187 (2018) 165–189,https://doi.org/10.1016/j.engfracmech.2017.11.002.
[12] M. Zhang, C.N. Sun, X. Zhang, P.C. Goh, J. Wei, D. Hardacre, H. Li, Fatigue and fracture behaviour of laser powder bed fusion stainless steel 316L: influence of processing parameters, Mater. Sci. Eng. 703 (2017) 251–261,https://doi.org/10. 1016/j.msea.2017.07.071.
[13] E. Liverani, S. Toschi, L. Ceschini, A. Fortunato, Effect of selective laser melting (SLM) process parameters on microstructure and mechanical properties of 316L austenitic stainless steel, J. Mater. Process. Technol. 249 (2017) 255–263,https:// doi.org/10.1016/j.jmatprotec.2017.05.042.
[14] A. Riemer, S. Leuders, M. Thöne, H.A. Richard, T. Tröster, T. Niendorf, On the fatigue crack growth behavior in 316L stainless steel manufactured by selective laser melting, Eng. Fract. Mech. 120 (2014) 15–25,https://doi.org/10.1016/j. engfracmech.2014.03.008.
[15] S. Leuders, T. Lieneke, S. Lammers, T. Tröster, T. Niendorf, On the fatigue prop-erties of metals manufactured by selective laser melting – the role of ductility, J. Mater. Res. 29 (2014) 1911–1919,https://doi.org/10.1557/jmr.2014.157. [16] V.-D. Le, E. Pessard, F. Morel, F. Edy, I.R.T.J. Verne, Influence of Porosity on the
Fatigue Behaviour of Additively Fabricated TA6V Alloys, (2018), pp. 1–9 02008. [17] D. Greitemeier, F. Palm, F. Syassen, T. Melz, Fatigue performance of additive
manufactured TiAl6V4 using electron and laser beam melting, Int. J. Fatigue 94 (2017) 211–217,https://doi.org/10.1016/j.ijfatigue.2016.05.001.
[18] T. Yang, T. Liu, W. Liao, E. Macdonald, H. Wei, X. Chen, The influence of process parameters on vertical surface roughness of the AlSi10Mg parts fabricated by se-lective laser melting, J. Mater. Process. Technol. 266 (2019) 26–36,https://doi. org/10.1016/j.jmatprotec.2018.10.015.
[19] Z. Chen, C.H.J. Davies, Surface roughness of selective laser melted Ti-6Al-4V alloy components, Addit. Manuf. 21 (2018) 91–103,https://doi.org/10.1016/j.addma. 2018.02.009.
[20] C. Kamath, B. El-Dasher, G.F. Gallegos, W.E. King, A. Sisto, Density of additively-manufactured, 316L SS parts using laser powder-bed fusion at powers up to 400 W, Int. J. Adv. Manuf. Technol. 74 (2014) 65–78, https://doi.org/10.1007/s00170-014-5954-9.
[21] T. Niendorf, S. Leuders, A. Riemer, H.A. Richard, T. Tröster, D. Schwarze, Highly anisotropic steel processed by selective laser melting, Metall. Mater. Trans. B Process Metall. Mater. Process. Sci. 44 (2013) 794–796,https://doi.org/10.1007/ s11663-013-9875-z.
[22] O. Andreau, I. Koutiri, P. Peyre, J.-D. Penot, N. Saintier, E. Pessard, T. De Terris, C. Dupuy, T. Baudin, Texture control of 316L parts by modulation of the melt pool morphology in selective laser melting, J. Mater. Process. Technol. 264 (2019) 21–31,https://doi.org/10.1016/J.JMATPROTEC.2018.08.049.
[23] S. Siddique, M. Imran, M. Rauer, M. Kaloudis, E. Wycisk, C. Emmelmann, F. Walther, Materials & Design Computed tomography for characterization of fa-tigue performance of selective laser melted parts, Mater. Des. 83 (2015) 661–669,
https://doi.org/10.1016/j.matdes.2015.06.063.
[24] A.B. Spierings, N. Herres, Influence of the Particle Size Distribution on Surface Quality and Mechanical Properties in AM Steel Parts, (2014),https://doi.org/10.
1108/13552541111124770.
[25] J.P. Kruth, L. Froyen, J. Van Vaerenbergh, P. Mercelis, M. Rombouts, B. Lauwers, Selective laser melting of iron-based powder, J. Mater. Process. Technol. (2004) 616–622,https://doi.org/10.1016/j.jmatprotec.2003.11.051.
[26] Z. Sun, X. Tan, S.B. Tor, W.Y. Yeong, Selective laser melting of stainless steel 316L with low porosity and high build rates, Mater. Des. 104 (2016) 197–204,https:// doi.org/10.1016/j.matdes.2016.05.035.
[27] D. Ahn, H. Kim, S. Lee, Fabrication direction optimization to minimize post-ma-chining in layered manufacturing 47 (2007), pp. 593–606,https://doi.org/10. 1016/j.ijmachtools.2006.05.004.
[28] J. Günther, S. Leuders, P. Koppa, T. Tröster, S. Henkel, H. Biermann, T. Niendorf, On the effect of internal channels and surface roughness on the high-cycle fatigue performance of Ti-6Al-4V processed by SLM, Mater. Des. 143 (2018) 1–11,https:// doi.org/10.1016/j.matdes.2018.01.042.
[29] T. Persenot, G. Martin, R. Dendievel, J.Y. Buffiére, E. Maire, Enhancing the tensile properties of EBM as-built thin parts: effect of HIP and chemical etching, Mater. Char. 143 (2018) 82–93,https://doi.org/10.1016/j.matchar.2018.01.035. [30] Z. Baicheng, L. Xiaohua, B. Jiaming, G. Junfeng, W. Pan, S. Chen-nan, N. Muiling,
Q. Guojun, W. Jun, Study of selective laser melting ( SLM ) Inconel 718 part surface improvement by electrochemical polishing, Mater. Des. 116 (2017) 531–537,
https://doi.org/10.1016/j.matdes.2016.11.103.
[31] N. Elad, S. Ramati, R. Shneck, N. Frage, O. Yeheskel, On the e ff ect of shot-peening on fatigue resistance of AlSi10Mg specimens fabricated by additive manufacturing using selective laser melting ( AM- SLM ), Addit. Manuf. 21 (2018) 458–464,
https://doi.org/10.1016/j.addma.2018.03.030.
[32] S.M. Ahmadi, R. Kumar, E. V Borisov, R. Petrov, S. Leeflang, Y. Li, N. Tümer, R. Huizenga, C. Ayas, A.A. Zadpoor, V.A. Popovich, Acta Biomaterialia from Microstructural Design to Surface Engineering : A Tailored Approach for Improving Fatigue Life of Additively Manufactured Meta-Biomaterials vol. 83, (2019), pp. 153–166,https://doi.org/10.1016/j.actbio.2018.10.043.
[33] T. Wohlers, Wohlers Report 2018. 3D Printing and Additive Manufacturing State of the Industry, (2018) 978-0-9913332-2-6.
[34] M. Zhang, C. Sun, X. Zhang, J. Wei, D. Hardacre, H. Li, High cycle fatigue and ratcheting interaction of laser powder bed fusion stainless steel 316L : fracture behaviour and stress-based modelling, Int. J. Fatigue 121 (2019) 252–264,https:// doi.org/10.1016/j.ijfatigue.2018.12.016.
[35] D. Kong, X. Ni, C. Dong, X. Lei, L. Zhang, C. Man, J. Yao, X. Cheng, X. Li, Bio-functional and anti-corrosive 3D printing 316L stainless steel fabricated by selective laser melting, Mater. Des. 152 (2018) 88–101,https://doi.org/10.1016/j.matdes. 2018.04.058.
W. Chen, T.T. Roehling, R.T. Ott, M.K. Santala, P.J. Depond, M.J. Matthews, A.V. Hamza, T. Zhu, Additively manufactured hierarchical stainless steels with high strength and ductility - supplementary information, Nat. Mater. 17 (2018) 63–70,
https://doi.org/10.1038/NMAT5021.
[37] L. Liu, Q. Ding, Y. Zhong, J. Zou, J. Wu, Y.L. Chiu, J. Li, Z. Zhang, Q. Yu, Z. Shen, Dislocation network in additive manufactured steel breaks strength–ductility trade-off, Mater. Today 21 (2018) 354–361,https://doi.org/10.1016/j.mattod.2017.11. 004.
[38] E. Yasa, J. Deckers, T. Craeghs, M. Badrossamay, J.-P. Kruth, Investigation on oc-currence of elevated edges in selective laser melting, Int. Solid Free. Fabr. Symp. (2009) 673–685,https://doi.org/10.1017/CBO9781107415324.004.
[39] V. Gunenthiram, Compréhension de la formation de porosités en fabrication ad-ditive (LBM). Analyse expérimentale de l ’ interaction laser - lit de poudre - bain liquide, Ecole nationale supérieur d’arts et métiers, (2018) https://pastel.archives-ouvertes.fr/tel-02025457.
[40] S. Romano, A. Brandão, J. Gumpinger, M. Gschweitl, S. Beretta, Materials & design quali fi cation of AM parts , Extreme value statistics applied to tomographic mea-surements 131 (2017) 32–48,https://doi.org/10.1016/j.matdes.2017.05.091. [41] E.J. Gumbel, The return period of flood flows, Ann. Math. Stat. 12 (1941) 163–190,
https://doi.org/10.1214/aoms/1177731747.
[42] D.C. Maxwell, T. Nicholas, A rapid method for generation of a Haigh Diagram for high cycle fatigue, in: T.L. Panotin, S.D. Sheppard (Eds.), Fatigue an, vol. 29, 1999, pp. 626–641.
[43] S.R.S. Lord Rayleigh, On the instability of a cylinder of viscous liquid under ca-pillary force, Philos. Mag. A 34 (1892) 145–154.
[44] Y. Arata, F. Matsuda, A. Matsui, Effect of welding condition on solidification structure in weld metal of aluminum alloy sheets, Trans. J. Weld. Res. Insitute. 3 (1974) 89–97https://ir.library.osaka-u.ac.jp/repo/ouka/all/5158/.
[45] T. Nicholas, Step loading for very high cycle fatigue, Fatigue Fract. Eng. Mater. Struct. 25 (2002) 861–869.
[46] M. Zhang, C.N. Sun, X. Zhang, J. Wei, D. Hardacre, H. Li, Predictive models for fatigue property of laser powder bed fusion stainless steel 316L, Mater. Des. 145
(2018) 42–54,https://doi.org/10.1016/j.matdes.2018.02.054.
[47] Y. Murakami, S. Beretta, Small defects and inhomogeneities in fatigue strength: experiments , models and statistical implications, Extremes 2 (1999) 123–147,
https://doi.org/10.1023/A:1009976418553.
[48] S. Beretta, S. Romano, A comparison of fatigue strength sensitivity to defects for materials manufactured by AM or traditional processes, Int. J. Fatigue 94 (2017) 178–191,https://doi.org/10.1016/j.ijfatigue.2016.06.020.
[49] K.S. Chan, Roles of microstructure in fatigue crack initiation, Int. J. Fatigue 32 (2010) 1428–1447,https://doi.org/10.1016/j.ijfatigue.2009.10.005.
[50] Y. Murakami, Metal Fatigue : Effect of Small Defects and Nonmetallic Inclusions, Elsevier, 2002.
[51] J. Petit, J. de Fouquet, G. Henaff, Influence of ambient atmosphere on fatigue crack growth behaviour of metals, Handb. Fatigue Crack Propag. Met. Struct. 2012, pp. 1159–1203, ,https://doi.org/10.1016/b978-0-444-81645-0.50010-x.
[52] Y. Murakami, S. Kodama, S. Konuma, Quantitative evaluation of effects of non-metallic inclusions on fatigue strength of high strength steels. I: basic fatigue me-chanism and evaluation of correlation between the fatigue fracture stress and the size and location of non-metallic inclusions, Int. J. Fatigue 5 (1989) 291–298
papers3://publication/uuid/996FC2ED-444E-449F-B3DD-98798309C249.
[53] A. Rotella, Y. Nadot, M. Piellard, R. Augustin, M. Fleuriot, Fatigue limit of a cast Al-Si-Mg alloy ( A357-T6 ) with natural casting shrinkages using ASTM standard X-ray inspection, Int. J. Fatigue 114 (2018) 177–188,https://doi.org/10.1016/j.ijfatigue. 2018.05.026.
[54] I. Serrano-Munoz, J.Y. Buffiere, C. Verdu, Casting defects in structural components: are they all dangerous? A 3D study, Int. J. Fatigue 117 (2018) 471–484,https://doi. org/10.1016/j.ijfatigue.2018.08.019.
[55] I. Maskery, N.T. Aboulkhair, M.R. Cor, C. Tuck, A.T. Clare, R.K. Leach, R.D. Wildman, I.A. Ashcroft, R.J.M. Hague, Materials Characterization Quanti fi cation and characterisation of porosity in selectively laser melted Al – Si10 – Mg using X-ray computed tomography, 111 (2016) 193–204,https://doi.org/10.1016/ j.matchar.2015.12.001.