Science Arts & Métiers (SAM)
is an open access repository that collects the work of Arts et Métiers Institute of Technology researchers and makes it freely available over the web where possible.
This is an author-deposited version published in: https://sam.ensam.eu
Handle ID: .http://hdl.handle.net/10985/14159
To cite this version :
Florent COLOMBET, Zhou FANG, Andras KEMENY - Pitch tilt rendering for an 8-DOF driving simulator - In: Driving Simulation Conference 2015 Europe VR, Allemagne, 2015-09-16 - Driving Simulation Conference 2015 Europe - 2015
Any correspondence concerning this service should be sent to the repository Administrator : [email protected]
Pitch tilt rendering for an 8-DOF driving simulator
Florent COLOMBET 1,2, Zhou FANG 1, Andras KEMENY 1,3
(1) Renault, Virtual Reality and Immersive Simulation Center, TCR AVA 0 13, 1 avenue du Golf, 78288 Guyancourt, France, e-mail: {florent.colombet-renexter, zhou.fang, andras.kemeny}@renault.com (2) Theoris, 103 rue La Fayette, 75010 Paris, France, e-mail: [email protected]
(3) Arts et Métiers ParisTech, Institut Image, 2 rue Thomas Dumorey, 71100 Chalon-sur-Saône, France, email : [email protected]
Abstract – Tilt coordination technique is used for reproducing a sustained linear acceleration in driving
simulation by tilting the simulator cabin. Thus a part of gravity is interpreted as a horizontal acceleration. Between the slow rotational motion limited by the rotational perception threshold of semi-circular canals of vestibular system and the fast change of acceleration to render, the design of coupling motions of rotation and translation plays a critical role in the realism of driving simulator.
We present here an experiment focusing on longitudinal accelerations rendering with pitch tilt coordination technique. Eight drivers experienced the same accelerations and decelerations on a straight double-lane motorway. During the driving, we varied the pitch rate (4, 5, 6 and 7 °/s) and the pitch acceleration (8 and 30 °/s²) used to render these accelerations with the tilt coordination technique. We have found an acceptability threshold of about 6°/s, similar to the value found in our previous work on roll tilt rendering. We have also shown a strong role of pitch rotational acceleration on acceptability, involving that it should be taken into account to properly render accelerations with the tilt coordination technique.
Keywords: Driving simulation, Motion cueing algorithm, Tilt coordination, Pitch acceleration threshold,
Vestibular system
Introduction
The role played in automotive industry by driving simulators is increasingly important. During the design phase, they allow testing new advanced driver assistance systems (ADAS) such as ACC, AEBA, EPS, LKA etc. by studying driver’s behaviour. They also allow testing the car’s handling, ride comfort, drivability, behaviour, performance or fuel consumption without having to build a physical prototype.
In order to have a driver’s behaviour as close as possible as the one he/she could have in a real driving environment, driving simulators should provide the driver with the necessary cues. Especially for tasks like accelerating and braking, which are one of the most common basic tasks a driver can perform, driving simulators should provide the driver with inertial cues allowing him/her to regulate his/her action [Kem03].
For ADAS and AV (Autonomous Vehicle) experimentations at Renault VR and Immersive Simulation Center, being able to perform accurate tests on a driving simulator is a crucial point, because of the large number of interests depending on it in terms of cost and delay reduction. Unfortunately, the level of longitudinal acceleration rendered in simulation during accelerations and
decelerations is sometimes not strong or long enough according to professional test pilots who interpret the driving simulator feeling tightly connected to the driving commands, including the vehicle speed. Actually, the available effective X-Y rails strokes (5.2 meters) of the ULTIMATE simulator appear to not be enough to render the needed acceleration level during the complete duration of accelerations or brakings for some of the most demanding vehicle applications. This is why we are focusing our research on the implementation of the tilt coordination technique in the motion cueing algorithm of the ULTIMATE simulator.
After presenting the tilt coordination technique and the difficulties generally encountered when using it in driving simulation, we will see that some thresholds needed for its implementation on a motion cueing algorithm remain unclear. Our experiment aims at comparing eight parameters configurations in terms of rotational rate and acceleration to see the acceptance of drivers and then determine what acceleration levels can be reached with the tilt coordination technique.
Tilt coordination technique
Human body perceives accelerations among others thanks to the inner ear [Gra06] which is composed of two parts. The first, called the otholitic system, is
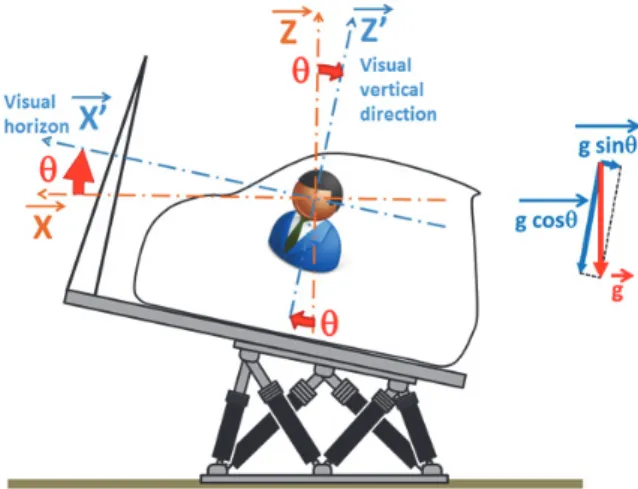
sensitive to the linear accelerations while the second, called the semi-circular canals, is sensitive to angular accelerations. Nevertheless the otholitic system presents a perception ambiguity: it cannot differentiate a horizontal acceleration from an inclination around a horizontal axis because of the horizontal component of gravity. In driving simulation, this gravito-inertial equivalence is thus used in motion cueing strategies to render a part of the vehicle accelerations. It is known as tilt coordination technique (see Figure 1).
Fig. 1. Illustration of the tilt coordination technique. By tilting the simulator cabin of an angle , the component
g*sin of the gravity may be interpreted by the driver as an
horizontal acceleration.
However the inclination during the tilt coordination technique has to be done under certain conditions to remain unnoticed by the driver. First the driver must not be able to visually perceive the tilting. Visual rendering has then to be compensated if the display screen is not fixed to the cabin. Secondly, the rotation has to remain under the semi-circular canals detection thresholds.
Knowledge about rotational motion perception appears thus as primordial for the use of the tilt coordination technique, especially the detection thresholds. According to the particular dynamics of canals’ model, Guedry [Gue74] has traced a relationship between the rotational acceleration and the time exposed to the excitation. The theoretical model is correlated by Young & Meiry’s [You68] experience data and gives, e.g., a rotational acceleration threshold of about 8°/s² for a 0,2s exposure and of 0.3°/s² for 10s exposure. Based on the step excitation and the canals’ dynamic model, Mulder [Gue74] has adopted a rotational rate approach. He has proposed a tilt rate perceived law and given a tilt rate threshold of about 2°/s, independent on tilt acceleration. This low tilt threshold seems a reasonable value for a driving simulator in the case of very low linear motion involved [Cha07]. By mean of a robotic simulator, Nesti et al. [Nes12] have showed with dynamic driving scenario and pure tilt motion that the roll rate threshold can be raised to a much higher value
(about 5.2°/s) and suggested a high tilt rate threshold of 6°/s. For roll tilt rendering in an active driving scenario, most recent values seem to confirm this threshold (6°/s for [Pre14]) as well as the results of our previous work (5°/s for [Fan14]).
Problem
We do not know if these results about roll tilt thresholds are applicable for pitch rotations. We can yet only suppose that they will be similar. Furthermore, the studies are generally focused on the tilt rate. But semi-circular canals are sensitive to rotational accelerations [Gue74] so tilt acceleration might be an important factor to consider as well for the realism of driving simulator.
What are the appropriate thresholds for pitch tilt rate and acceleration in the case of longitudinal acceleration rendering? What exactly are the tilt limits in this type of scenario? Does rotational acceleration has an impact on the perceived quality of the tilt coordination technique? The present study deals with this topic in order to optimize Renault ULTIMATE 8-DOF simulator motion cueing algorithm.
It can be difficult to realize a natural and ideal driving pitch tilt scenario because of the limits of simulator workspace. Several authors [Jam10, Str14] have studied directly or indirectly the tilt rate threshold. These tests are based on observer’s feeling with slow sinus pre-scripted scenario which simplifies greatly the real accelerating or braking fast variation of acceleration. The high threshold used by these authors could lead to simulator sickness for a general driving test.
We want to compare several tilt rates and accelerations for pitch tilt rendering during active moderate accelerating and braking operations. Being active is also an important point as it can lead to higher thresholds values in comparison to passive driving (6 °/s vs 4 °/s for roll tilt in Pretto experiment [Pre14]).
Motion cueing algorithm
Renault ULTIMATE simulator
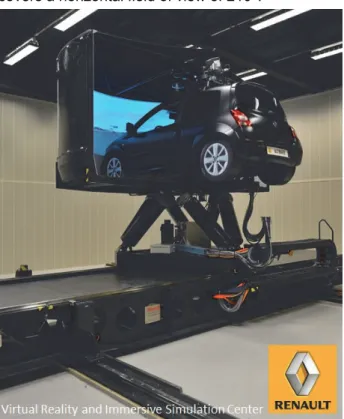
We intend to conduct our experiment on the high-performance dynamic ULTIMATE simulator [Dag06] at Renault Virtual Reality and Immersive Simulation Centre (VRISC) (Fig. 2). First developed in 2001, this simulator has been renewed in 2011 [Sch12] and consists now of a closed cabin based on a Renault Twingo 2 car which has been lightened and instrumented. Inside the cab, transmission is carried out using a manual gearbox, and a software of sound synthesis is used to reproduce engine noise and the audio environment for an interactive vehicle. Sound is rendered thanks to active noise-cancelling headphones Bose QuietComfort 25.
Active steering force feedback is computed by a proprietary model and reproduced by a SENSO-Wheel system. The SCANeR© Studio 1.4 software package is used with a real-time version of the MADA (Advanced Modelling of Vehicle Dynamics) vehicle dynamics software, developed by RENAULT. The visual environment is displayed on a cylindrical screen (radius 1.9 m) thanks to five single-chip DLP projectors (Projection Design F12), each with a resolution of 1980 x 1080. The system covers a horizontal field of view of 210°.
Fig. 2. Renault ULTIMATE driving simulator at Virtual Reality and Immersive Simulation Centre.
The cabin is mounted on a large X-Y table and a hexapod motion system to render physical accelerations and rotations. Table 1 presents the physical capabilities of the motion system.
Table 1. Physical capabilities of Renault ULTIMATE simulator
Stroke Speed Accel. X Rail ± 2.6 m ± 2.0 m/s ± 5.0 m/s² Y Rail ± 2.6 m ± 3.0 m/s ± 5.0 m/s² X Axis ± 0.28 m ± 0.7 m/s ± 7.5 m/s² Y Axis ± 0.26 m ± 0.7 m/s ± 7.5 m/s² Z Axis ± 0.20 m ± 0.7 m/s ± 5.0 m/s² H Axis ± 15 ° ± 40 °/s ± 300 °/s² P Axis ± 15 ° ± 40 °/s ± 300 °/s² R Axis ± 15 ° ± 60 °/s ± 600 °/s²
MPC-based motion cueing algorithm
The motion cueing algorithm is in charge of computing the physical displacements of the simulator cabin as a function of the simulated vehicle motion. It has to realize a compromise between rendering the vehicle accelerations (interms of driver perception) and keeping the simulator within its physical limits. The algorithm used on the ULTIMATE simulator is a MPC-based (Model Predictive Control) motion cueing algorithm as described by Fang [Fan14]. Compared with classical or LQR optimal filters’ approaches, the MPC integrates directly the system constraints into its optimization process, and then gives a real optimal solution and hardly needs the tuning process to check the workspace limits and the driver’s perception thresholds.
In the motion cueing process, acceleration rendering with the tilt coordination technique has been added and is performed as a priority. The equivalent acceleration thus rendered is then subtracted from the vehicle acceleration before being rendered with the rails.
Tilt rotation thresholds (in terms of amplitude, rate and acceleration) are explicitly taken into account in the optimization process of the algorithm. Different configuration sets can be used and the possibility to switch online from one to another has been implemented. In this case, a transition phase between the two configurations is performed during 5 seconds.
We can also specify that rotation motions are rendered around the driver’s head centre. Both vehicle and tilt coordination rotations are computed around this particular point. Specific modules are in charge of realizing the change of coordinates from the rotation point of the hexapod to the driver’s head by adding linear motions (on the hexapod and not on the XY rails).
Experimental Protocol
General Purpose
We aim at determining the acceptable pitch tilt coordination parameters for longitudinal acceleration and deceleration rendering. Table 2 gives the details of the 8 compared tilt configurations in terms of maximum rotational rate and acceleration. Maximum tilt angle is 8 ° for every configuration. We varied only the maximum tilt rate from 4 to 7 °/s and the maximum tilt acceleration from 8 to 30 °/s².
Table 2. Compared tilt configurations
# CFG Max tilt rate [°/s] Max tilt acceleration [°/s²]
1 4 8 2 4 30 3 5 8 4 5 30 5 6 8 6 6 30 7 7 8 8 7 30
Task description
After starting the vehicle and setting up the vehicle speed at 60 km/h, subjects were asked to perform longitudinal accelerations and decelerations respectively from 60 to 100 km/h and from 100 to 60 km/h. These accelerations and decelerations are long enough (nearly 8 seconds) so they cannot be fully rendered with rails only. Thus the use of pitch tilt coordination rendering does make sense in these cases.
On one hand, we wanted the driver to be as much active as possible, while having an active driving has an impact on driver’s perception threshold [Pre14]. On the other hand, allowing the driver to behave freely can induce a bias while comparing the different tilt configurations. The solution we used was to perform pre-scripted accelerations and decelerations when the driver pressed the gas pedal or the brake pedal. Thus the driver was free to accelerate or brake when he wanted but accelerations and decelerations had the same duration and intensity so the comparison of the different tilt configurations was not biased.
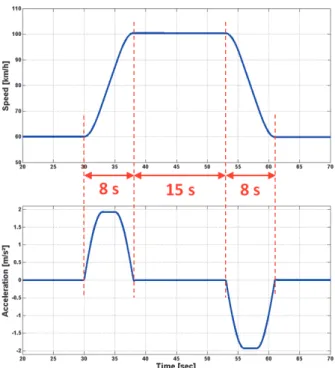
Figure 3 presents an example of the crenel of speed which was repeated during the experiment. Acceleration and deceleration last 8 seconds and 15 seconds are left between in order to let enough time to the platform to preposition itself in the simulation room. For the same reason during experiment and also to let enough time to switch motion cueing configuration, speed crenels were spaced between them of at least 15 seconds.
Fig. 3. Pre-scripted crenel of speed used for the experiment.
In order to help drivers to keep a constant speed between accelerations and decelerations, a modified cruise control has been implemented in
the vehicle. Its working is quite simple: it maintains the current vehicle speed when the driver releases gas and brake pedals.
Road description
The road used for this experiment was a straight portion of a double-lane motorway (see Figure 4). This portion is visually realistic and there was no traffic. Orange cones were dispatched on the road so the drivers knew where and when to accelerate and to brake.
Fig. 4. Screenshot of the double-lane motorway.
Protocol
After presenting them the simulator and the purpose of the experiment, subjects were proposed to perform a familiarization driving in which they could perform 4 speed crenels with alternatively no tilt (rails only) and tilt rendering.
For the experiment, there were 16 speed crenels to perform in total. The crenels were paired (1A/1B, 2A/2B, 3A/3B, ...). For each “A” crenel, no tilt coordination was done: accelerations/decelerations were rendered with rails only. For each “B” crenel, one of the 8 configurations (see Table 2) was used for tilt rendering.
Subjects were asked to accelerate/brake when they reached a pair of orange cones as explained in previous subsection. These cones were spaced in order to let enough time to the simulator cabin to preposition itself in the simulation room (nearly 15 seconds) and also to the motion cueing algorithm to switch configuration. They were disposed as shown in Figure 5.
Questions asked
After each pair of speed crenels, three questions were asked to the drivers. They had nearly 1 minute to answer these three questions before reaching the next pair of orange cones and beginning the following pair of speed crenels (see Figure 5). 1. “During accelerations/decelerations, how would
you quote the visual stability of virtual environment?” Quote between 1 (perfectly stable) and 6 (not stable at all).
2. “During accelerations/decelerations, did you experienced ocular discomfort?” Quote between 1 (no discomfort) and 6 (strong discomfort).
3. “How would you quote the acceptability of the acceleration/deceleration rendering with tilt coordination?” Quote between 1 (not acceptable at all) and 6 (perfectly acceptable).
Subjects and configurations order
Eight volunteer expert subjects have participated to the experiment. Table 3 presents the configurations order for the 8 participants. We used a counterbalanced diagram latin square in order to avoid rank effects (a given configuration is only once in a particular position) and report effects (any configuration is followed or preceded only once by each of the 7 other configurations).Table 3. Configurations order for the 8 participants
Subject Configuration order
# 1 1 8 2 7 3 6 4 5 # 2 2 1 3 8 4 7 5 6 # 3 3 2 4 1 5 8 6 7 # 4 4 3 5 2 6 1 7 8 # 5 5 4 6 3 7 2 8 1 # 6 6 5 7 4 8 3 1 2 # 7 7 6 8 5 1 4 2 3 # 8 8 7 1 6 2 5 3 4
Results
Acceleration rendered profiles
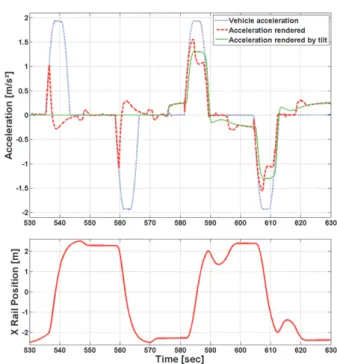
Figure 6 presents a comparison of longitudinal acceleration rendering between using rails only (no tilt) and using tilt coordination technique (configuration 5: 6 °/s and 8 °/s²). The second graph of this figure shows the corresponding longitudinal displacement of the cabin in the simulation room.
Quotation results
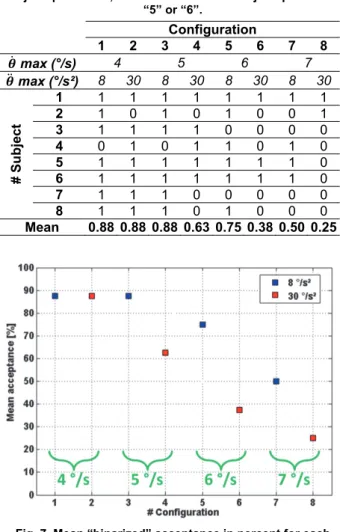
Tables 4 to 6 present the three quotation results: visual stability of the virtual environment, ocular discomfort and overall acceptability of the tilt configuration. Table 7 presents the “binarized” quotation of acceptability: “0” if subject quoted “1”, “2” or “3” and “1” if subject quoted “4”, “5” or “6”. These “binarized” data are plotted on Figure 7, with
a reminder of the tilt parameters to which they correspond.
Fig. 6. Comparison of longitudinal acceleration rendering between using rails only (no tilt) between 530s and 580s and
using tilt coordination technique (configuration 5: 6 °/s and 8°/s²) between 580s and 630s. For the same vehicle acceleration, the acceleration rendered is closer to the input
in the second case.
Table 4. Quotation of visual stability of virtual environment during accelerations and decelerations (1 = perfectly stable,
6 = not stable at all)
Configuration 1 2 3 4 5 6 7 8 ࣂሶ max (°/s) 4 5 6 7 ࣂሷ max (°/s²) 8 30 8 30 8 30 8 30 # Su b ject 1 6 6 4 6 6 6 4 4 2 3 5 5 5 6 4 6 6 3 5 5 4 4 3 2 3 3 4 3 3 2 2 2 3 4 3 5 5 5 5 5 5 5 5 5 6 5 4 5 5 5 4 4 2 7 5 5 5 4 2 2 2 2 8 4 4 5 4 4 3 3 3 Mean 4.5 4.6 4.4 4.4 4.1 3.6 3.9 3.5
Table 5. Quotation of ocular discomfort during accelerations and decelerations (1 = no discomfort, 6 = strong discomfort)
Configuration 1 2 3 4 5 6 7 8 ࣂሶ max (°/s) 4 5 6 7 ࣂሷ max (°/s²) 8 30 8 30 8 30 8 30 # Su b ject 1 1 1 3 1 1 1 3 3 2 2 1 1 2 1 3 1 1 3 1 1 2 2 2 3 2 3 4 4 4 5 5 5 4 4 4 5 2 2 2 2 2 2 2 2 6 2 3 2 2 2 2 3 4 7 1 1 1 1 1 2 3 3 8 2 2 2 3 2 3 4 3 Mean 1.9 1.9 2.3 2.3 2 2.5 2.8 2.9
Table 6. Quotation of the acceptability of acceleration rendering with given tilt configuration (1 = not acceptable at
all, 6 = perfectly acceptable)
Configuration 1 2 3 4 5 6 7 8 ࣂሶ max (°/s) 4 5 6 7 ࣂሷ max (°/s²) 8 30 8 30 8 30 8 30 # Su b ject 1 6 6 4 5 6 5 4 4 2 4 3 4 3 5 3 3 5 3 5 5 4 4 3 2 3 3 4 3 4 3 4 4 3 4 3 5 5 5 5 5 4 5 4 3 6 5 4 5 5 5 4 4 2 7 4 5 4 3 3 2 1 2 8 4 4 4 3 4 3 2 3 Mean 4.5 4.5 4.1 4 4.3 3.4 3.1 3.1
Table 7. “Binarized” quotation of the acceptability of acceleration rendering with given tilt configuration : : “0” if subject quoted “1”, “2” or “3” and “1” if subject quoted “4”,
“5” or “6”. Configuration 1 2 3 4 5 6 7 8 ࣂሶ max (°/s) 4 5 6 7 ࣂሷ max (°/s²) 8 30 8 30 8 30 8 30 # Su b ject 1 1 1 1 1 1 1 1 1 2 1 0 1 0 1 0 0 1 3 1 1 1 1 0 0 0 0 4 0 1 0 1 1 0 1 0 5 1 1 1 1 1 1 1 0 6 1 1 1 1 1 1 1 0 7 1 1 1 0 0 0 0 0 8 1 1 1 0 1 0 0 0 Mean 0.88 0.88 0.88 0.63 0.75 0.38 0.50 0.25
Fig. 7. Mean “binarized” acceptance in percent for each configuration
Discussion
For the accelerations and decelerations we wanted to render in this experiment, we see on Figure 6 the effect of the tilt coordination technique. On this figure, the first acceleration and deceleration are rendered with rails only (no tilt) and it appears
clearly that nothing is rendered after nearly 2 seconds because the longitudinal displacement of the cabin has reached the maximum possible excursion on the rails. On the other acceleration and deceleration showed in figure 6, the tilt coordination technique is used and we see that it allows rendering a sustained longitudinal acceleration / deceleration during all the virtual vehicle acceleration / deceleration. However, the drawback is that it needs to preposition the cabin in order to benefit from the maximum possible rail stroke. In fact the motion cueing algorithm uses the time during which the cabin accelerates with the rails to slowly tilt the cabin under the determined pitch rate and acceleration thresholds.
The quotation results (Tables 4 to Table 6) are also interesting. First we can see that their results are congruent: when pitch rate and acceleration are increased, the visual stability quotation decreases (drivers find the visual environment less stable), the ocular discomfort quotation increases, and the acceptability quotation decreases. An 2 way ANOVA analysis shows that the effect of rotational speed on the level of acceptability is significant (F(2,14) = 5.58, p=0.017).
Concerning the level of acceptability, results presented on Table 6 shows that we can split our configurations into 2 groups: configurations 1 to 5 with a mean acceptance level beyond 4, and configurations 6 to 8 with a mean acceptance level near 3. It leads us to think that the maximum acceptable pitch rate is 6 °/s if the pitch acceleration is 8 °/s². For this particular rate, there is a significant difference of mean acceptance between 8 °/s² (cfg #5) and 30 °/s² (cfg #6). A 2 way ANOVA analysis on the data of configurations 3 to 8 (pitch rate >= 5 °/s) shows that the impact of rotational acceleration is significant (F(1,7) = 9,33, p=0.018).
This impact of rotational acceleration on the driver’s acceptability of the tilt coordination technique is more visible with the “binarized” data (Table 7 and Figure 7). Once again we can split configurations in the 2 same groups: configurations 1 to 5 with a mean acceptance greater than 60 % and configurations 6 to 8 with a mean acceptance below 50 %.
In addition to showing the decrease of mean acceptance when the pitch rate increases, Figure 7 shows also the impact of rotational acceleration. For every pitch rate greater than 4 °/s, the mean acceptance level is 30 % lower with a rotational acceleration of 30 °/s² than with a rotational acceleration of 8 °/s². As semi-circular canals are sensitive to accelerations, this can be easily understandable. As for the configurations 1 and 2 (4 °/s), we can explain the equivalent result between the 2 levels of rotational acceleration by the fact that these rotational accelerations are very quick with this rate. The rotational speed of 4 °/s is quickly
reached and as Guedry [Gue74] showed, the quicker the stimulus, the higher the threshold. Finally, quotation of the visual stability of the environment reveals also an interesting fact. Some of the drivers have reported that during accelerations and decelerations they felt like the road is going respectively up and down. This feeling was the main cause of their quotation. It can be explained with the vestibulo-occular reflex, activated by the tilting motion and trying to visually compensate an image that doesn’t need to and inducing the previously described effect.
Conclusion
We have presented in this paper an experiment aiming at determining the pitch rate and acceleration thresholds for the acceptability of the tilt coordination technique. We compared 8 configurations, resulting of the combination of 4 rotational rates (4, 5, 6 and 7 °/s) and 2 rotational accelerations (8 and 30 °/s²).
We have found an acceptability rate threshold of 6 °/s, close to the value of 5 °/s we found on our previous work on roll tilt rendering. We also found a strong influence of rotational acceleration on the driver’s acceptability if the rotational rate used is greater than 5 °/s. Although most studies focus on rotational rate, we’ve found that, for the same rotational speed, having a rotational acceleration of 30 °/s² instead of 8 °/s² decreased the mean acceptability of at least 30%. We thus recommend taking this acceleration value into account into motion cueing algorithm using the tilt coordination technique.
These pitch tilt thresholds of 6 °/s and 8 °/s² obtained as acceptable values for 6 out of our 8 subjects will be used with Renault’s 8-DOF Ultimate high performance driving simulator for a more efficient use of the available workspace for forthcoming industrial applications using driving simulation.
References
Chapron T., Colinot J.P., The new PSA
Peugeot-Citroën Advanced Driving Simulator – Overall design and motion cue algorithm, Proceedings of DSC North
America 2007, Iowa City
Dagdelen M., Berlioux J.-C., Panerai F., Reymond G., Kemeny A., Validation process of the ULTIMATE high
performance driving simulator, Proceedings of Driving
Simulation Conference, 2006
Fang Z., Colombet F., Collinet J.-C., Kemeny A., Roll tilt
thresholds for 8 DOF driving simulators, Proceedings
of DSC Europe 2014, Paris, France
Fang Z., Kemeny A., Review and prospects of
Renault’s MPC based motion cueing algorithm for
driving simulator, Proceedings of DSC Europe 2014,
Paris, France
Guedry F.E., Psychophysics of vestibular sensation. In: Kornhuber HH (ed) Handbook of Sensory Physiology; 1974, Vol. VI/2. Springer Verlag, Berlin, Heidelberg, New York, pp 3-154
Graf W., Klam F., Le système vestibulaire : anatomie
fonctionnelle et comparée, évolution et développement, Comptes Rendus Palevol 5, 2006, no.
3-4, pp. 637-655.
Jamson A. H. J., Motion Cueing in Driving Simulators
for Research Applications, Ph D Thesis, University of
Leeds, Nov. 2010
Kemeny, A. Panerai, F., Evaluating perception in
driving simulation experiments, Trends in Cognitive
Sciences, 2003, 7(1), pp. 31-37
Nesti A., Masone C., Barnett-Cowan M., Giordano P. R., Bülthoff H. H., Pretto P., Roll rate thresholds and
perceived realism in driving simulation, Proceedings
of DSC Europe 2012, Paris, France
Pretto P., Nesti A., Nooij S., Losert M., Bülthoff H. H.,
Variable roll-rate perception in driving simulation,
Proceedings of DSC Europe 2014, Paris, France
Schill V, Schulz T., Kemeny A., Collinet J.-C., Legrand O., Deborne R., Renewal of the Renault Ultimate
Simulator, Proceedings of DSC Europe 2012, Paris,
France
Stratulat A., Diaz E., Vars P., Msfrand S., Leblond L., Gruel G., Meira M. M., Savona F., Bourdin C., Real vs
virtual driving or how to improve the realism of a dynamic driving simulator, Proceedings of DSC Europe
2014, Paris, France
Young L.R, Meiry J.L., A revised dynamic otolith