Science Arts & Métiers (SAM)
is an open access repository that collects the work of Arts et Métiers Institute of
Technology researchers and makes it freely available over the web where possible.
This is an author-deposited version published in: https://sam.ensam.eu Handle ID: .http://hdl.handle.net/10985/10856
To cite this version :
Mohamed ACHOURI, Guénaël GERMAIN, Philippe DAL SANTO, Delphine SAIDANE, Marcela V. CID ALFARO, Carel H.L.J. TEN HORN - Failure prediction and validation of a steel automotive safety part - In: International Conference on Damage Mechanics (1 ; 2012 ; Belgrad),
Yougoslavie, 2012-06-25 - International Conference on Damage Mechanics Proceedings - 2012
Any correspondence concerning this service should be sent to the repository Administrator : archiveouverte@ensam.eu
FAILURE PREDICTION AND VALIDATION OF A STEEL
AUTOMOTIVE SAFETY PART
M. Achouri1, G. Germain1, P. Dal Santo1, D. Saidane2, M. V. Cid Alfaro3, C.H.L.J. ten Horn3
1LAMPA(EA1427), 2 Boulevard du Ronceray BP 93525, 49035 Angers-France
e-mails: Mohamed.Achouri@ensam.eu, Guenael.Germain@ensam.eu, Philippe.DalSanto@ensam.eu,
2 DEVILLE ASC, ZI de Beauregard 49150 Baugé-France e-mail: delphine.saidane@devillesa.fr
3Tata Steel Research, Development & Technology, PO BOX 10000 1970 CA IJmuiden-The Netherlands
e-mail: Carel.ten-Horn@tatasteel.com
Abstract.
The objective of this work was to investigate the failure behaviour of a HSLA steel component subjected to a bending-unbending operation. This study was conducted through a combined experimental and numerical approach to better understand the limitations of current models and generate more suitable data that can be used to further optimise the manufacturing process. The numerical approach was carried out using two finite element codes (ABAQUS and PAM-STAMP) and two fracture models (Gurson and CrachFEM). The material and fracture data to be used in the numerical simulations was obtained through mechanical tests (tensile and shear tests) conducted to identify the monotonic and damage behaviour of S500MC. Furthermore, bending and unbending tests were performed with the purpose of validating the models and study the operating performance of this material when subjected to these kinds of loading. The final purpose of this work is to present a numerical approach that can accurately predict the mechanical and failure behaviour of a real automotive safety component.1. Introduction
Flat rolled, HSLA steel sheets are often used in the automotive industry. As component geometries become more complex, and as they are required to have greater mechanical resistance, the limits of the forming process might be exceeded. In addition, material damage, created during forming, is critical to the component specification to avoid the risk of fracture in service. Therefore, the damage prediction is a key point in the optimization of these processes. To this end, the automobile manufacturers are increasingly relying on numerical simulation software in order to predict strain localization or tool wear. Concerning these aspects, the results obtained by simulation are usually fairly reliable. However, there are many other areas where simulation results are not completely representative of the reality. The objective of this work is to present a study of damage problems that can occur in forming processes, such as bending which is one of the processes frequently applied during manufacturing of these kinds of components that are obtained after blanking [1]. To establish an appropriate damage model, this study will be conducted through a combined experimental and numerical approach to better understand the limitations of current models and generate more suitable data. Bending and unbending tests were performed with the purpose to validate our models and study the operating performance of this material applied to these kinds of loading. This paper will focus on comparing various material behaviour laws and ductile damage models (both micro-mechanical and macro-micro-mechanical) that will be used to simulate forming operations of the component being studied. Two finite element codes will also be used to determine the limits of each law and each calculation code. The final purpose is to present a numerical approach to predict the mechanical behaviour and damage of the material studied.
2. Experimental study
2
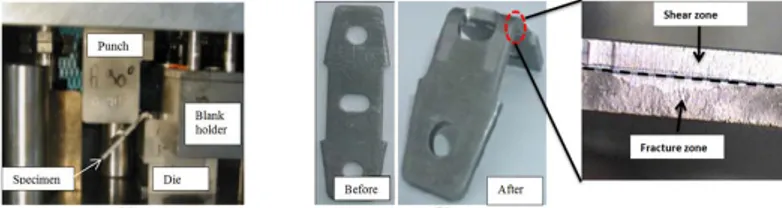
The material tested in this study is the S500MC HLSA steel. This material is commonly used in manufacture of automotive safety parts such as the buckle belt safety. The specimen under investigation has been blanked in two steps: blanking the outside shape, then blanking the interior holes. The bending operation has been done by a device designed specifically to characterize this process, the device is mounted on a press with force and displacement sensors. The bending device is shown in Figure 1-a. The specimen is bent at the oblong hole to study its bending behaviour after the blanking operation. The initial state of the specimen and the final state of the specimen after bending are shown in Figure 1-b; also the blanking profile of a specimen is shown.
Figure 1: Bending tools: (a) bending device, (b) shape of the specimen
2.2. Unbending study
After the specimen has been bent, it is clamped in a tensile test machine and pulled until fracture occurs. This test determines the strength of part after bending and represents loading that the part might see during crash. Figure 2 shows the unbending tools used in this study and the state of specimen before, during and at the end of unbending operation.
Figure 2: State of specimen: (a) before unbending, (b) during unbending, (c) after unbending
3. Numerical modelling
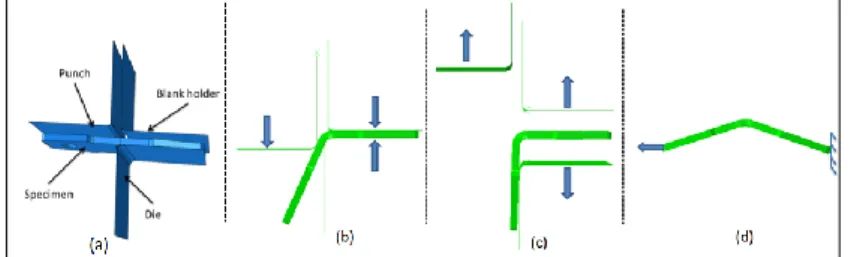
The bending and unbending operations of the experiments were simulated using two finite element codes: ABAQUS / Standard and PAM-STAMP. The results of these simulations were compared with the experiments in order to compare behaviour and damage models and their ability to predict the stress distribution and location of damage on the specimen. Figure 3 shows the tools used in the simulation by the two codes and different steps of simulation. The principle of this operation is to deform a plate held fixed between the die and blank holder under the action of a punch to obtain a bending angle of 90°. After the return of the punch and springback of the specimen, the die and the blank holder were removed to start the unbending phase. Here, one end of the specimen was fixed while a displacement was imposed on the other edge in order to straighten the specimen. The simulation of unbending allows us to predict the strength and deformation capacity of the part during service.
The simulation by ABAQUS / Standard used a Ludwick hardening law and the Gurson damage model as implemented by default in ABAQUS. In this code, the tools are modelled by analytical rigid body. Quadratic elements were used in the middle of the part. Particular attention has been devoted to areas adjacent to the oblong hole, because at this zone it will be bent and therefore the strain and stress levels will be important.
In the explicit FE code PAM-STAMP, the Hill’48 yield locus, the Bergström-van Liempt hardening law [7] and the CrachFEM fracture model [8] were used. The model was built
using 2D shell elements, these elements are not ideal for bending thick material however, in PAM-STAMP CrachFEM is currently only available for shell elements.
Figure 3. Tools and steps of simulation: (a) tools used in simulation, (b) bending phase, (c) end of bending and decline of tools, (d) unbending phase
3.1. Models used by ABAQUS Software
Hardening law. The behaviour law is the elastic-plastic law of Ludwick [2] written as:
̅ (1)
With is the initial yield strength, K is the hardening modulus, n is the hardening
exponent and ̅ is the plastic equivalent strain.
Damage modelling. The damage model according to Gurson, Tvergaard and Needlemann
(GTN), is applied for numerical damage modelling. The GTN damage model was implemented in ABAQUS [3]. The yield potential is described as follows [4-5]:
( ) ( ) ( ) (2)
q1, q2 and q3 are the constitutive parameters of the model, is the von Mises equivalent
stress, is the hydrostatic stress and is the yield stress of matrix material. The
total variation of f due to a plastic deformation increment is the sum of contributions due to
cavities growth ̇ and new voids nucleation ̇: ̇ ̇ ̇ ̅̇ (3)
Where f is the void volume fraction, ̇ is the plastic strain rate due to hydrostatic stress,
̅̇
is the equivalent plastic strain rate and the form of a Gaussian probability is given by:
√ ( ̅ )
(4)
With fN is the void volume fraction created by nucleation, εN is the average strain for which
nucleation is maximal and SN is the standard deviation of the Gaussian normal distribution.
To take void coalescence into account, the function f* is the volume fraction changed cavities (porosity fictitious), is given by [6]:
{ , √ (5)
Where fc is the critical void volume fraction for which coalescence begins, and ff is the void
volume fraction at rupture. In most research works ff is identified numerically and usually
close to 25%. In ABAQUS\Standard, these tow parameters are unusable [3].
3.2. Models used by PAM-STAMP Software
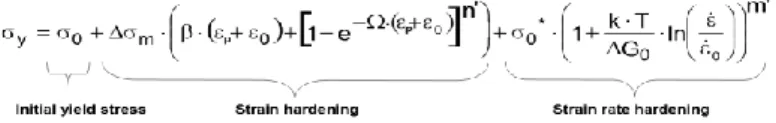
Hardening law. The second hardening law used in this study is the Bergström–van Liempt
4
(6)
Where 0, m, *0 and m’ are fitted parameters, T is the temperature, k the Boltzman
constant, G0 the activation energy for dislocations to pass an obstacle and
the strainrate. The equation adds the components of the strain hardening and strain rate hardening to an initial yield stress. The strain rate hardening part is based on thermal activation of dislocation movement (higher strain rates or lower temperatures cause more difficulty for dislocations to move). When tensile tests are only done at 1 strain rate (and 1 temperature),
the parameters σ0* and m’ cannot be determined by a fit to the experiments. In that case an
estimate of the parameters will be used.
Damage modelling. The damage model used in PAM-STAMP in this study is the
commercially available CrachFEM model [8]. This model, implemented in FE codes such as PAM-STAMP and LS-DYNA, is a local fracture model that predicts three failure risks: instability risk, ductile fracture risk and ductile shear fracture risk. For each of the failure mechanisms, CrachFEM has a separate failure curve which is similar to a FLC. CrachFEM evaluates the risk of fracture by looking at the distance between the current strain state and the failure curve. As the instability curve is calculated based on the deformation history, it may shift depending on the type of loading that is applied thereby making ductile and shear fracture more likely. For example, in bending, instability is suppressed and ductile fracture becomes dominant. Figure 4 shows the failure curve for the case of straight strain paths and without bending effects. For a constant strain path, the failure risk is determined by the distance to the failure curve. At a failure risk of 1, fracture is predicted. In order to take some strain path dependency into account, the failure risk is integrated over the strain history.
Figure 4. CrachFEM failure curves for S500MC.
4. Results – Discussion
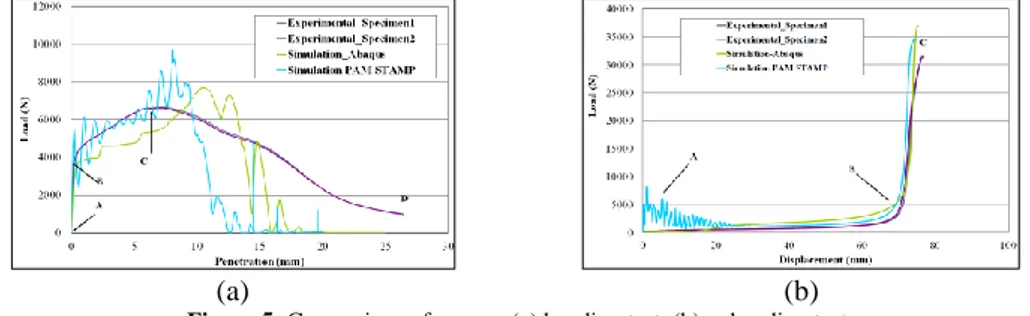
In order to compare the predictive ability of the different models during the bending and unbending operations, the predicted punch force versus punch displacement curves and the unbending force versus displacement of the cross-head were compared with the experimental curves, see Figure 5. We can decompose the experimental curves in Figure 6-a in three me6-an zones. AB zone th6-at corresponds to the el6-astic zone of m6-ateri6-al where the load increases linearly. The BC zone shows the plastic behaviour of bending zone, the maximum value of bending load is equal to 6640N. The end zone CD shows the decrease of bending load, in this zone the contact surface between punch and specimen increase. We can observe a large difference between the experimental curves and ABAQUS prediction, due to the insufficient of models used by ABAQUS. However, the prediction by PAM-STAMP on the AB and BC zones are acceptable. The oscillations observed are due to the problems of inertia. The zone CD is not predicted well by PAM-STAMP as shell elements are not able to account for stresses normal to the sheet plane that occur in this phase of bending. Figure 5-b shows the evolution of unbending load versus displacement of the cross-head. We can decompose the curves on two zones: AB zone that corresponds an
0 0.5 1 1.5 2 2.5 -1 -0.5 0 0.5 1
Strain ratio [minor/major]
Fra c ture s tra in [-] Instability Ductile Normal fracture Ductile Shear fracture
unbending phase, this operation requires a displacement of about 70mm with a relatively small effort to achieve an almost straight shape of the specimen. The second zone BC represents the tension phase where the load increases rapidly till a maximum value of 32 kN which corresponds to fracture of the specimens. The numerical models used by ABAQUS gives an evolution of load almost close to the real case, except for the fracture point due to the absence of parameters responsible to fracture in GTN damage model implemented in ABAQUS\Standard. For PAM-STAMP, there are initially some inertia effects but the force needed for unbending is predicted quite well. PAM-STAMP predicts fracture to occur at a force of 34 kN; which is close to the experiments.
(a) (b)
Figure 5: Comparison of curves: (a) bending test, (b) unbending test
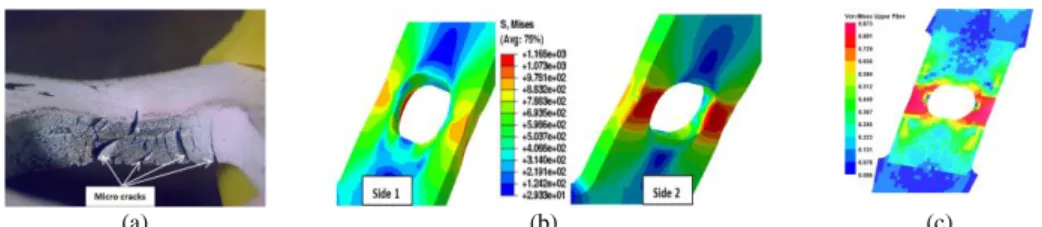
Figure 6-a shows a micrographic observation of the bent zone of two specimens, changing the face of the specimen to study the effect of the blanking zones (Figure 1-b) on the damage to the part. The specimen 1 shows an appearance of microcracks on the top of the bent zone in the level of fracture zone. The specimen 2 was bent in the opposite direction (shear zone) which indicates the absence of microcracks. This observation allows us to highlight the interaction of the bending process with blanking process. The maximum equivalent stress obtained by ABAQUS (744MPa) appears inside the crease on the side of compressed fibres and on the edge of the hole. There is a stress concentration at the bended area (Figure 7-b) where equivalent plastic strains are very important because they can reach 48%. For the PAM-STAMP simulation, the equivalent plastic strain at the bending area reached values up to 47% however, the fracture risks remain small and no fracture is predicted. The contour plot of the equivalent stress at the end of the bending operation is depicted in Figure 6-c where maximum values reached 789 MPa; this is slightly higher than the results of ABAQUS. Overall, the results of ABAQUS and PAM-STAMP are quite close.
(a) (b) (c)
Figure 6: Profile of specimen after bending and spring-back phenomena: (a) experimental observation, (b) stress distribution obtained by ABAQUS in two sides and (c) Stress distribution obtained by PAM STAMP Figure 7 shows the profile of the specimen during unbending. The stress prediction by ABAQUS simulation (Figure 7-b) shows the concentration of stress with a maximum value equal to 1168 MPa. Figure 7 shows that the damage is localised at the level of hole in the below side, this conclusion is validated by micrographic observation presented in Figure 7-a. For the PAM STAMP simulation, the maximum equivalent stress before fracture was 942 MPa and the location of fracture is predicted correctly. Damage parameter and failure risk after bending and at the moment of fracture during unbending are shown in Figure 8.
6
(a) (b) (c)
Figure 7: Profile of specimen during unbending: (a) experimental observation, (b) stress distribution obtained by ABAQUS in two sides and (c) Stress distribution obtained by PAM STAMP
(a) (b)
Figure 8: (a) Damage parameter (Gurson), (b) Overall failure risk (CrachFEM)
Conclusion
From comparison of the simulations using ABAQUS and PAM-STAMP with the experiments, the following conclusions can be drawn:
- Force displacement curve for bending and unbending obtained from PAM STAMP
simulations are close to experiments. The end of the bending operation is not well predicted as the shell elements cannot handle stresses in the normal direction that are present in the experiment.
- The overall evolution of force-displacement curves obtained from ABAQUS is close to
experimental curve. However, should be tested other models to consider similar phenomena to those kinds of processes and to get a more accuracy. The prediction of stress and damage fields in the bending zone is acceptable compared to experimental observations. The use of 3D elements in ABAQUS compared to shell elements is allows us to analyze the part on both sides.
- The force needed to fracture the specimen in unbending operation is well predicted by
both models with an error 18 % by ABAQUS and 9.6 % by PAM STAMP.
- The microcracks that occur at the edge of the specimen are influenced by the quality of
the cut edge. This has not been accounted for in the simulations.
- The results of both approaches are close to reality. Both solids and shells can give good
predictions.
- The study will continue to develop more relevant models and to study the influence of
process parameters, also to analyze the residual stresses in the bending zone.
References
[1] R. Bahloul, A. Mkaddem, Ph. Dal Santo, A. Potiron, Sheet metal bending optimisation using response surface method, numerical simulation and design of experiments.
[2] P. Ludwick. Elemente der technologischen mechanik. Springer Verlag, Berlin, 1909. [3] Abaqus, 2010. Reference Manuals,v 6.10.Abaqus Inc.
[4] V. Tvergaard, International Journal of Fracture 18 (1982) 237–252.
[5] A. Needleman, V. Tvergaard, Journal of the Mechanics and Physics of Solids 35 (1987) 151–183. [6] V. Tvergaard, A. Needleman. Acta Metall. Mater., vol.32 (1984), p.157- 169.
[7] Henk Vegter, Carel H.L.J. ten Horn, Yuguo An, Eisso H. Atzema, Hermen H. Pijlman, Ton H. van den Boogaard, Han Huétink, “Characterisation And Modelling Of The Plastic Material Behaviour And Its Application In Sheet Metal Forming Simulation”, Proceedings of the Seventh International conference on Computational Plasticity, Barcelona (Spain), 2003
[8] C.H.L.J. ten Horn, M.P.J. Lambriks and K. Unruh, “Testing Methods for Fracture Modelling: The Need for Harmonisation” in Conference proceedings of Werkstoffprüfung 2009.